| Param | Original file | Final file |
|---|---|---|
| Filename | modeM0/AS1C09_011T06_9000006468_51987cztM0_level2.fits | modeM0/AS1C09_011T06_9000006468_51987cztM0_level2_quad_clean.evt |
| Size (bytes) | 867,159,360 | 76,942,080 |
| Size | 827.0 MB | 73.4 MB |
| Events in quadrant A | 6,132,877 | 537,947 |
| Events in quadrant B | 5,401,930 | 633,120 |
| Events in quadrant C | 6,086,777 | 528,821 |
| Events in quadrant D | 13,989,129 | 187,944 |
| Mode M0 | |||
|---|---|---|---|
| Quadrant | BADHDUFLAG | Total packets | Discarded packets |
| A | 0 | 22594 | 1 |
| B | 0 | 20474 | 1 |
| C | 0 | 22621 | 3 |
| D | 0 | 45847 | 1 |
| Mode M9 | |||
|---|---|---|---|
| Quadrant | BADHDUFLAG | Total packets | Discarded packets |
| A | 0 | 11 | 0 |
| B | 0 | 11 | 0 |
| C | 0 | 11 | 0 |
| D | 0 | 11 | 0 |
| Mode SS | |||
|---|---|---|---|
| Quadrant | BADHDUFLAG | Total packets | Discarded packets |
| A | 0 | 130 | 0 |
| B | 0 | 130 | 0 |
| C | 0 | 130 | 0 |
| D | 0 | 130 | 0 |
| Quadrant | Total seconds | Saturated seconds | Saturation percentage |
|---|---|---|---|
| A | 6319 | 969 | 15.334705% |
| B | 6320 | 495 | 7.832278% |
| C | 6319 | 929 | 14.701693% |
| D | 6319 | 4570 | 72.321570% |
Noise dominated data is calculated using 1-second bins in cleaned event files. If a bin has >2000 counts, and if more than 50% of those come from <1% of pixels, then it is considered to be noise-dominated and hence unusable.
| Quadrant | # 1 sec bins | Bins with >0 counts | Bins with >2000 counts | High rate bins dominated by noise | Noise dominated (total time) | Noise dominated (detector-on time) | Marked lightcurve |
|---|---|---|---|---|---|---|---|
| A | 7434 | 6320 | 723 | 723 | 9.73% | 11.44% | 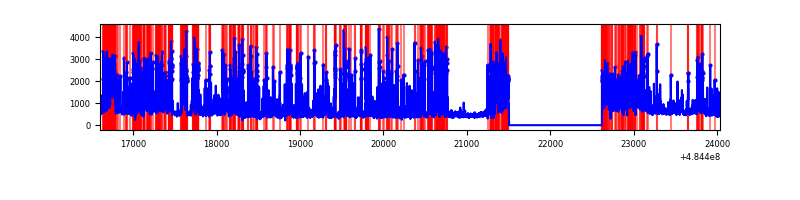 |
| B | 7434 | 6320 | 324 | 324 | 4.36% | 5.13% | 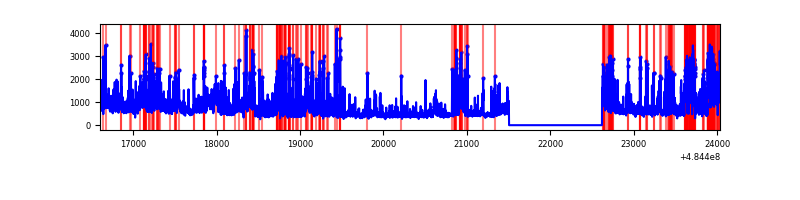 |
| C | 7434 | 6320 | 753 | 753 | 10.13% | 11.91% | 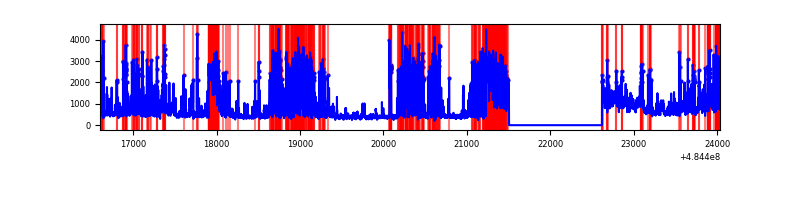 |
| D | 7434 | 6319 | 4258 | 4258 | 57.28% | 67.38% | 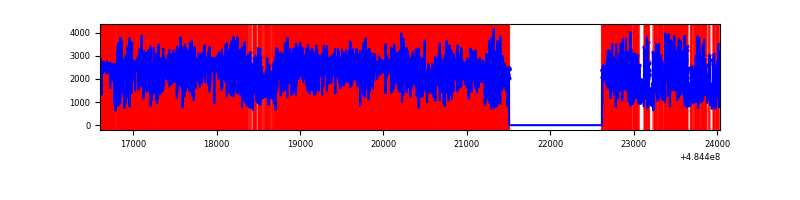 |
Top three noisy pixels from each quadrant. If the there are fewer than three noisy pixels in the level2.evt file, extra rows are filled as -1
| Pixel properties | Quadrant properties | ||||||
|---|---|---|---|---|---|---|---|
| Quadrant | DetID | PixID | Counts | Sigma | Mean | Median | Sigma |
| A | 7 | 64 | 2510717 | 15817.5 | 630 | 614 | 158.7 |
| A | 2 | 48 | 288558 | 1814.49 | 630 | 614 | 158.7 |
| A | 4 | 3 | 173962 | 1092.36 | 630 | 614 | 158.7 |
| B | 10 | 128 | 613981 | 4442.42 | 656 | 635 | 138.1 |
| B | 4 | 206 | 473413 | 3424.29 | 656 | 635 | 138.1 |
| B | 4 | 171 | 401850 | 2905.97 | 656 | 635 | 138.1 |
| C | 15 | 224 | 2147294 | 12553.79 | 623 | 620 | 171.0 |
| C | 15 | 147 | 360482 | 2104.48 | 623 | 620 | 171.0 |
| C | 9 | 38 | 280781 | 1638.39 | 623 | 620 | 171.0 |
| D | 2 | 172 | 4301512 | 31918.85 | 464 | 443 | 134.8 |
| D | 6 | 42 | 3503997 | 26000.38 | 464 | 443 | 134.8 |
| D | 12 | 17 | 2280323 | 16919.32 | 464 | 443 | 134.8 |
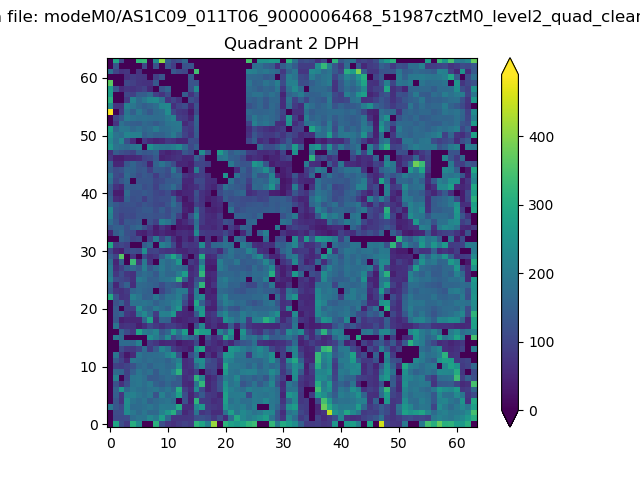
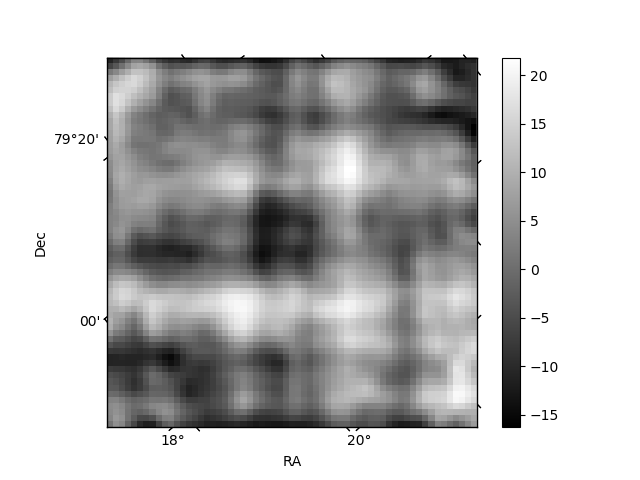
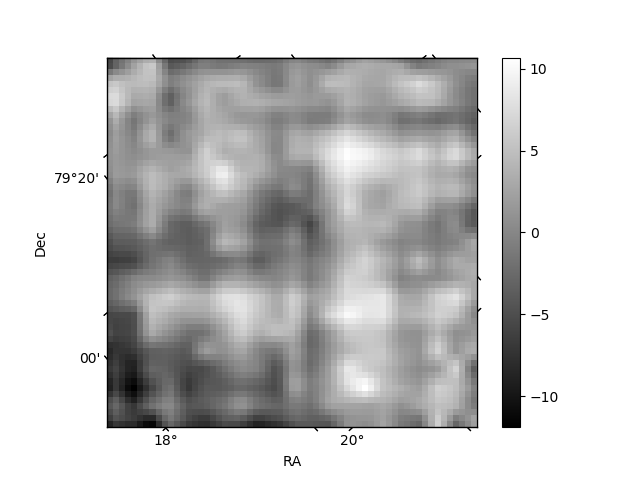
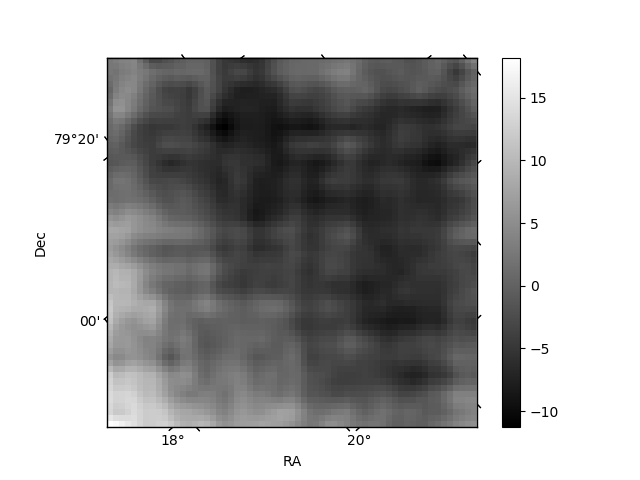
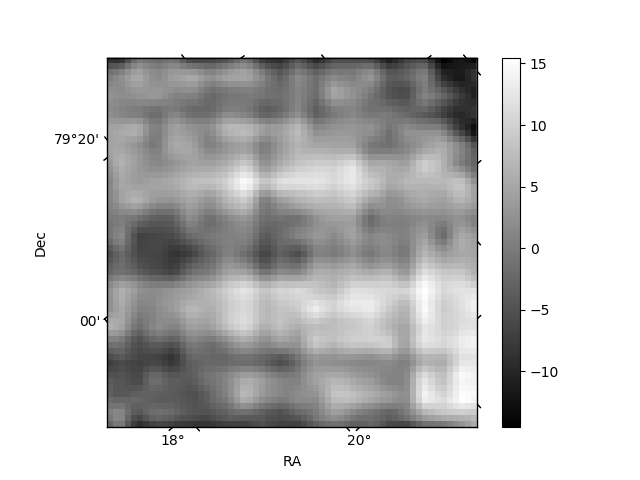
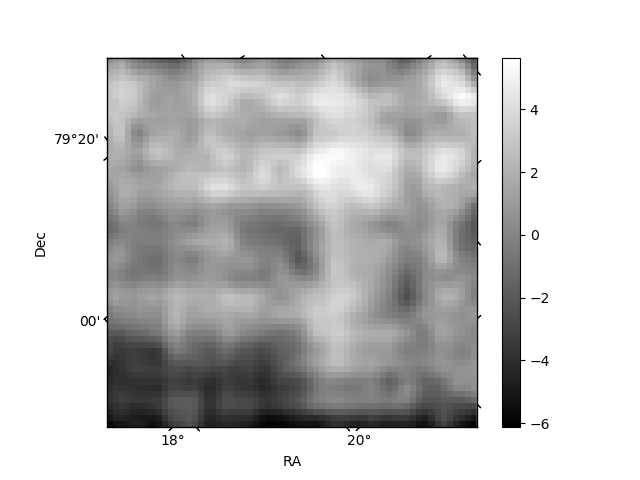
Histogram calculated using DETX and DETY for each event in the final _common_clean file
| Quadrant A | 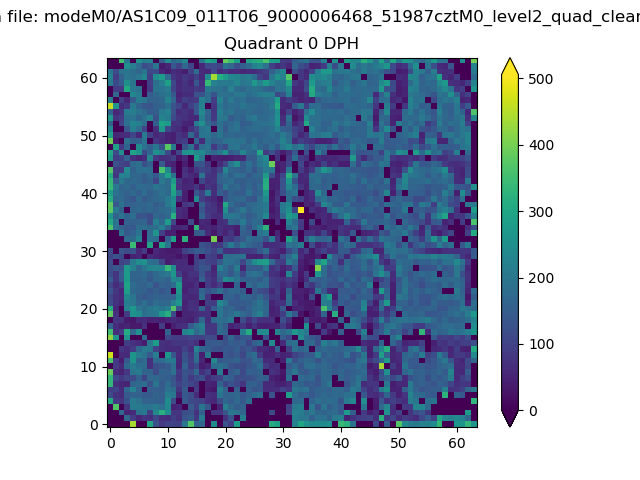 |
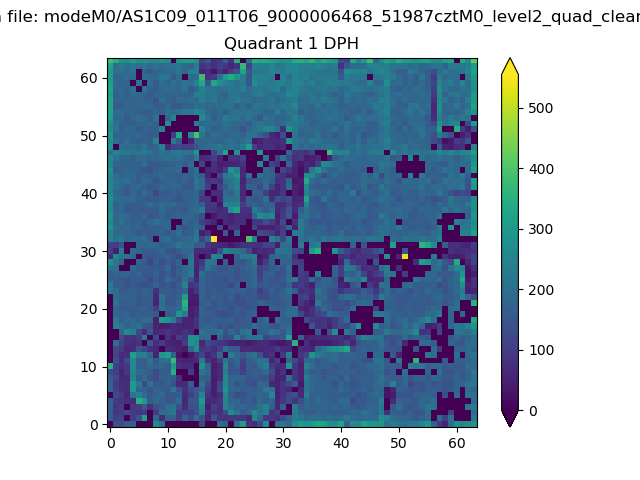 |
Quadrant B |
|---|---|---|---|
| Quadrant D | 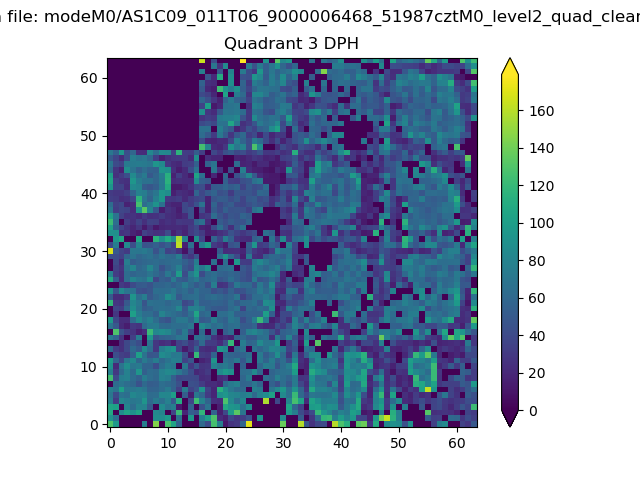 |
 |
Quadrant C |
| Plot type | Count rate plots | Images |
|---|---|---|
| Comparison with Poisson distribution Blue bars denote a histogram of data divided into 1 sec bins. Red curve is a Poisson curve with rate = median count rate of data. |
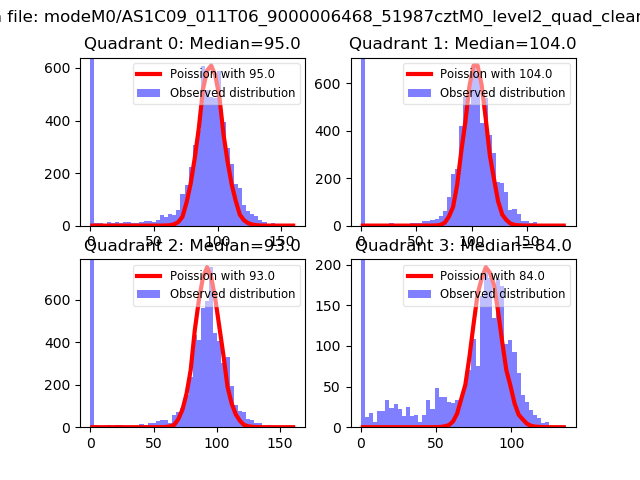 |
 |
| Quadrant-wise count rates Data is divided into 100 sec bins |
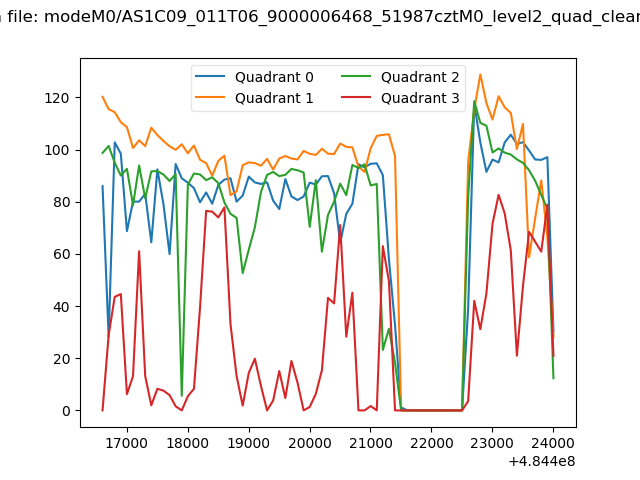 |
|
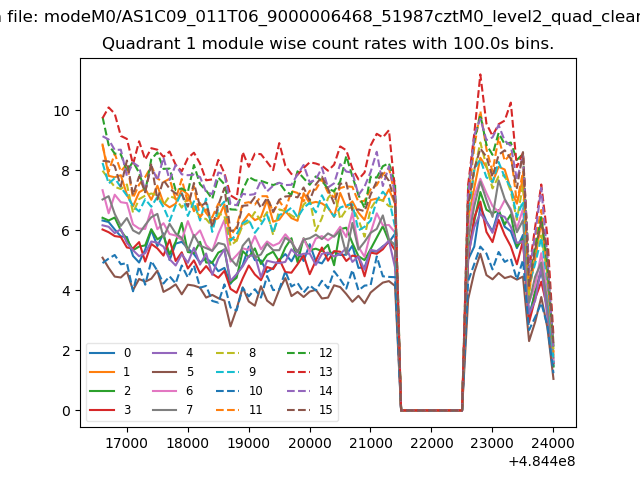
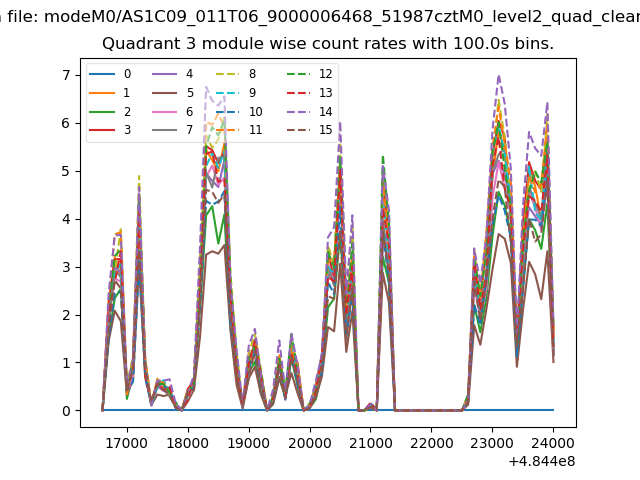
| Module-wise count rates for Quadrant A Data is divided into 100 sec bins |
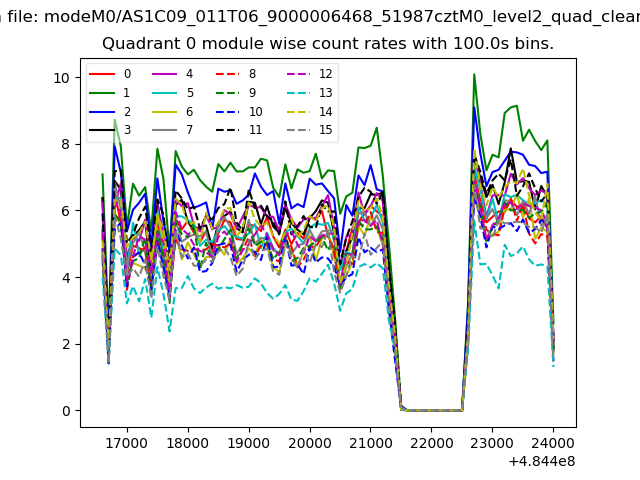 |
 |
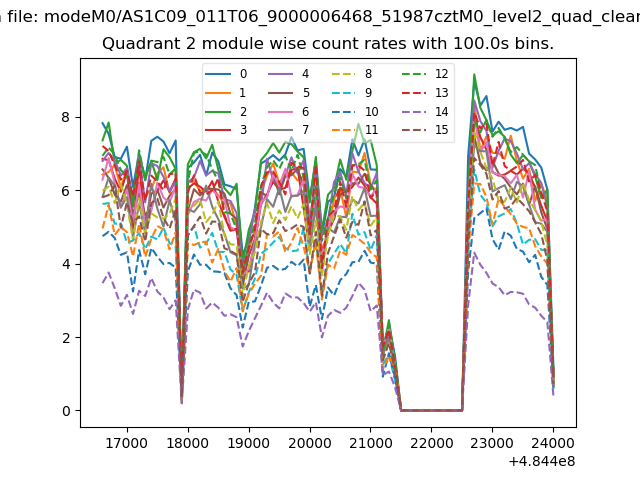
| Module-wise count rates for Quadrant B Data is divided into 100 sec bins |
 |
 |
| Module-wise count rates for Quadrant C Data is divided into 100 sec bins |
 |
 |
| Module-wise count rates for Quadrant D Data is divided into 100 sec bins |
 |
 |
| Parameter | Plot |
|---|---|
| CZT HV Monitor | 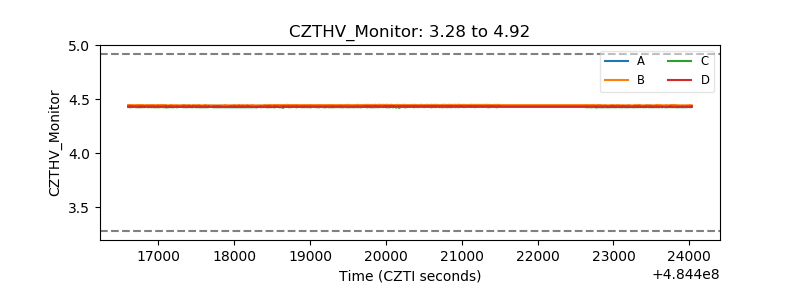 |
| D_VDD | 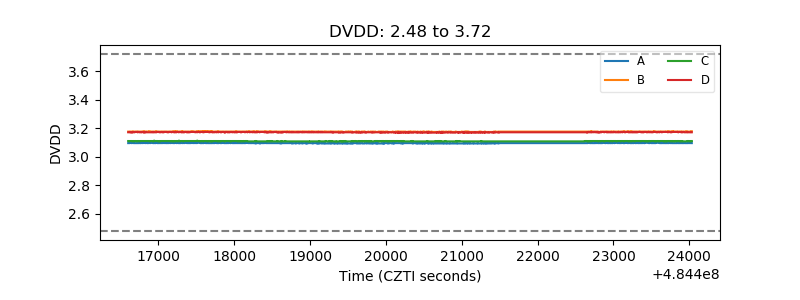 |
| Temperature 1 | 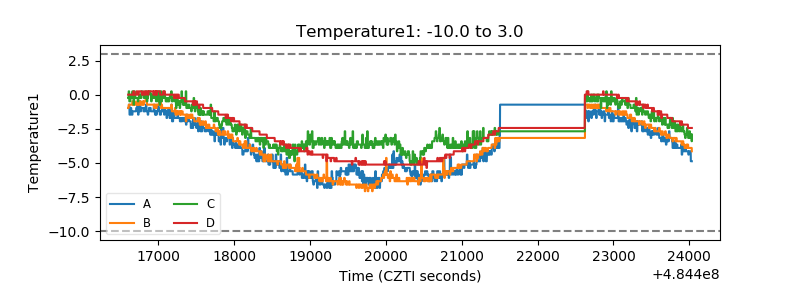 |
| Veto HV Monitor |  |
| Veto LLD | 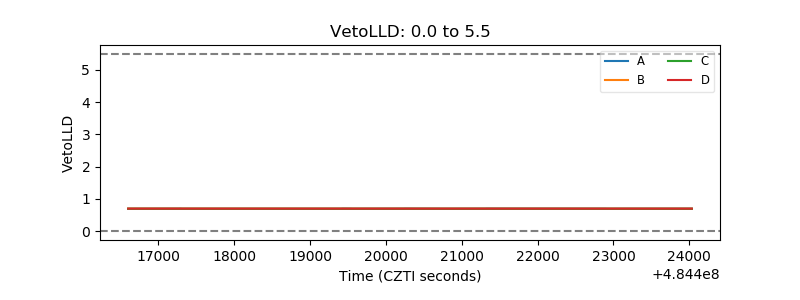 |
| Alpha Counter | 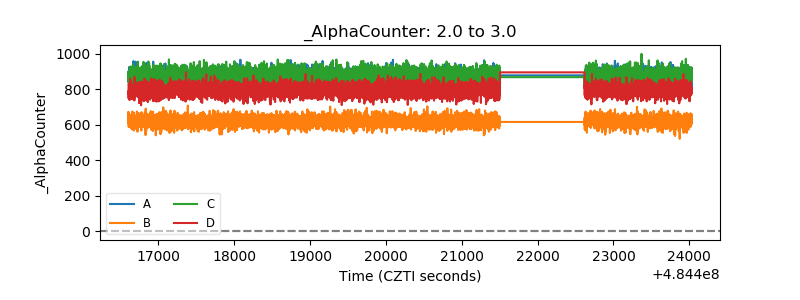 |
| _CPM_Rate | 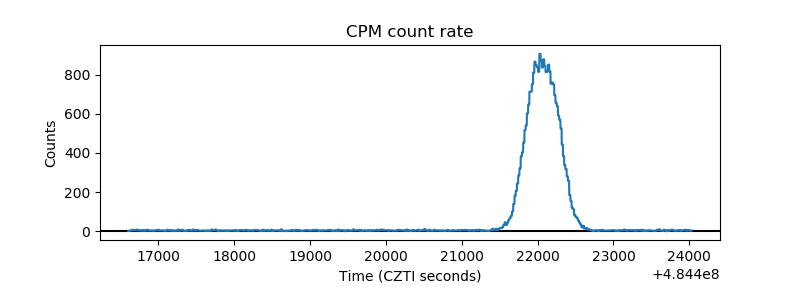 |
| CZT Counter | 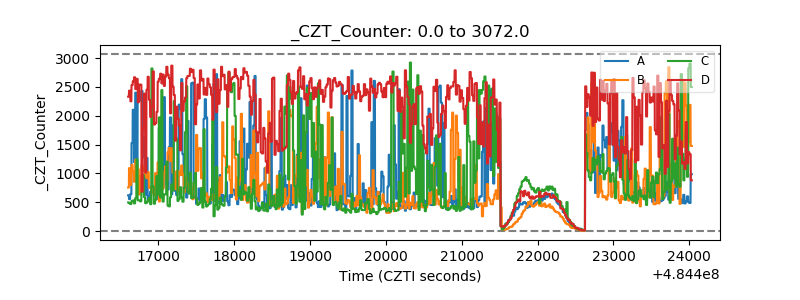 |
| +2.5 Volts monitor | 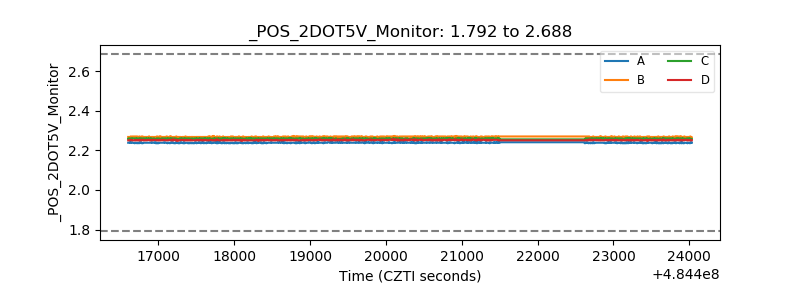 |
| +5 Volts monitor | 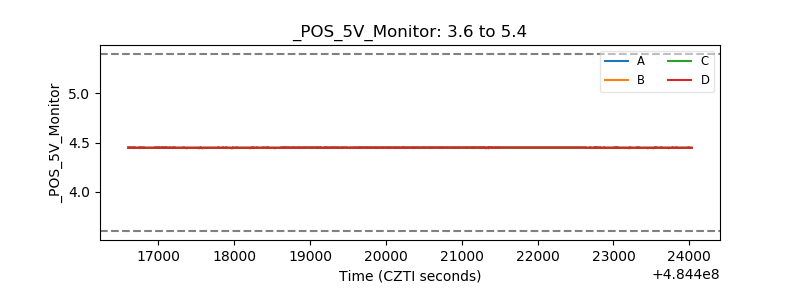 |
| _ROLL_ROT | 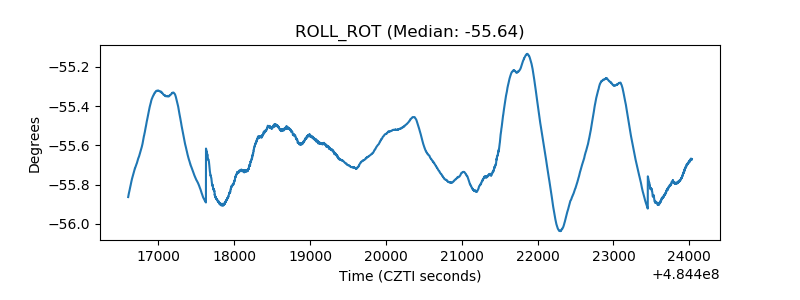 |
| _Roll_DEC | 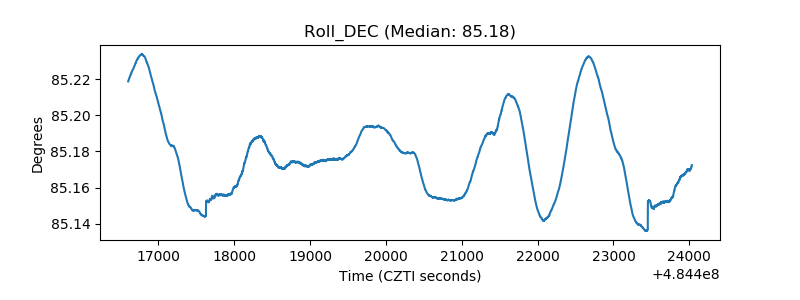 |
| _Roll_RA | 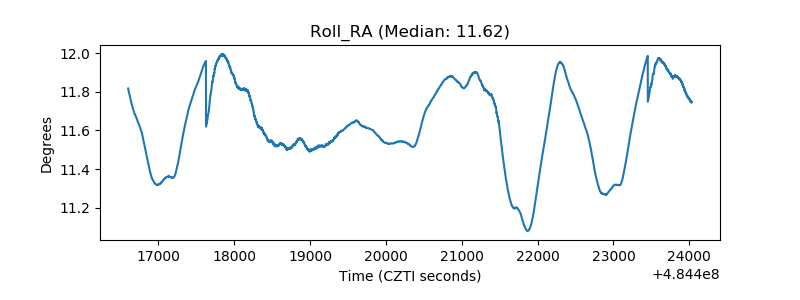 |
| Veto Counter | 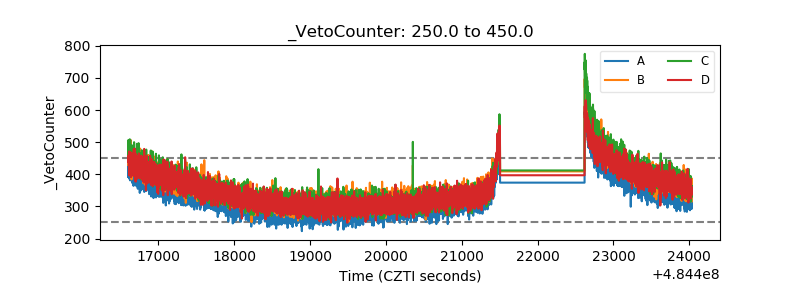 |