| Param | Original file | Final file |
|---|---|---|
| Filename | modeM0/AS1C09_011T06_9000006468_51988cztM0_level2.fits | modeM0/AS1C09_011T06_9000006468_51988cztM0_level2_quad_clean.evt |
| Size (bytes) | 773,461,440 | 88,272,000 |
| Size | 737.6 MB | 84.2 MB |
| Events in quadrant A | 6,075,977 | 571,942 |
| Events in quadrant B | 5,617,748 | 646,149 |
| Events in quadrant C | 7,274,008 | 542,221 |
| Events in quadrant D | 9,163,996 | 461,000 |
| Mode M0 | |||
|---|---|---|---|
| Quadrant | BADHDUFLAG | Total packets | Discarded packets |
| A | 0 | 22488 | 5 |
| B | 0 | 21218 | 2 |
| C | 0 | 26204 | 2 |
| D | 0 | 31803 | 2 |
| Mode M9 | |||
|---|---|---|---|
| Quadrant | BADHDUFLAG | Total packets | Discarded packets |
| A | 0 | 12 | 0 |
| B | 0 | 12 | 0 |
| C | 0 | 12 | 0 |
| D | 0 | 12 | 0 |
| Mode SS | |||
|---|---|---|---|
| Quadrant | BADHDUFLAG | Total packets | Discarded packets |
| A | 0 | 132 | 0 |
| B | 0 | 132 | 0 |
| C | 0 | 132 | 0 |
| D | 0 | 132 | 0 |
| Quadrant | Total seconds | Saturated seconds | Saturation percentage |
|---|---|---|---|
| A | 6463 | 862 | 13.337459% |
| B | 6464 | 679 | 10.504332% |
| C | 6464 | 1178 | 18.224010% |
| D | 6464 | 1599 | 24.737005% |
Noise dominated data is calculated using 1-second bins in cleaned event files. If a bin has >2000 counts, and if more than 50% of those come from <1% of pixels, then it is considered to be noise-dominated and hence unusable.
| Quadrant | # 1 sec bins | Bins with >0 counts | Bins with >2000 counts | High rate bins dominated by noise | Noise dominated (total time) | Noise dominated (detector-on time) | Marked lightcurve |
|---|---|---|---|---|---|---|---|
| A | 7627 | 6463 | 628 | 628 | 8.23% | 9.72% | 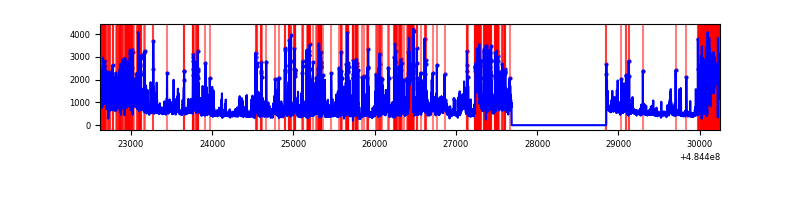 |
| B | 7629 | 6465 | 414 | 414 | 5.43% | 6.40% | 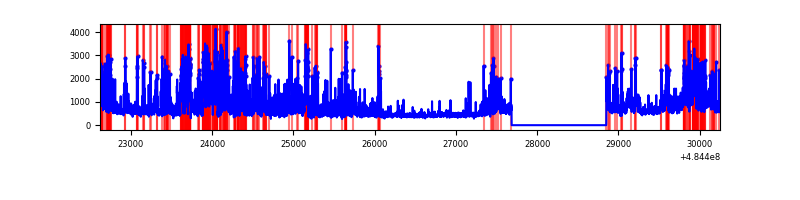 |
| C | 7629 | 6465 | 994 | 994 | 13.03% | 15.38% | 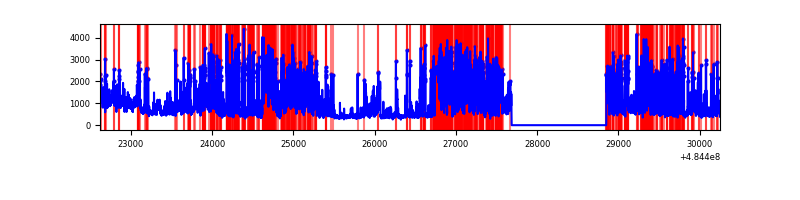 |
| D | 7628 | 6464 | 1343 | 1343 | 17.61% | 20.78% | 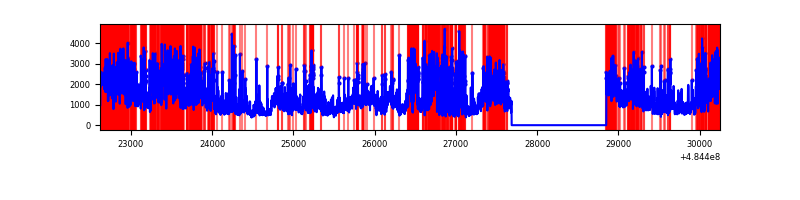 |
Top three noisy pixels from each quadrant. If the there are fewer than three noisy pixels in the level2.evt file, extra rows are filled as -1
| Pixel properties | Quadrant properties | ||||||
|---|---|---|---|---|---|---|---|
| Quadrant | DetID | PixID | Counts | Sigma | Mean | Median | Sigma |
| A | 7 | 64 | 1965945 | 11967.49 | 656 | 641 | 164.2 |
| A | 4 | 95 | 403749 | 2454.68 | 656 | 641 | 164.2 |
| A | 2 | 48 | 305241 | 1854.83 | 656 | 641 | 164.2 |
| B | 4 | 206 | 753748 | 5260.85 | 676 | 652 | 143.2 |
| B | 4 | 171 | 357688 | 2494.12 | 676 | 652 | 143.2 |
| B | 8 | 128 | 322600 | 2249.01 | 676 | 652 | 143.2 |
| C | 15 | 224 | 2513357 | 14112.74 | 644 | 636 | 178.0 |
| C | 4 | 5 | 1205419 | 6766.68 | 644 | 636 | 178.0 |
| C | 9 | 38 | 292109 | 1637.06 | 644 | 636 | 178.0 |
| D | 12 | 17 | 1938244 | 10951.32 | 616 | 589 | 176.9 |
| D | 6 | 42 | 1469578 | 8302.5 | 616 | 589 | 176.9 |
| D | 8 | 176 | 911050 | 5145.78 | 616 | 589 | 176.9 |
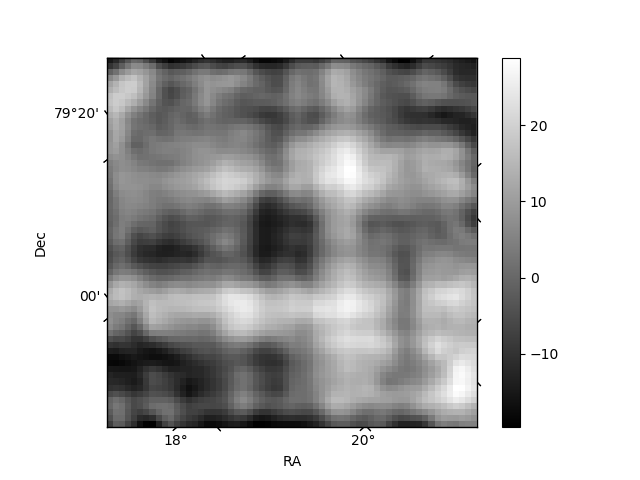
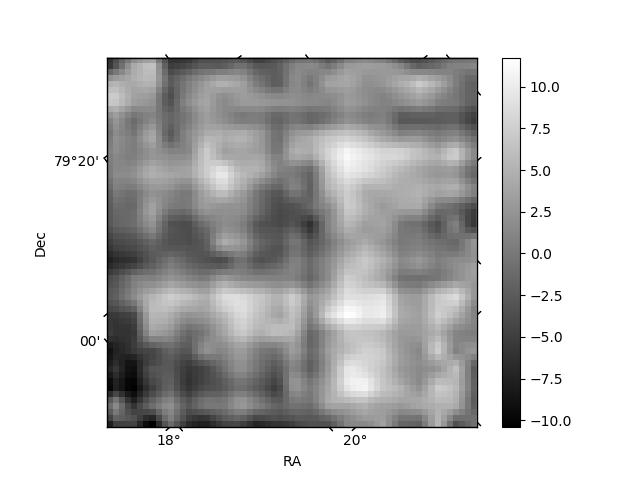
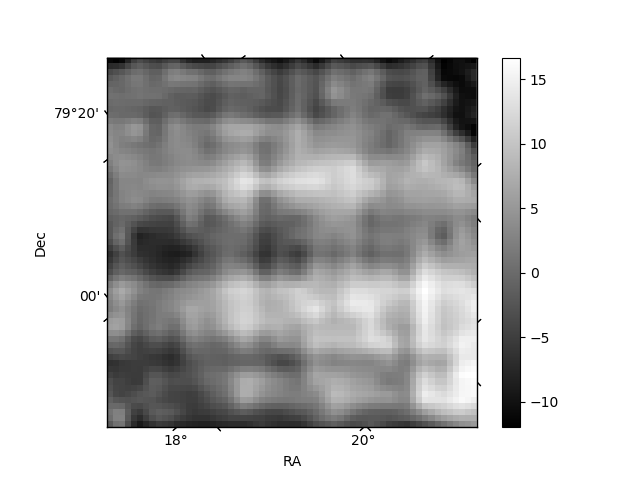
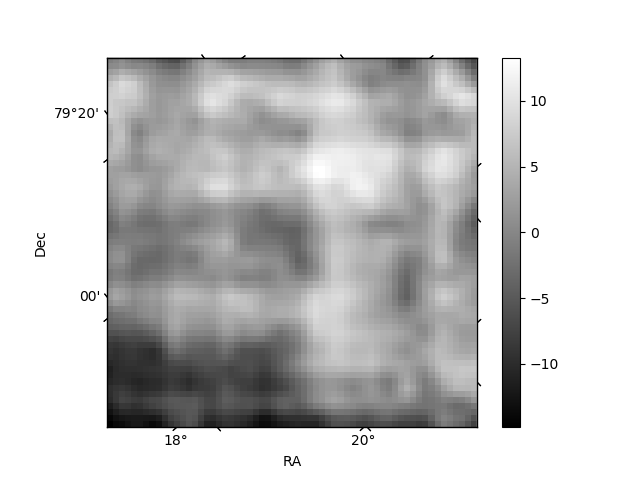
Histogram calculated using DETX and DETY for each event in the final _common_clean file
| Quadrant A | 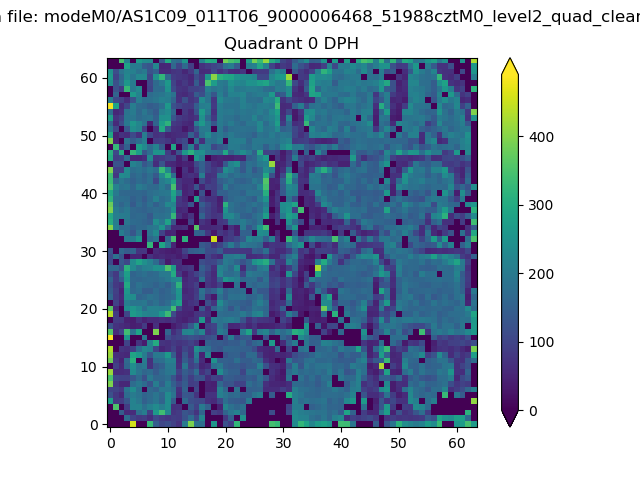 |
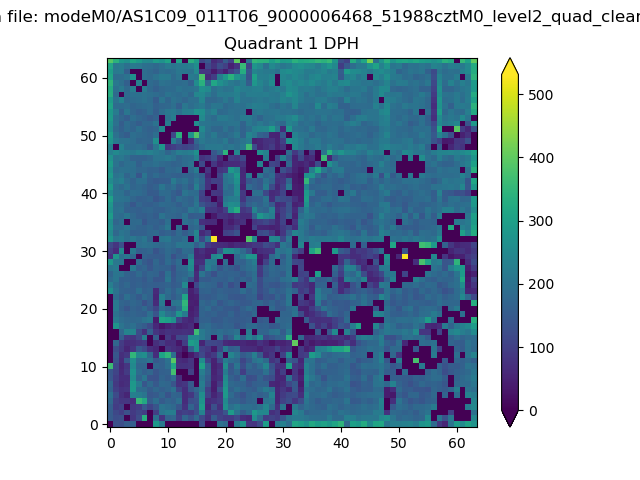 |
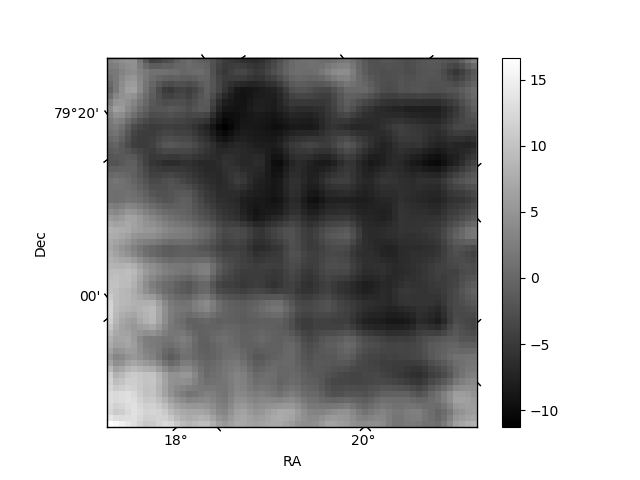
Quadrant B |
|---|---|---|---|
| Quadrant D | 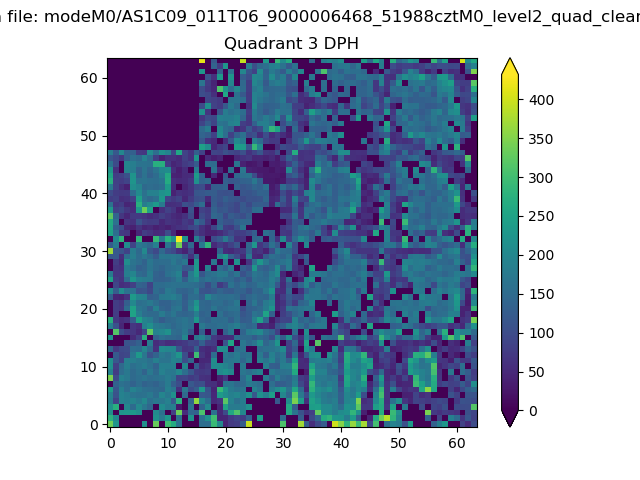 |
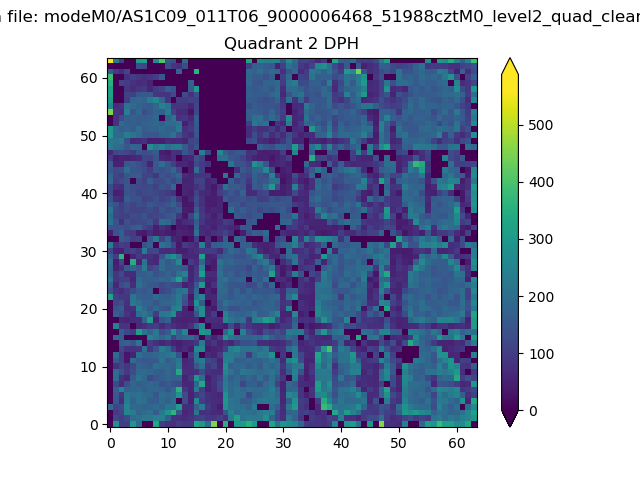 |
Quadrant C |
| Plot type | Count rate plots | Images |
|---|---|---|
| Comparison with Poisson distribution Blue bars denote a histogram of data divided into 1 sec bins. Red curve is a Poisson curve with rate = median count rate of data. |
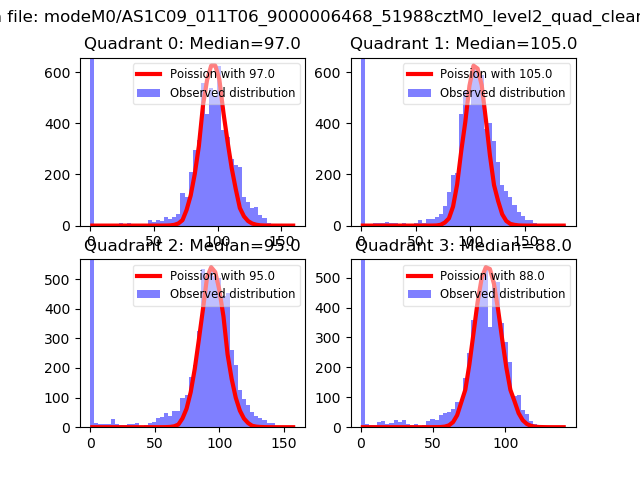 |
 |
| Quadrant-wise count rates Data is divided into 100 sec bins |
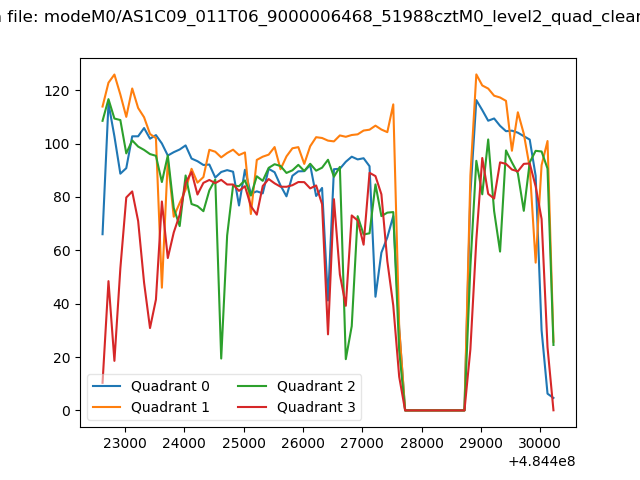 |
|
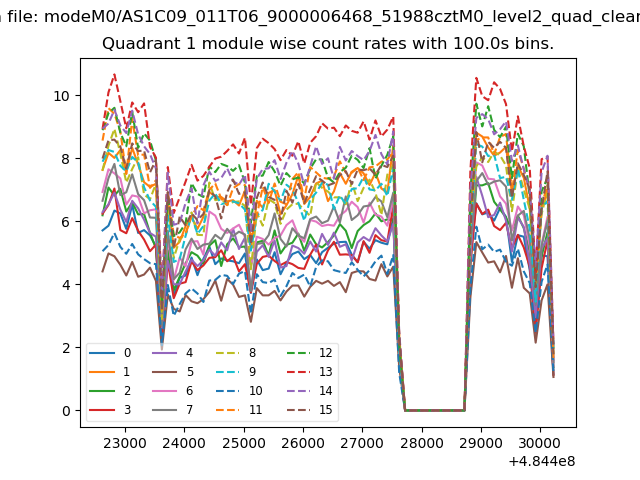
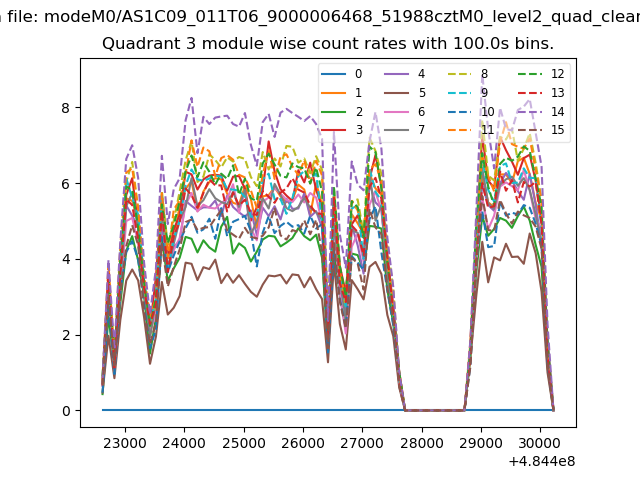
| Module-wise count rates for Quadrant A Data is divided into 100 sec bins |
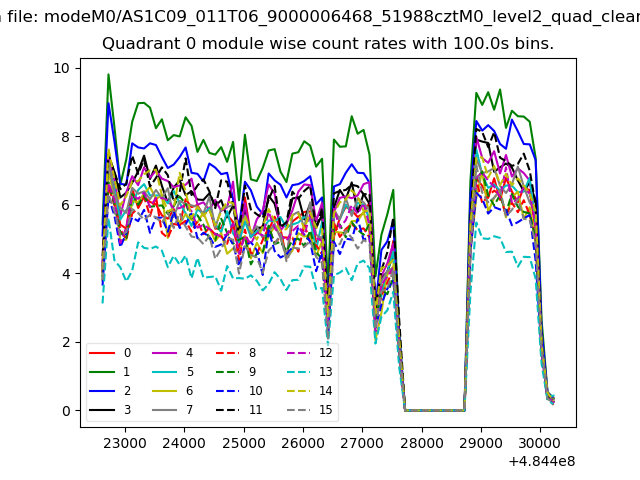 |
 |
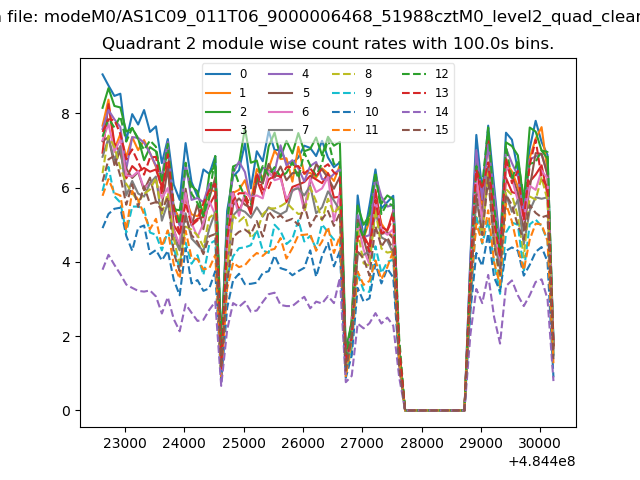
| Module-wise count rates for Quadrant B Data is divided into 100 sec bins |
 |
 |
| Module-wise count rates for Quadrant C Data is divided into 100 sec bins |
 |
 |
| Module-wise count rates for Quadrant D Data is divided into 100 sec bins |
 |
 |
| Parameter | Plot |
|---|---|
| CZT HV Monitor | 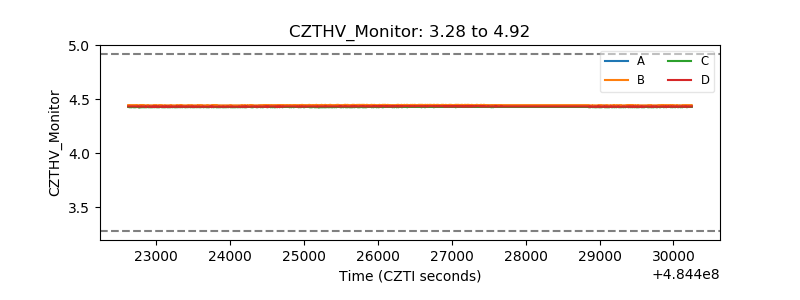 |
| D_VDD | 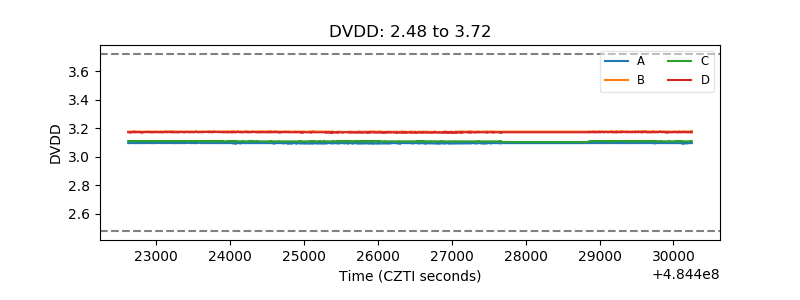 |
| Temperature 1 | 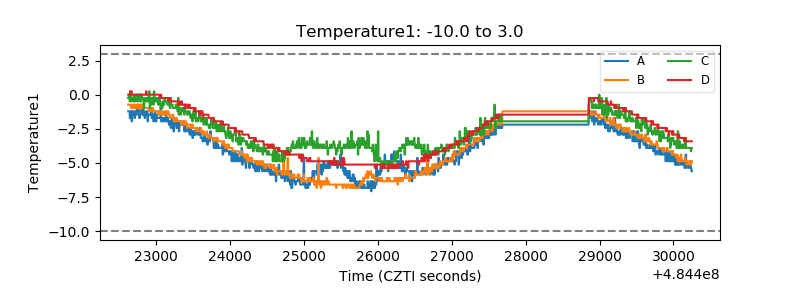 |
| Veto HV Monitor | 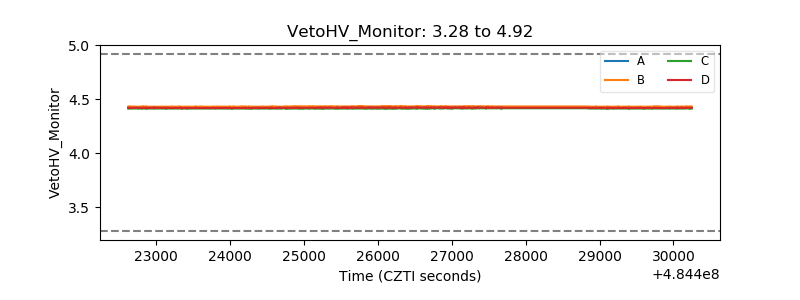 |
| Veto LLD | 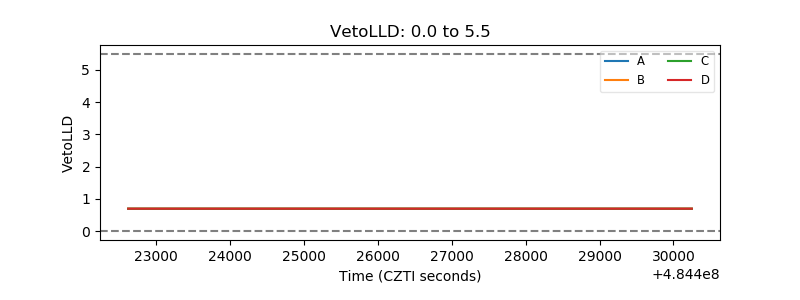 |
| Alpha Counter |  |
| _CPM_Rate | 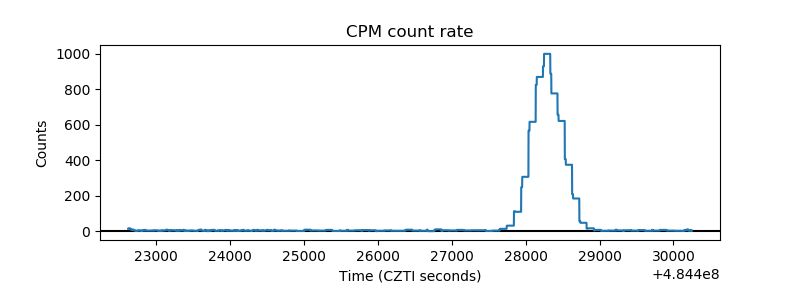 |
| CZT Counter | 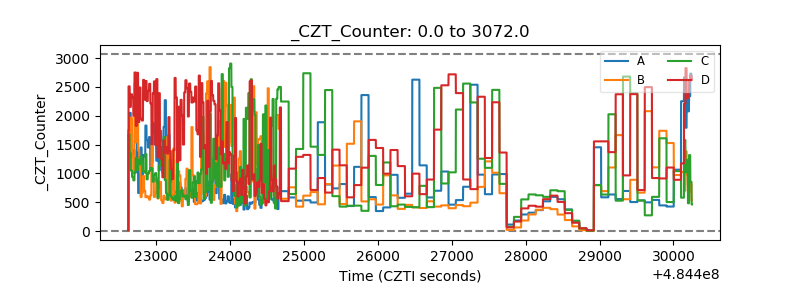 |
| +2.5 Volts monitor | 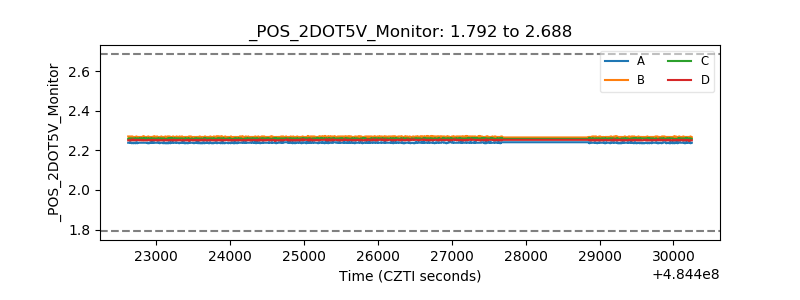 |
| +5 Volts monitor | 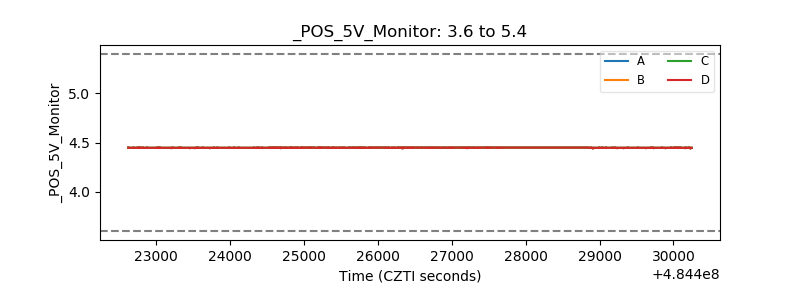 |
| _ROLL_ROT | 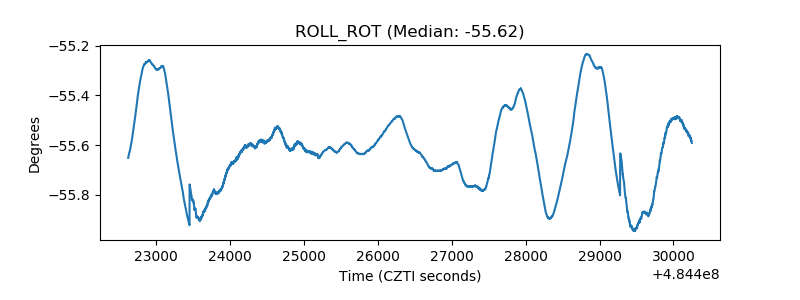 |
| _Roll_DEC | 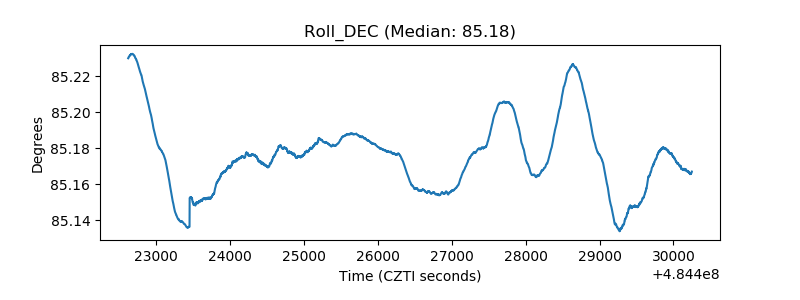 |
| _Roll_RA | 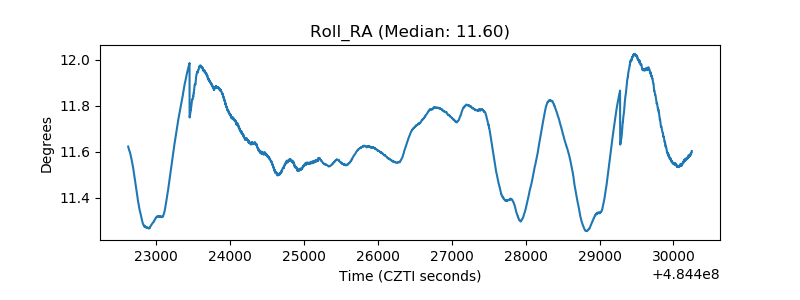 |
| Veto Counter | 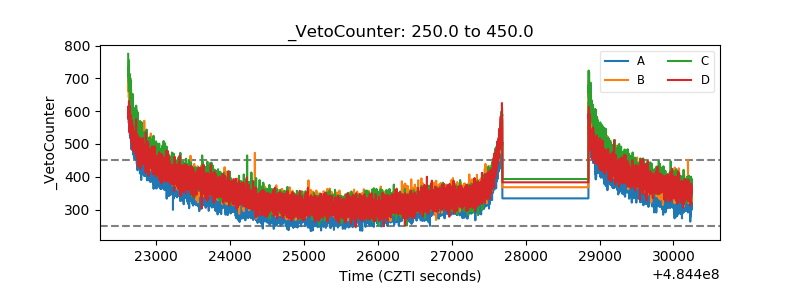 |