| Param | Original file | Final file |
|---|---|---|
| Filename | modeM0/AS1C09_011T06_9000006468_51989cztM0_level2.fits | modeM0/AS1C09_011T06_9000006468_51989cztM0_level2_quad_clean.evt |
| Size (bytes) | 683,510,400 | 90,014,400 |
| Size | 651.8 MB | 85.8 MB |
| Events in quadrant A | 6,015,538 | 556,289 |
| Events in quadrant B | 5,299,942 | 646,331 |
| Events in quadrant C | 6,235,898 | 559,042 |
| Events in quadrant D | 7,252,522 | 514,936 |
| Mode M0 | |||
|---|---|---|---|
| Quadrant | BADHDUFLAG | Total packets | Discarded packets |
| A | 0 | 22273 | 2 |
| B | 0 | 20202 | 2 |
| C | 0 | 23036 | 4 |
| D | 0 | 26066 | 2 |
| Mode M9 | |||
|---|---|---|---|
| Quadrant | BADHDUFLAG | Total packets | Discarded packets |
| A | 0 | 12 | 0 |
| B | 0 | 13 | 0 |
| C | 0 | 13 | 0 |
| D | 0 | 13 | 0 |
| Mode SS | |||
|---|---|---|---|
| Quadrant | BADHDUFLAG | Total packets | Discarded packets |
| A | 0 | 130 | 0 |
| B | 0 | 130 | 0 |
| C | 0 | 130 | 0 |
| D | 0 | 130 | 0 |
| Quadrant | Total seconds | Saturated seconds | Saturation percentage |
|---|---|---|---|
| A | 6433 | 908 | 14.114721% |
| B | 6433 | 544 | 8.456397% |
| C | 6432 | 896 | 13.930348% |
| D | 6432 | 841 | 13.075249% |
Noise dominated data is calculated using 1-second bins in cleaned event files. If a bin has >2000 counts, and if more than 50% of those come from <1% of pixels, then it is considered to be noise-dominated and hence unusable.
| Quadrant | # 1 sec bins | Bins with >0 counts | Bins with >2000 counts | High rate bins dominated by noise | Noise dominated (total time) | Noise dominated (detector-on time) | Marked lightcurve |
|---|---|---|---|---|---|---|---|
| A | 7642 | 6434 | 719 | 719 | 9.41% | 11.18% | 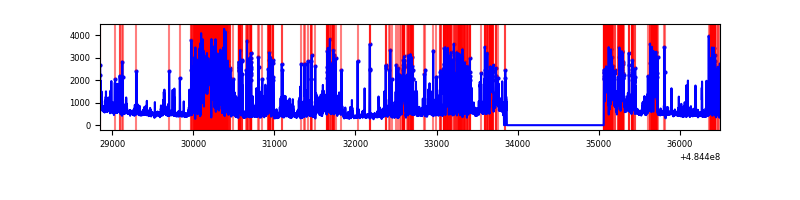 |
| B | 7643 | 6435 | 289 | 289 | 3.78% | 4.49% | 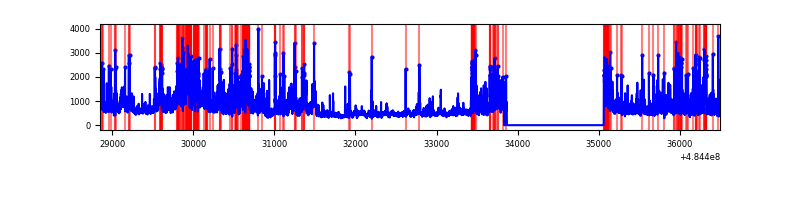 |
| C | 7642 | 6434 | 702 | 702 | 9.19% | 10.91% | 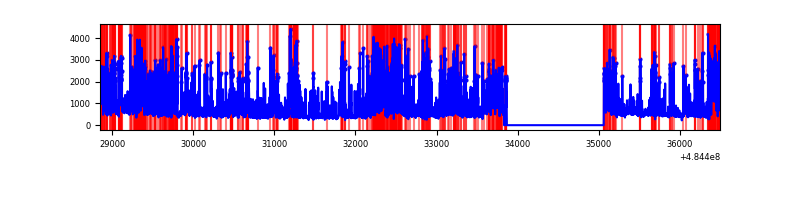 |
| D | 7642 | 6433 | 729 | 729 | 9.54% | 11.33% | 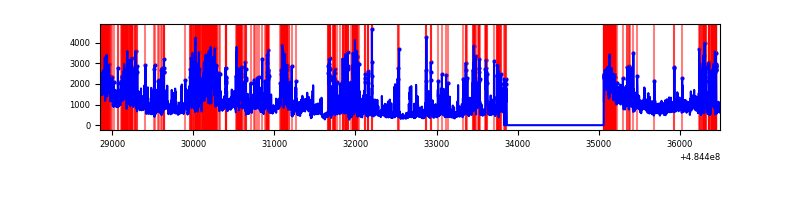 |
Top three noisy pixels from each quadrant. If the there are fewer than three noisy pixels in the level2.evt file, extra rows are filled as -1
| Pixel properties | Quadrant properties | ||||||
|---|---|---|---|---|---|---|---|
| Quadrant | DetID | PixID | Counts | Sigma | Mean | Median | Sigma |
| A | 7 | 64 | 2260582 | 13899.15 | 641 | 624 | 162.6 |
| A | 2 | 48 | 242473 | 1487.42 | 641 | 624 | 162.6 |
| A | 4 | 95 | 193518 | 1186.33 | 641 | 624 | 162.6 |
| B | 4 | 206 | 748879 | 5342.93 | 668 | 648 | 140.0 |
| B | 10 | 128 | 460947 | 3286.88 | 668 | 648 | 140.0 |
| B | 5 | 172 | 184262 | 1311.14 | 668 | 648 | 140.0 |
| C | 15 | 224 | 2828223 | 15688.1 | 642 | 634 | 180.2 |
| C | 13 | 3 | 417533 | 2313.05 | 642 | 634 | 180.2 |
| C | 12 | 252 | 122269 | 674.86 | 642 | 634 | 180.2 |
| D | 8 | 176 | 1161825 | 6399.42 | 633 | 603 | 181.5 |
| D | 12 | 17 | 1135066 | 6251.95 | 633 | 603 | 181.5 |
| D | 2 | 172 | 782577 | 4309.41 | 633 | 603 | 181.5 |
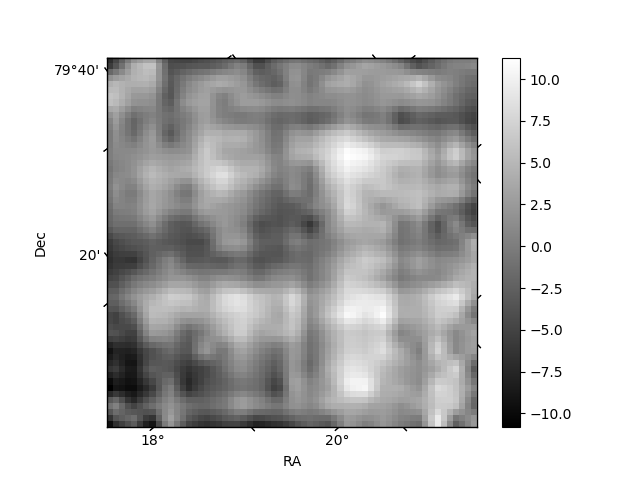
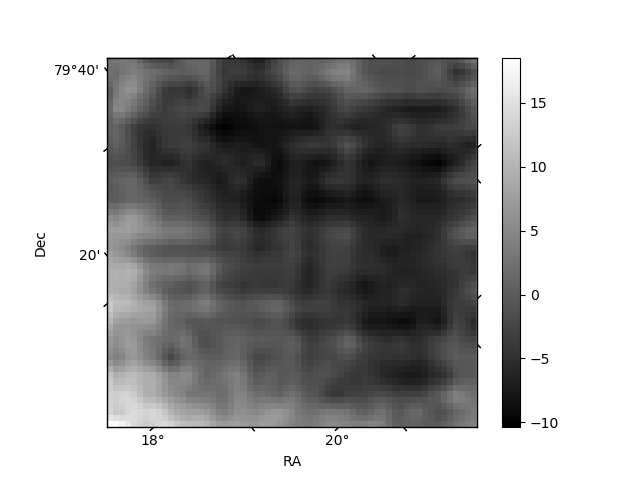
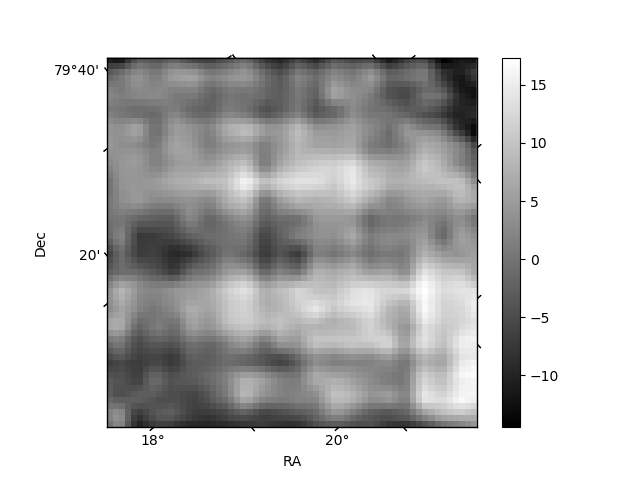
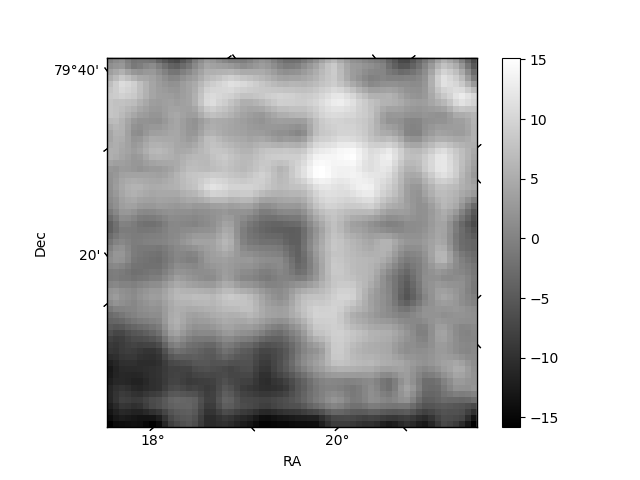
Histogram calculated using DETX and DETY for each event in the final _common_clean file
| Quadrant A | 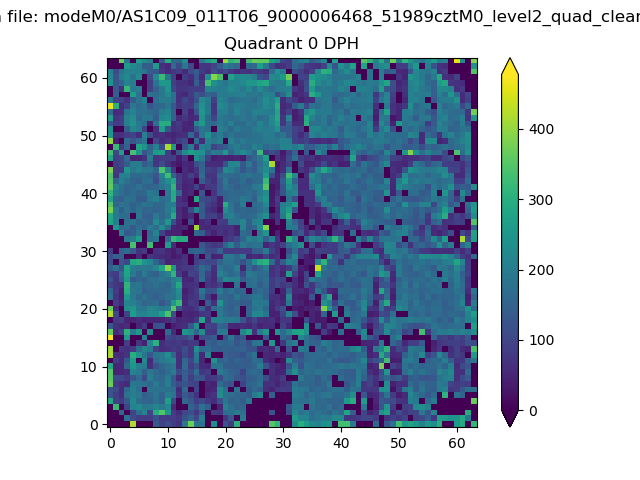 |
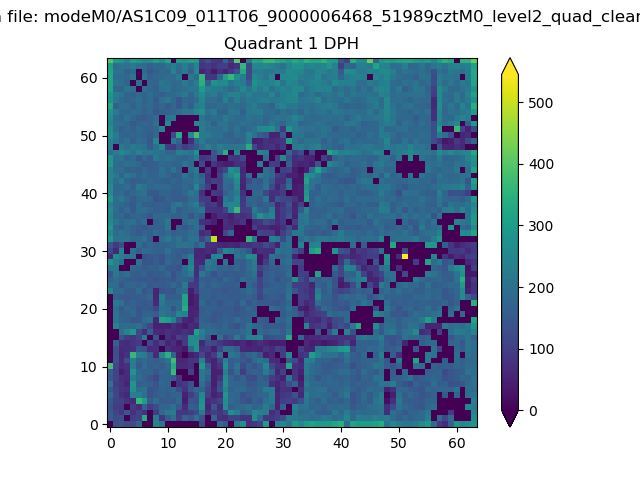 |
Quadrant B |
|---|---|---|---|
| Quadrant D | 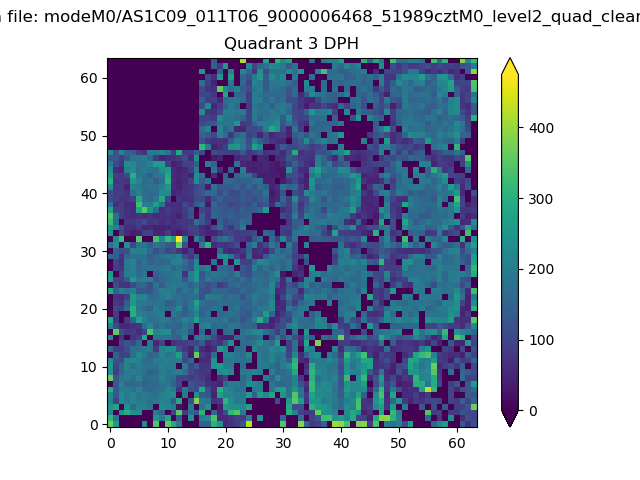 |
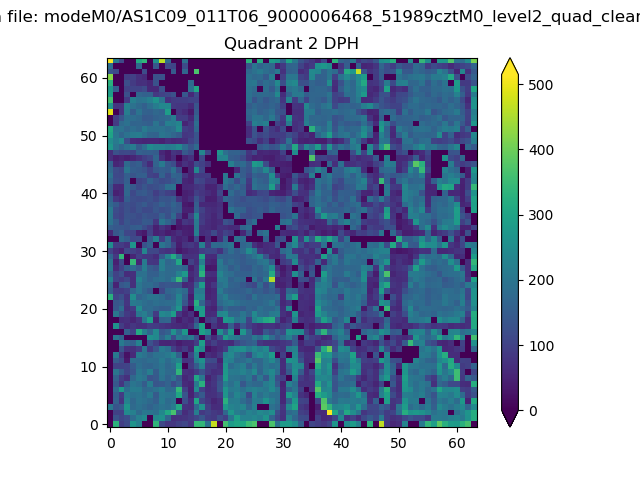 |
Quadrant C |
| Plot type | Count rate plots | Images |
|---|---|---|
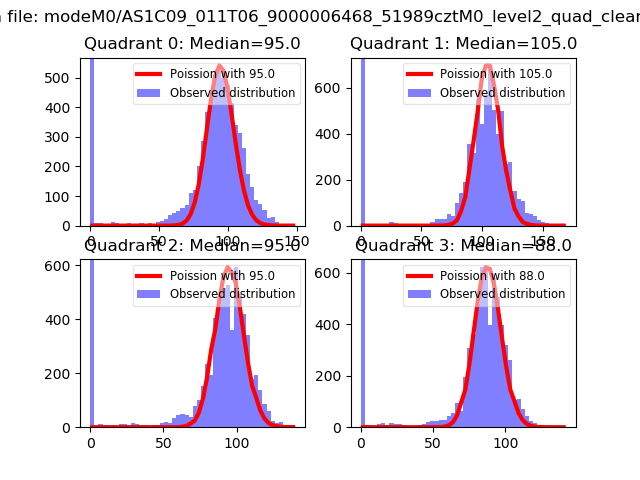
| Comparison with Poisson distribution Blue bars denote a histogram of data divided into 1 sec bins. Red curve is a Poisson curve with rate = median count rate of data. |
 |
 |
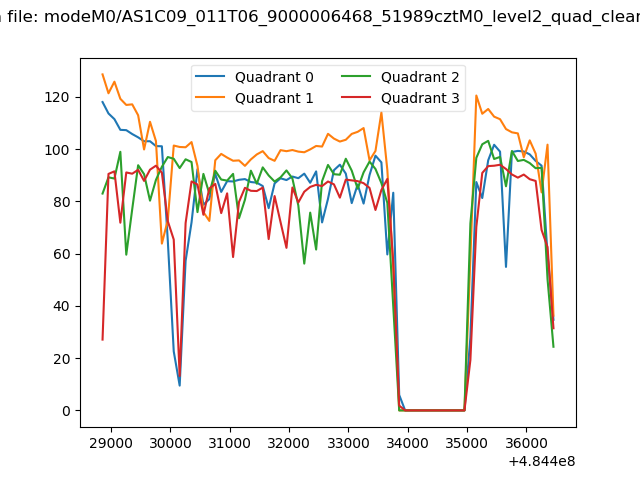
| Quadrant-wise count rates Data is divided into 100 sec bins |
 |
|
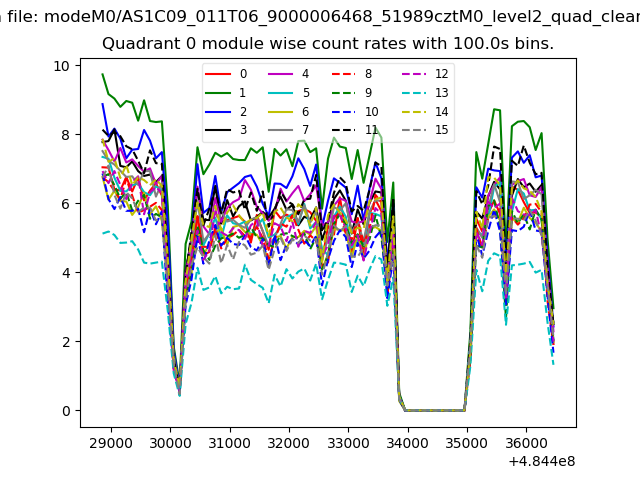
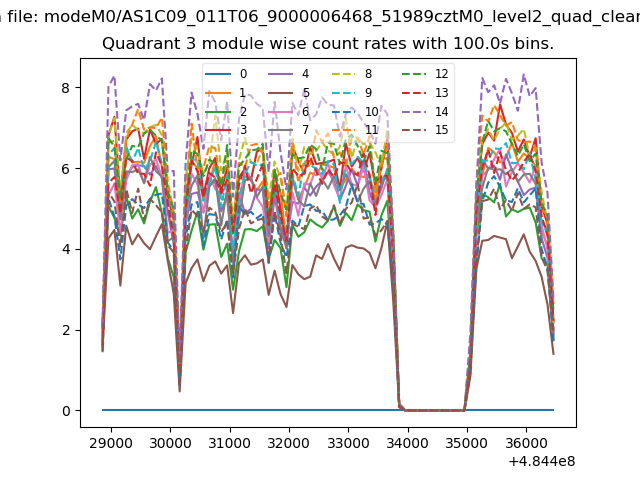
| Module-wise count rates for Quadrant A Data is divided into 100 sec bins |
 |
 |
| Module-wise count rates for Quadrant B Data is divided into 100 sec bins |
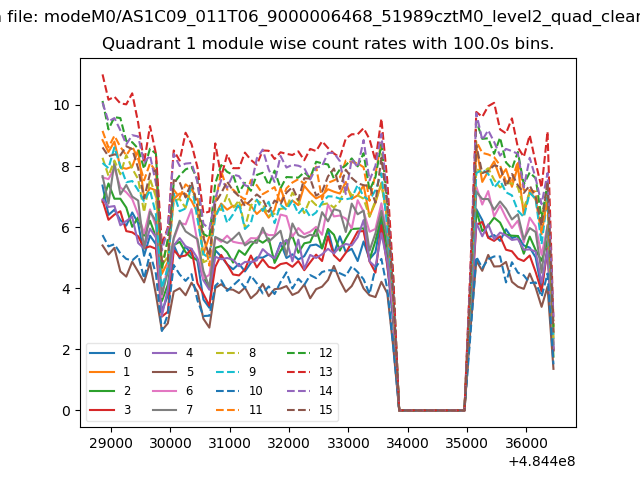 |
 |
| Module-wise count rates for Quadrant C Data is divided into 100 sec bins |
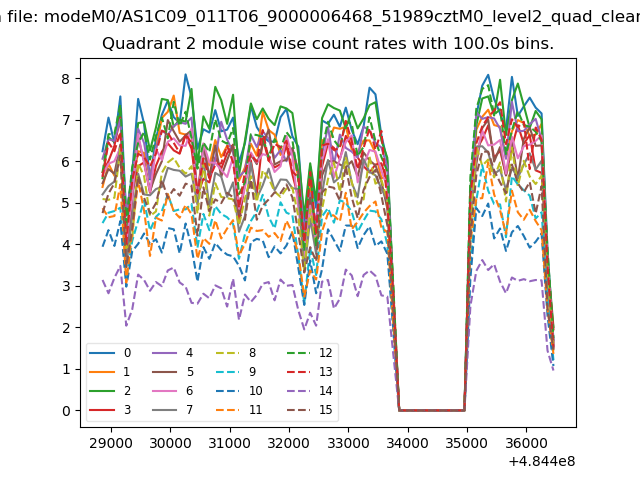 |
 |
| Module-wise count rates for Quadrant D Data is divided into 100 sec bins |
 |
 |
| Parameter | Plot |
|---|---|
| CZT HV Monitor | 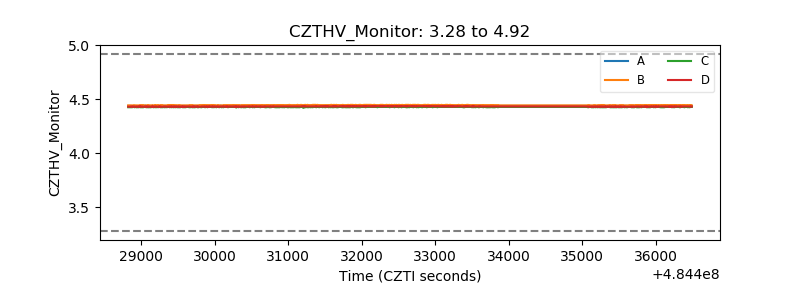 |
| D_VDD | 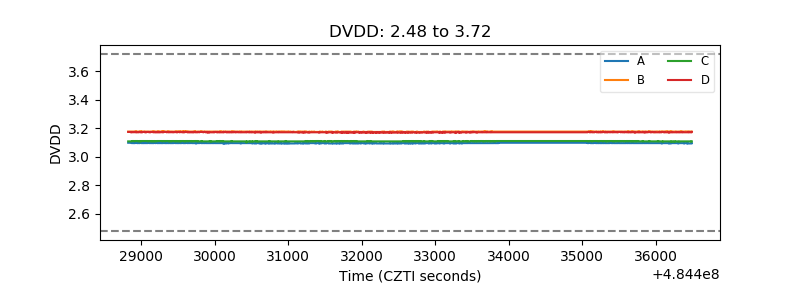 |
| Temperature 1 | 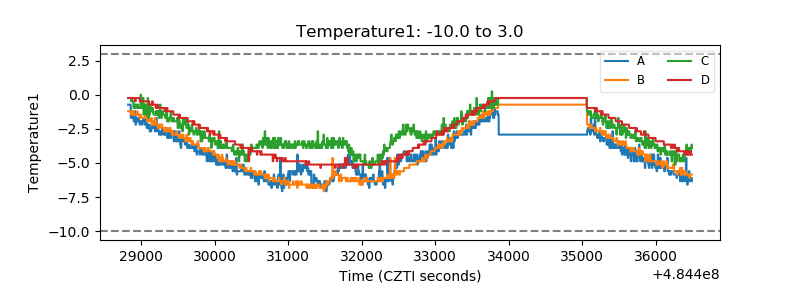 |
| Veto HV Monitor | 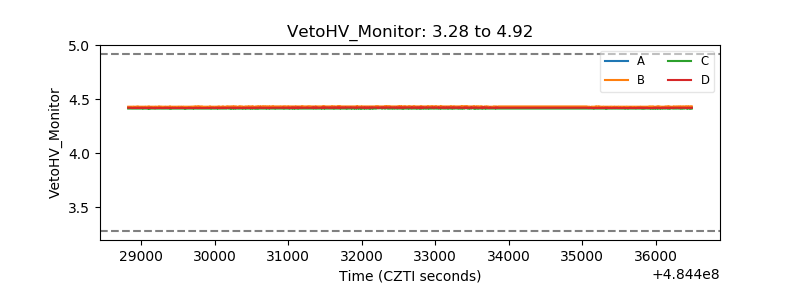 |
| Veto LLD | 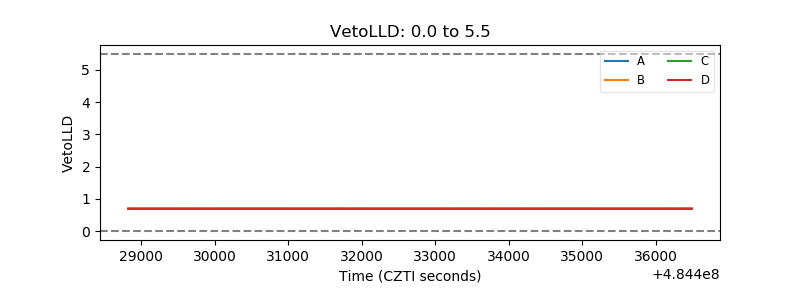 |
| Alpha Counter | 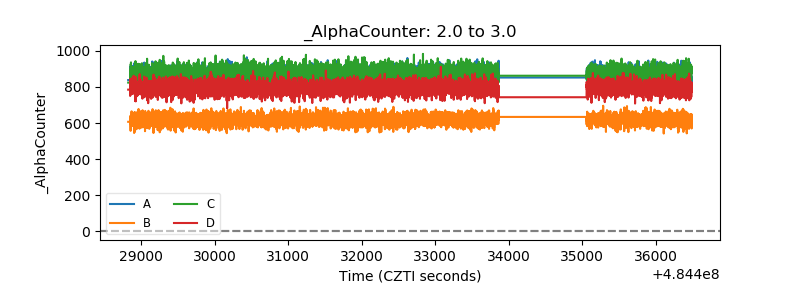 |
| _CPM_Rate | 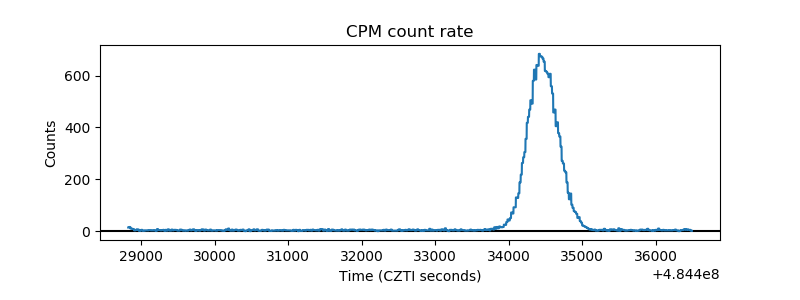 |
| CZT Counter | 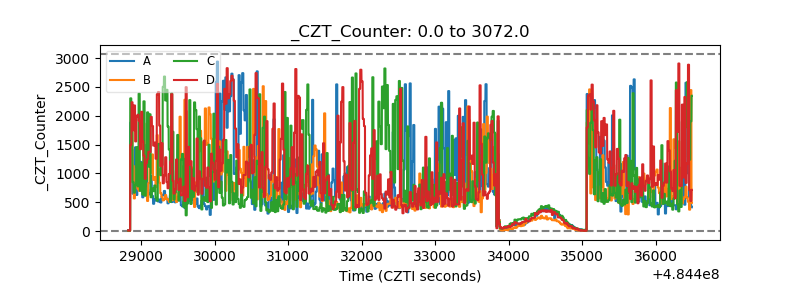 |
| +2.5 Volts monitor | 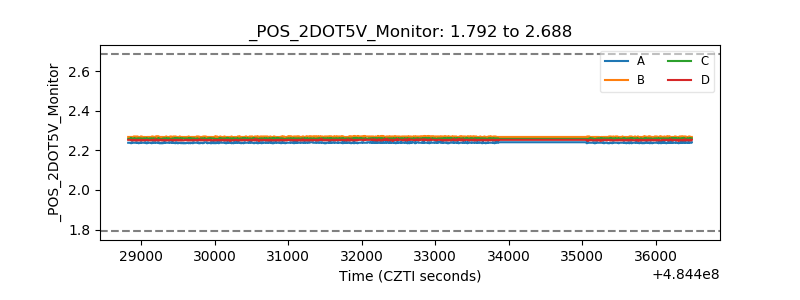 |
| +5 Volts monitor |  |
| _ROLL_ROT | 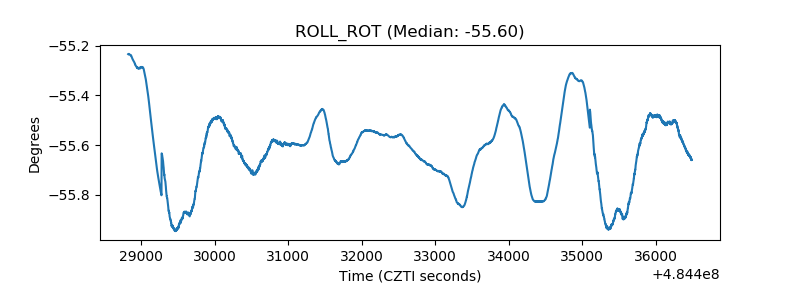 |
| _Roll_DEC | 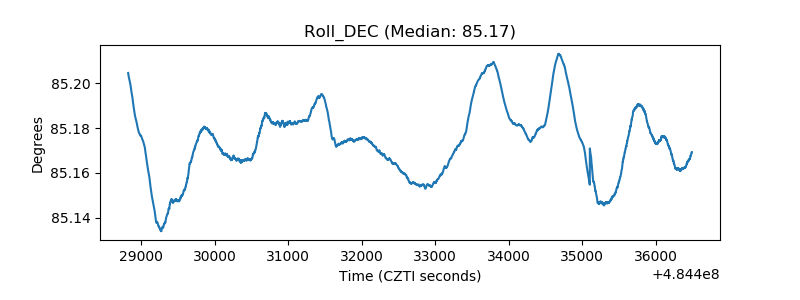 |
| _Roll_RA | 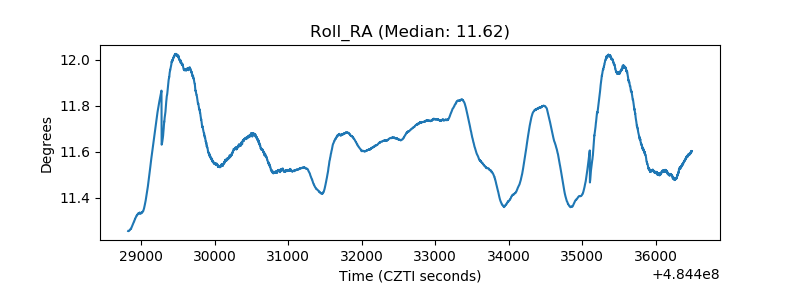 |
| Veto Counter | 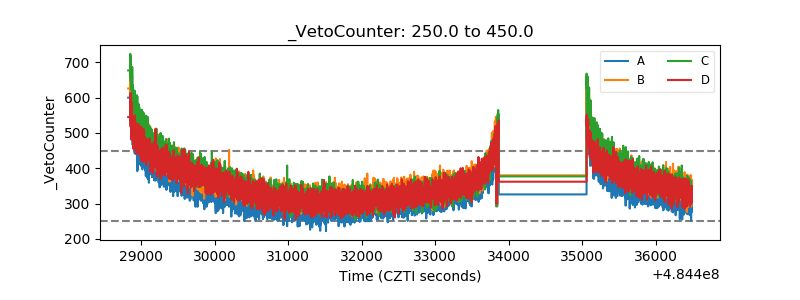 |