| Param | Original file | Final file |
|---|---|---|
| Filename | modeM0/AS1C09_011T06_9000006468_51990cztM0_level2.fits | modeM0/AS1C09_011T06_9000006468_51990cztM0_level2_quad_clean.evt |
| Size (bytes) | 698,028,480 | 89,331,840 |
| Size | 665.7 MB | 85.2 MB |
| Events in quadrant A | 7,486,712 | 508,362 |
| Events in quadrant B | 5,426,342 | 639,077 |
| Events in quadrant C | 5,714,473 | 580,679 |
| Events in quadrant D | 6,706,869 | 521,455 |
| Mode M0 | |||
|---|---|---|---|
| Quadrant | BADHDUFLAG | Total packets | Discarded packets |
| A | 0 | 26748 | 3 |
| B | 0 | 20740 | 2 |
| C | 0 | 21628 | 2 |
| D | 0 | 24517 | 2 |
| Mode M9 | |||
|---|---|---|---|
| Quadrant | BADHDUFLAG | Total packets | Discarded packets |
| A | 0 | 18 | 0 |
| B | 0 | 19 | 0 |
| C | 0 | 19 | 0 |
| D | 0 | 19 | 0 |
| Mode SS | |||
|---|---|---|---|
| Quadrant | BADHDUFLAG | Total packets | Discarded packets |
| A | 0 | 132 | 0 |
| B | 0 | 132 | 0 |
| C | 0 | 132 | 0 |
| D | 0 | 132 | 0 |
| Quadrant | Total seconds | Saturated seconds | Saturation percentage |
|---|---|---|---|
| A | 6523 | 1457 | 22.336348% |
| B | 6523 | 547 | 8.385712% |
| C | 6523 | 610 | 9.351525% |
| D | 6523 | 693 | 10.623946% |
Noise dominated data is calculated using 1-second bins in cleaned event files. If a bin has >2000 counts, and if more than 50% of those come from <1% of pixels, then it is considered to be noise-dominated and hence unusable.
| Quadrant | # 1 sec bins | Bins with >0 counts | Bins with >2000 counts | High rate bins dominated by noise | Noise dominated (total time) | Noise dominated (detector-on time) | Marked lightcurve |
|---|---|---|---|---|---|---|---|
| A | 7633 | 6524 | 1175 | 1175 | 15.39% | 18.01% | 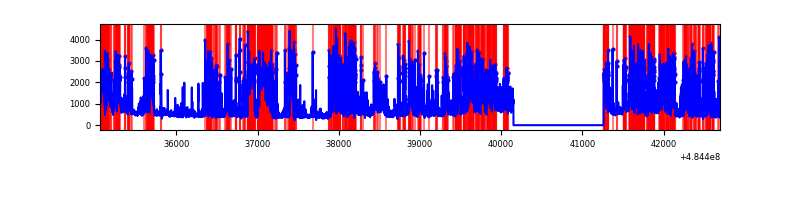 |
| B | 7633 | 6524 | 281 | 281 | 3.68% | 4.31% | 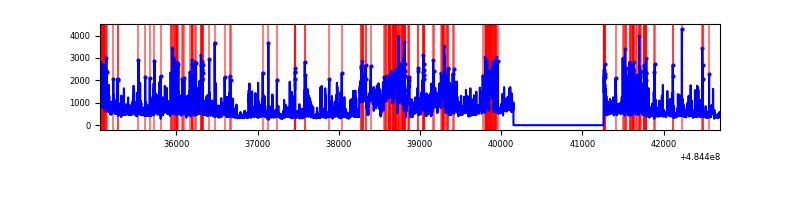 |
| C | 7633 | 6524 | 528 | 528 | 6.92% | 8.09% | 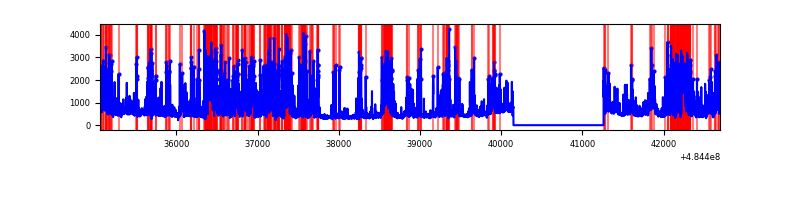 |
| D | 7633 | 6524 | 629 | 629 | 8.24% | 9.64% | 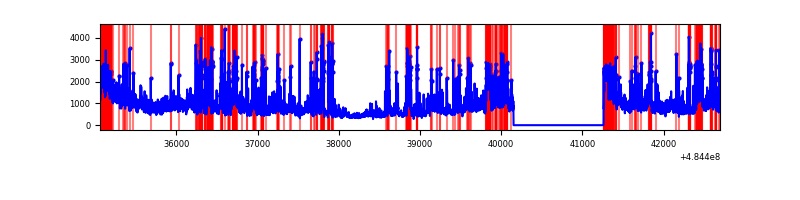 |
Top three noisy pixels from each quadrant. If the there are fewer than three noisy pixels in the level2.evt file, extra rows are filled as -1
| Pixel properties | Quadrant properties | ||||||
|---|---|---|---|---|---|---|---|
| Quadrant | DetID | PixID | Counts | Sigma | Mean | Median | Sigma |
| A | 7 | 64 | 3006428 | 19439.11 | 612 | 596 | 154.6 |
| A | 12 | 2 | 406095 | 2622.42 | 612 | 596 | 154.6 |
| A | 4 | 95 | 344671 | 2225.18 | 612 | 596 | 154.6 |
| B | 4 | 206 | 714932 | 5096.79 | 664 | 643 | 140.1 |
| B | 8 | 3 | 711833 | 5074.67 | 664 | 643 | 140.1 |
| B | 12 | 32 | 214282 | 1524.41 | 664 | 643 | 140.1 |
| C | 15 | 224 | 1916949 | 10478.09 | 656 | 648 | 182.9 |
| C | 13 | 3 | 704350 | 3847.75 | 656 | 648 | 182.9 |
| C | 12 | 252 | 126338 | 687.26 | 656 | 648 | 182.9 |
| D | 8 | 176 | 1222678 | 6773.05 | 629 | 601 | 180.4 |
| D | 12 | 17 | 955830 | 5294.11 | 629 | 601 | 180.4 |
| D | 6 | 42 | 633752 | 3509.08 | 629 | 601 | 180.4 |
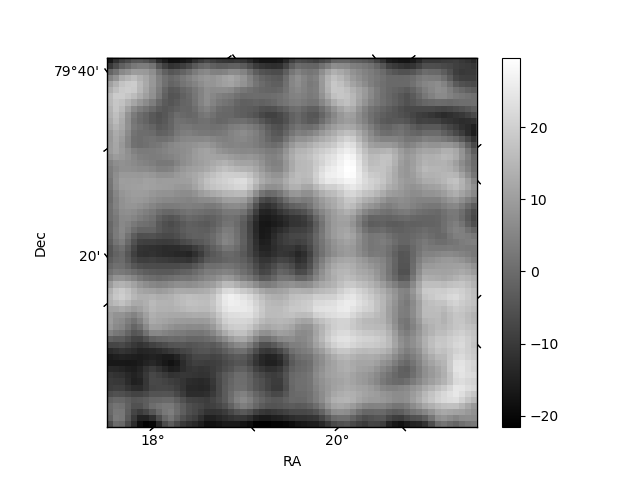
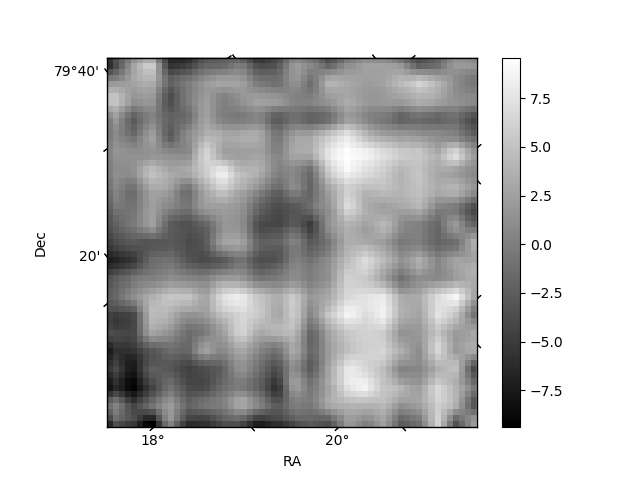
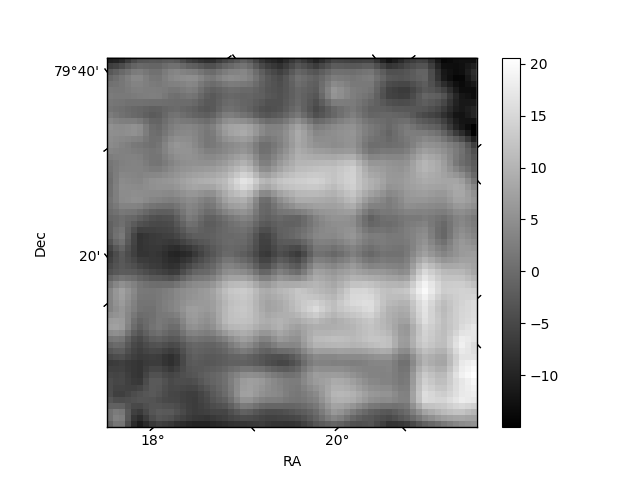
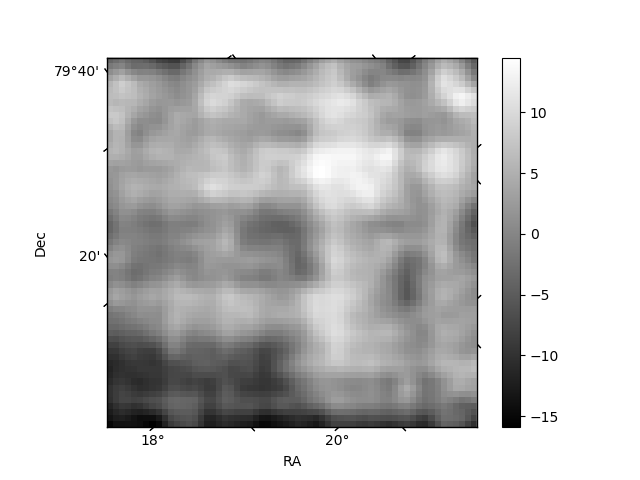
Histogram calculated using DETX and DETY for each event in the final _common_clean file
| Quadrant A | 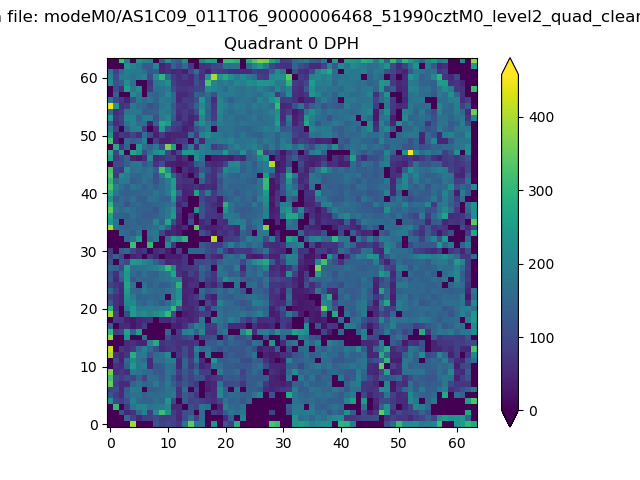 |
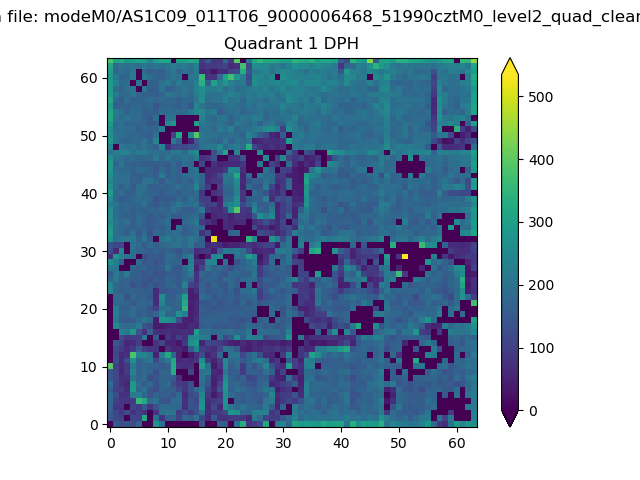 |
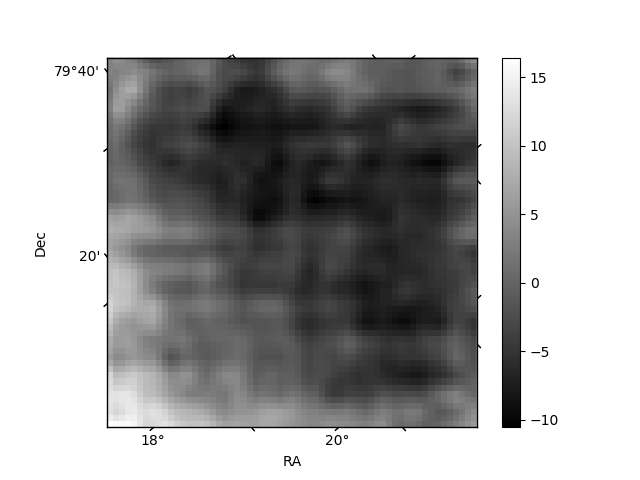
Quadrant B |
|---|---|---|---|
| Quadrant D | 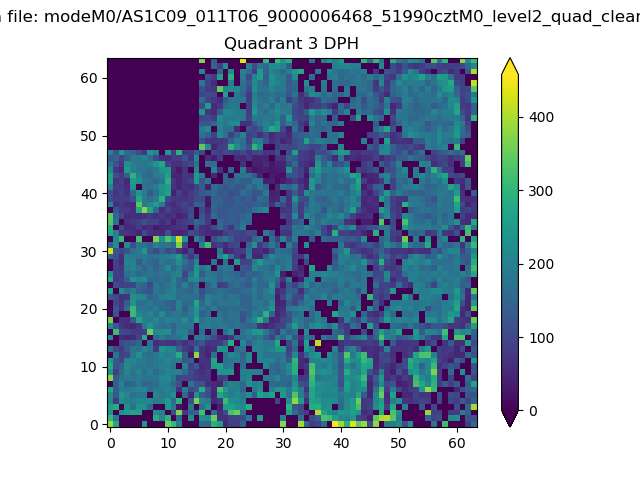 |
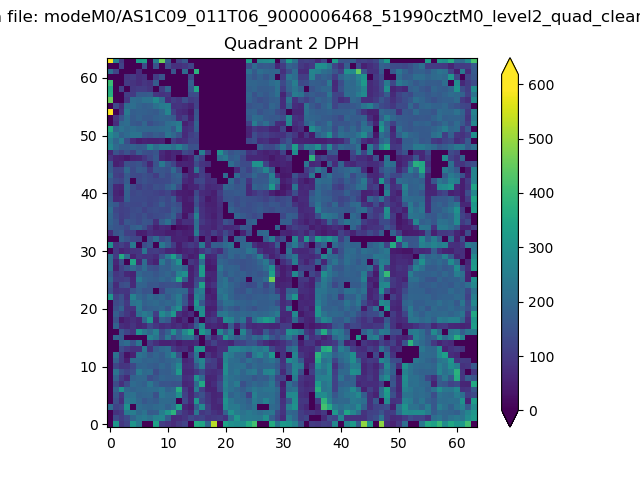 |
Quadrant C |
| Plot type | Count rate plots | Images |
|---|---|---|
| Comparison with Poisson distribution Blue bars denote a histogram of data divided into 1 sec bins. Red curve is a Poisson curve with rate = median count rate of data. |
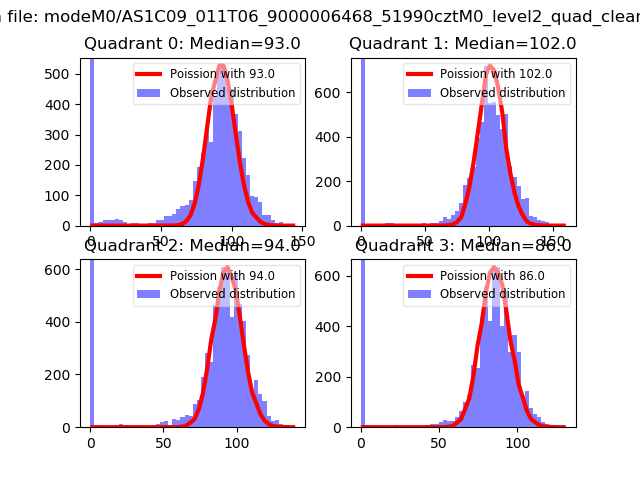 |
 |
| Quadrant-wise count rates Data is divided into 100 sec bins |
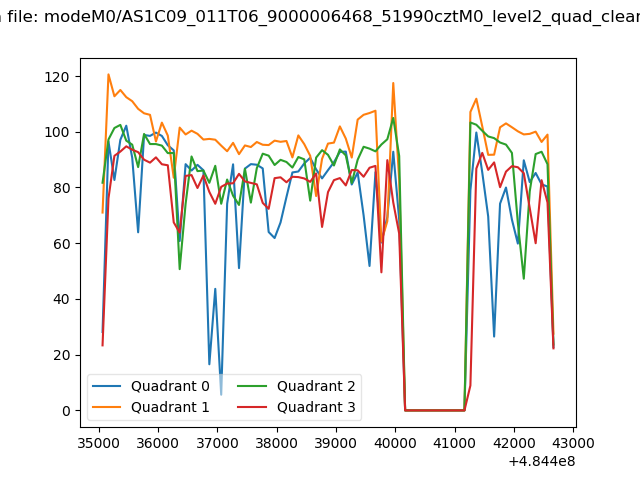 |
|
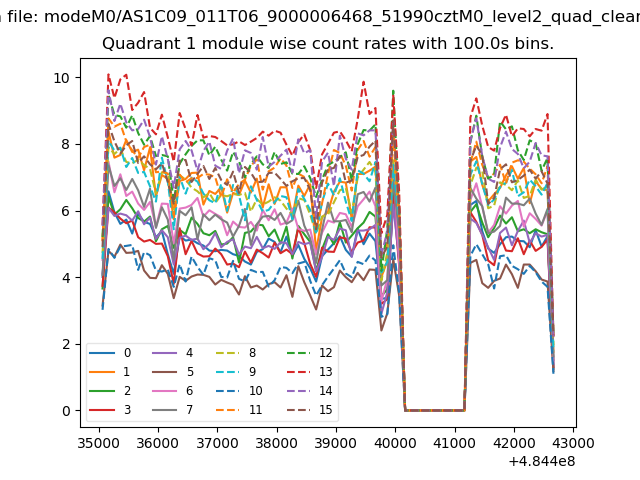
| Module-wise count rates for Quadrant A Data is divided into 100 sec bins |
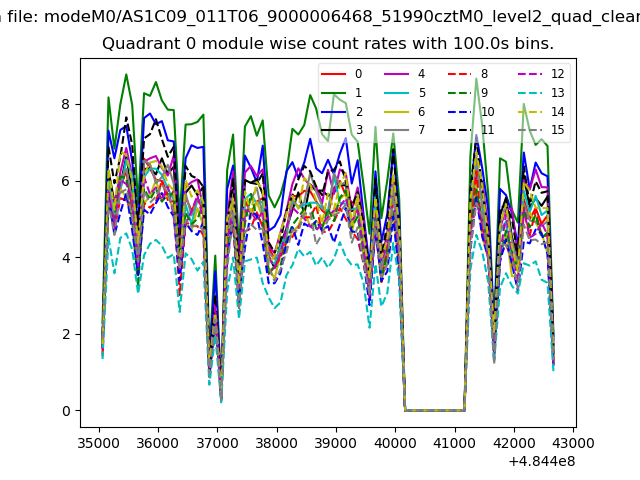 |
 |
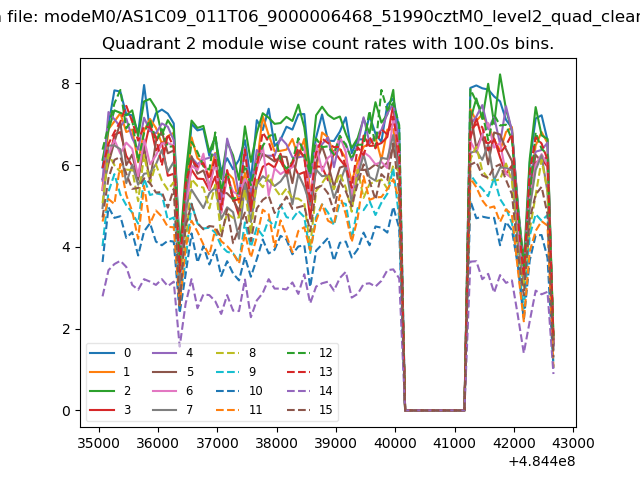
| Module-wise count rates for Quadrant B Data is divided into 100 sec bins |
 |
 |
| Module-wise count rates for Quadrant C Data is divided into 100 sec bins |
 |
 |
| Module-wise count rates for Quadrant D Data is divided into 100 sec bins |
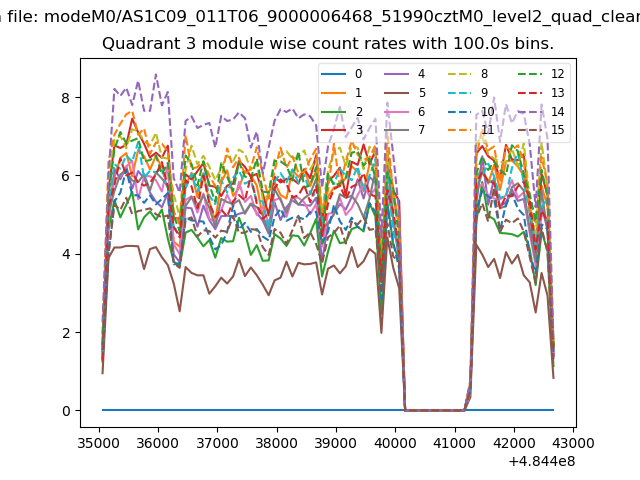 |
 |
| Parameter | Plot |
|---|---|
| CZT HV Monitor | 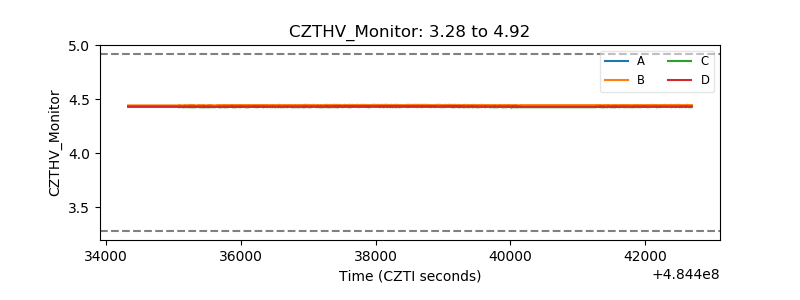 |
| D_VDD | 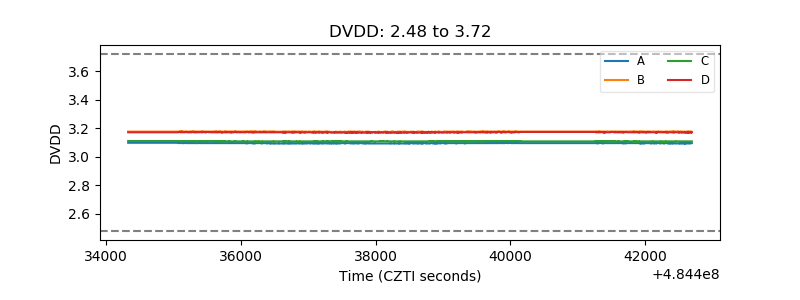 |
| Temperature 1 | 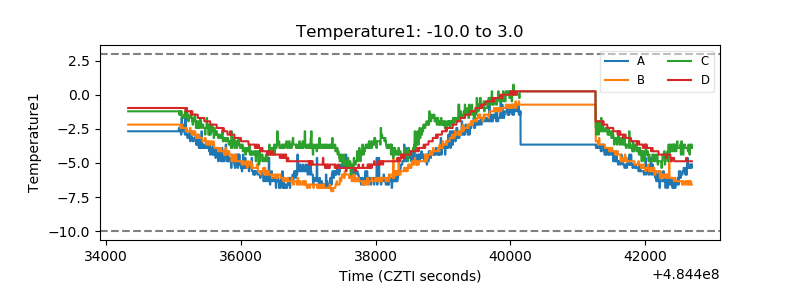 |
| Veto HV Monitor | 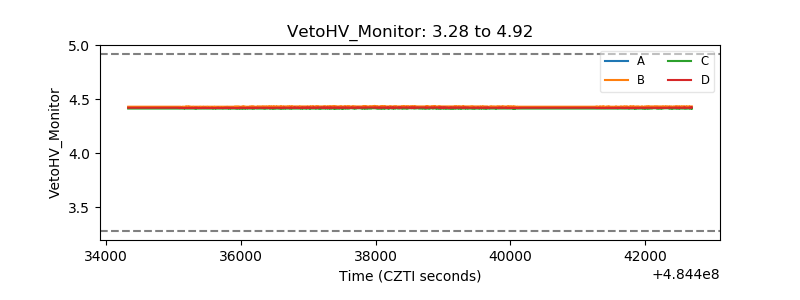 |
| Veto LLD | 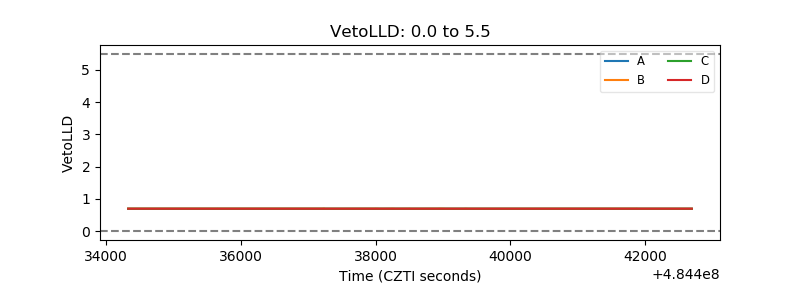 |
| Alpha Counter | 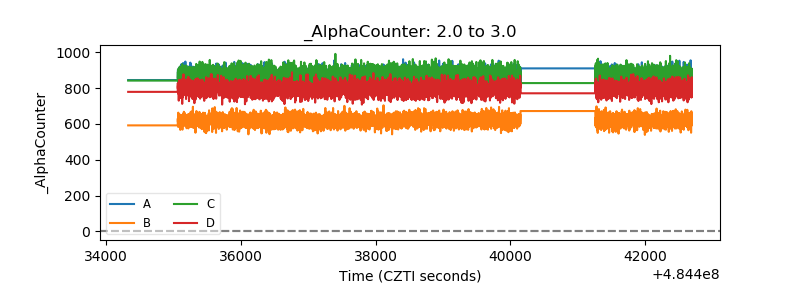 |
| _CPM_Rate | 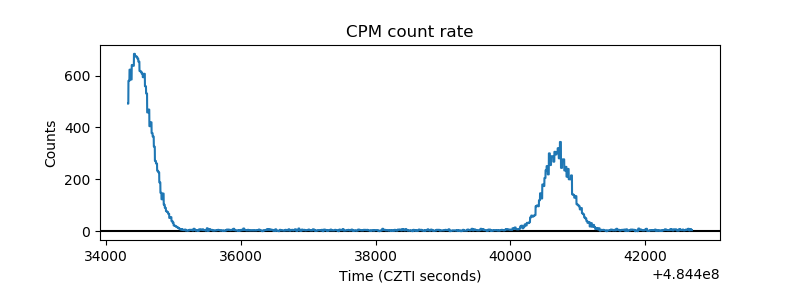 |
| CZT Counter | 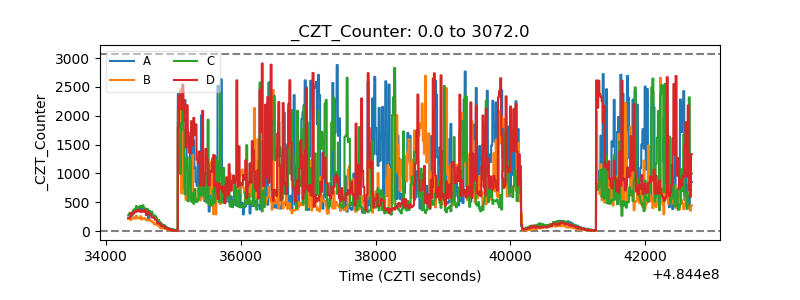 |
| +2.5 Volts monitor | 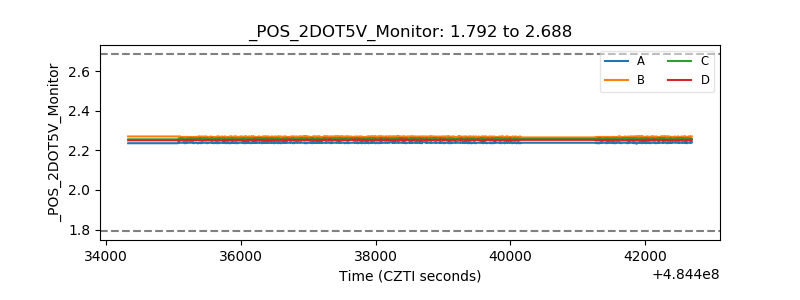 |
| +5 Volts monitor | 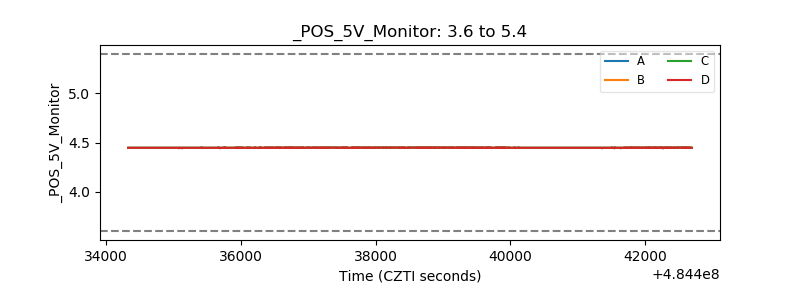 |
| _ROLL_ROT | 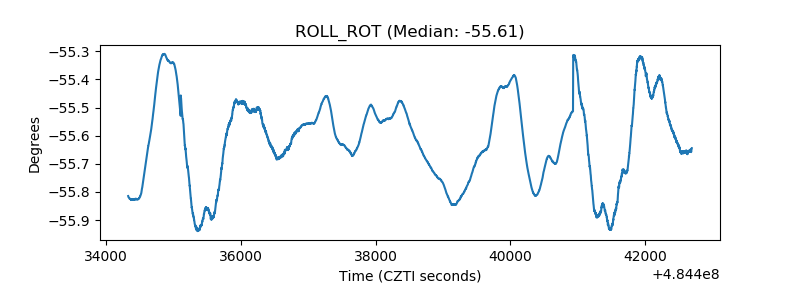 |
| _Roll_DEC | 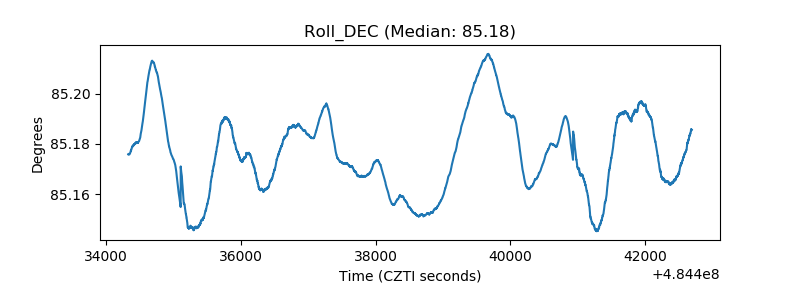 |
| _Roll_RA | 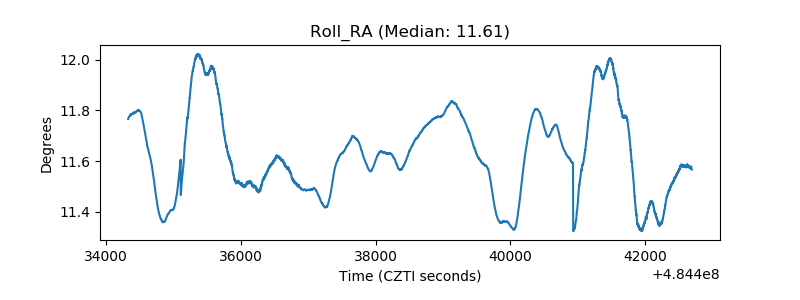 |
| Veto Counter | 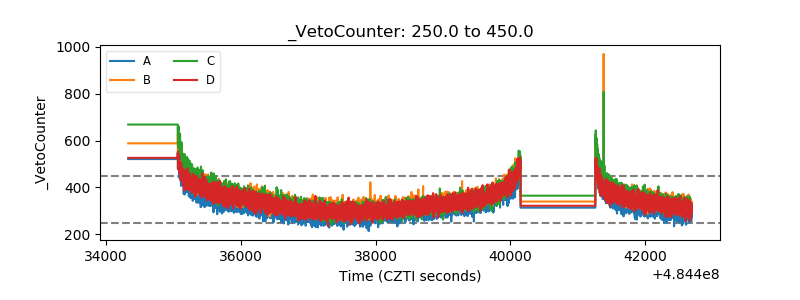 |