| Param | Original file | Final file |
|---|---|---|
| Filename | modeM0/AS1C09_011T06_9000006468_51991cztM0_level2.fits | modeM0/AS1C09_011T06_9000006468_51991cztM0_level2_quad_clean.evt |
| Size (bytes) | 528,096,960 | 70,220,160 |
| Size | 503.6 MB | 67.0 MB |
| Events in quadrant A | 5,643,900 | 417,578 |
| Events in quadrant B | 3,285,051 | 502,888 |
| Events in quadrant C | 4,988,458 | 436,108 |
| Events in quadrant D | 5,225,959 | 403,815 |
| Mode M0 | |||
|---|---|---|---|
| Quadrant | BADHDUFLAG | Total packets | Discarded packets |
| A | 0 | 20493 | 93 |
| B | 0 | 13673 | 43 |
| C | 0 | 18555 | 65 |
| D | 0 | 19309 | 64 |
| Mode M9 | |||
|---|---|---|---|
| Quadrant | BADHDUFLAG | Total packets | Discarded packets |
| A | 0 | 16 | 2 |
| B | 0 | 15 | 1 |
| C | 0 | 14 | 0 |
| D | 0 | 15 | 1 |
| Mode SS | |||
|---|---|---|---|
| Quadrant | BADHDUFLAG | Total packets | Discarded packets |
| A | 0 | 107 | 3 |
| B | 0 | 106 | 2 |
| C | 0 | 106 | 2 |
| D | 0 | 106 | 2 |
| Quadrant | Total seconds | Saturated seconds | Saturation percentage |
|---|---|---|---|
| A | 5222 | 852 | 16.315588% |
| B | 5225 | 281 | 5.377990% |
| C | 5223 | 695 | 13.306529% |
| D | 5223 | 570 | 10.913268% |
Noise dominated data is calculated using 1-second bins in cleaned event files. If a bin has >2000 counts, and if more than 50% of those come from <1% of pixels, then it is considered to be noise-dominated and hence unusable.
| Quadrant | # 1 sec bins | Bins with >0 counts | Bins with >2000 counts | High rate bins dominated by noise | Noise dominated (total time) | Noise dominated (detector-on time) | Marked lightcurve |
|---|---|---|---|---|---|---|---|
| A | 7993 | 5227 | 724 | 724 | 9.06% | 13.85% | 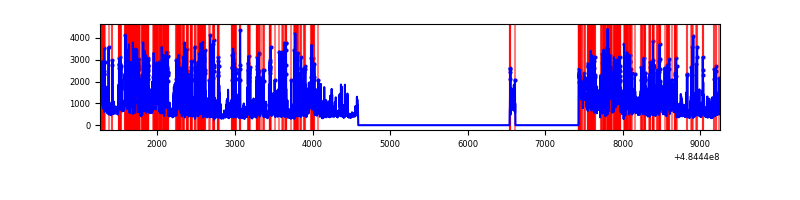 |
| B | 7993 | 5229 | 133 | 133 | 1.66% | 2.54% | 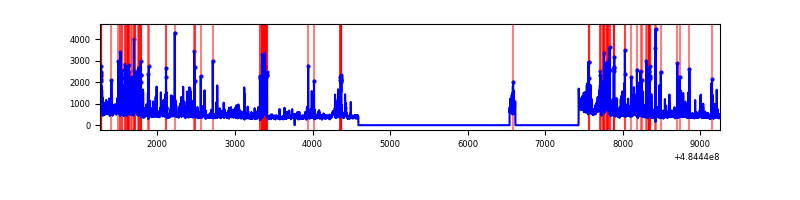 |
| C | 7993 | 5226 | 587 | 587 | 7.34% | 11.23% | 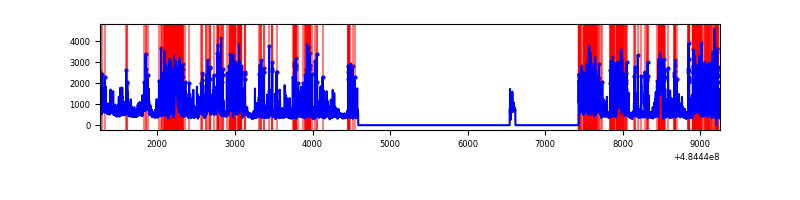 |
| D | 7993 | 5229 | 487 | 487 | 6.09% | 9.31% | 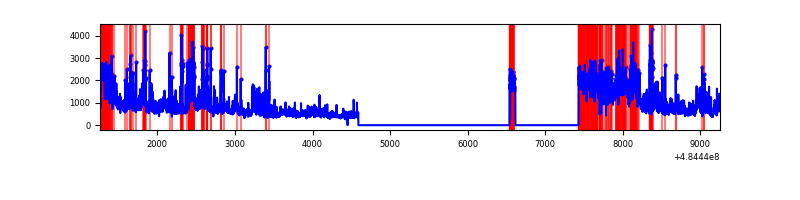 |
Top three noisy pixels from each quadrant. If the there are fewer than three noisy pixels in the level2.evt file, extra rows are filled as -1
| Pixel properties | Quadrant properties | ||||||
|---|---|---|---|---|---|---|---|
| Quadrant | DetID | PixID | Counts | Sigma | Mean | Median | Sigma |
| A | 7 | 64 | 1926240 | 15641.6 | 484 | 470 | 123.1 |
| A | 12 | 2 | 596994 | 4845.12 | 484 | 470 | 123.1 |
| A | 4 | 95 | 187354 | 1517.92 | 484 | 470 | 123.1 |
| B | 4 | 206 | 271437 | 2469.83 | 516 | 498 | 109.7 |
| B | 0 | 172 | 140312 | 1274.52 | 516 | 498 | 109.7 |
| B | 0 | 213 | 121697 | 1104.83 | 516 | 498 | 109.7 |
| C | 15 | 224 | 2066600 | 14981.42 | 493 | 488 | 137.9 |
| C | 13 | 3 | 448521 | 3248.7 | 493 | 488 | 137.9 |
| C | 9 | 38 | 144232 | 1042.29 | 493 | 488 | 137.9 |
| D | 8 | 176 | 1366930 | 9819.94 | 480 | 459 | 139.2 |
| D | 6 | 42 | 843666 | 6059.58 | 480 | 459 | 139.2 |
| D | 12 | 17 | 437985 | 3144.21 | 480 | 459 | 139.2 |
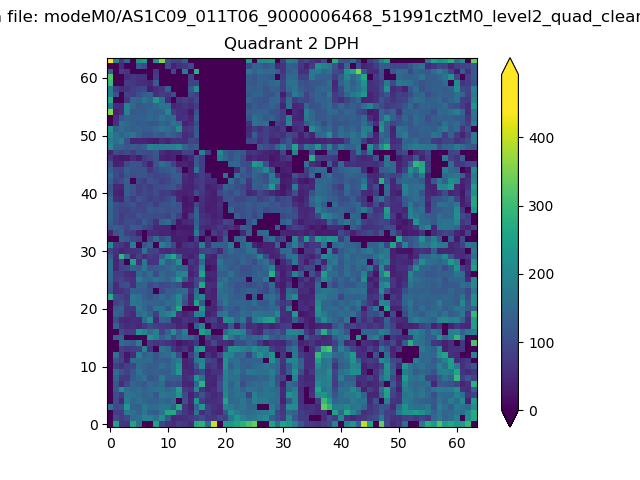
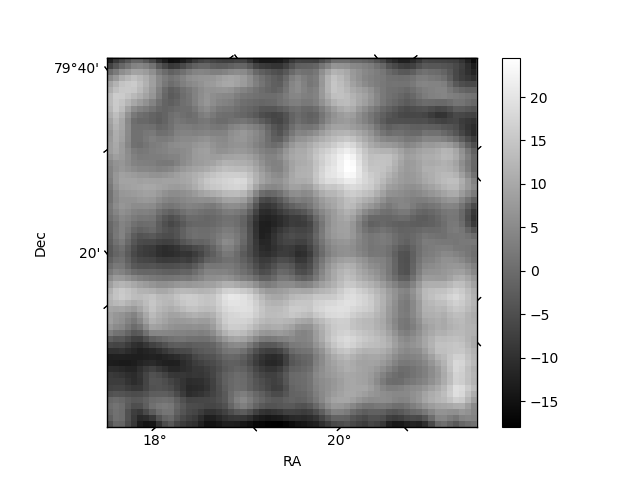
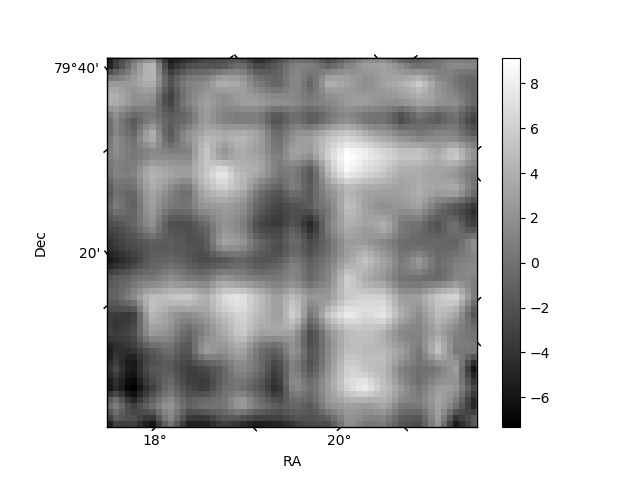
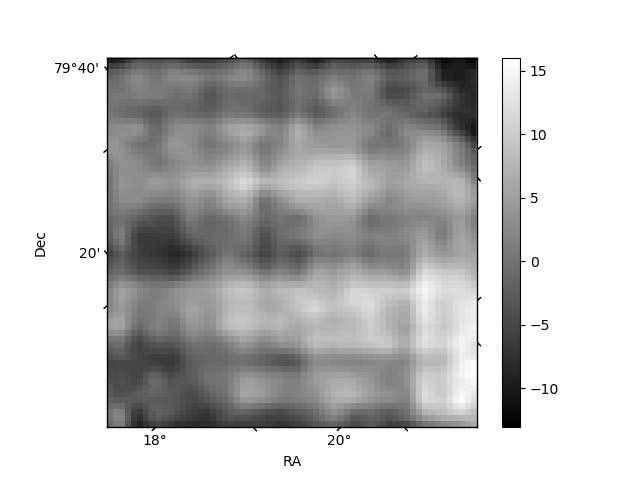
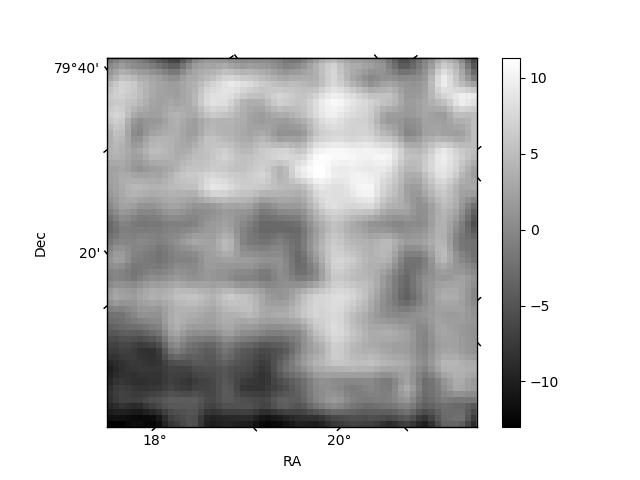
Histogram calculated using DETX and DETY for each event in the final _common_clean file
| Quadrant A | 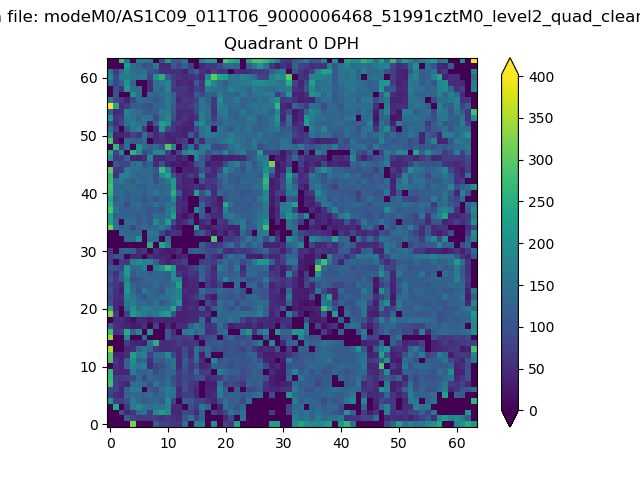 |
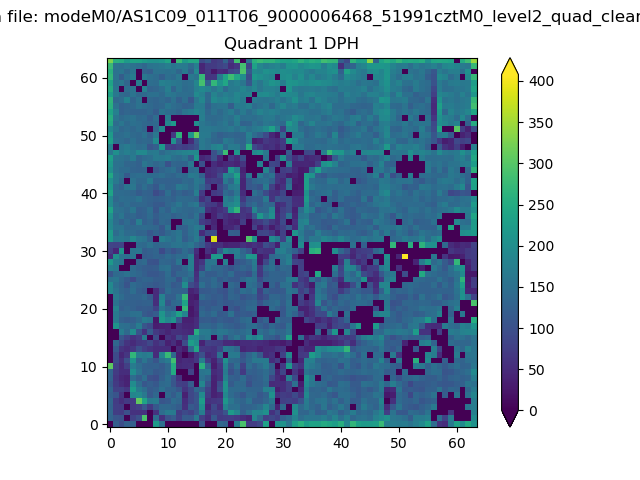 |
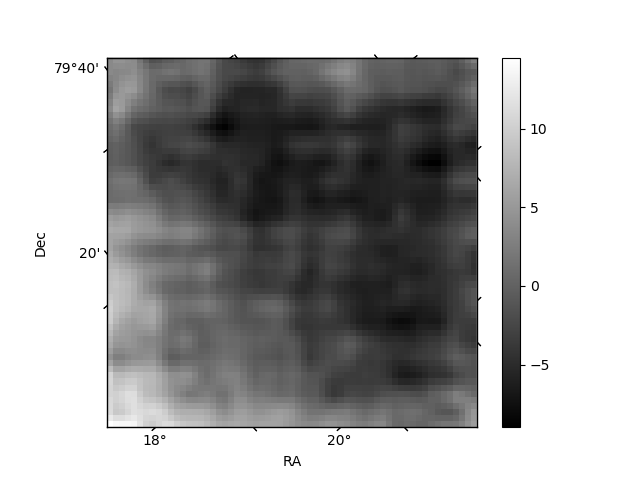
Quadrant B |
|---|---|---|---|
| Quadrant D | 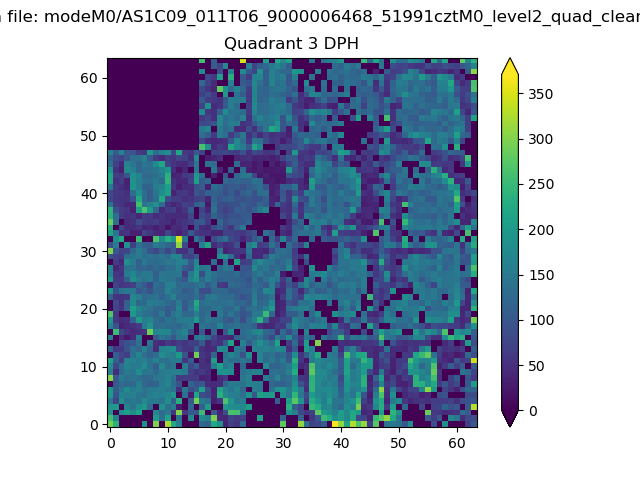 |
 |
Quadrant C |
| Plot type | Count rate plots | Images |
|---|---|---|
| Comparison with Poisson distribution Blue bars denote a histogram of data divided into 1 sec bins. Red curve is a Poisson curve with rate = median count rate of data. |
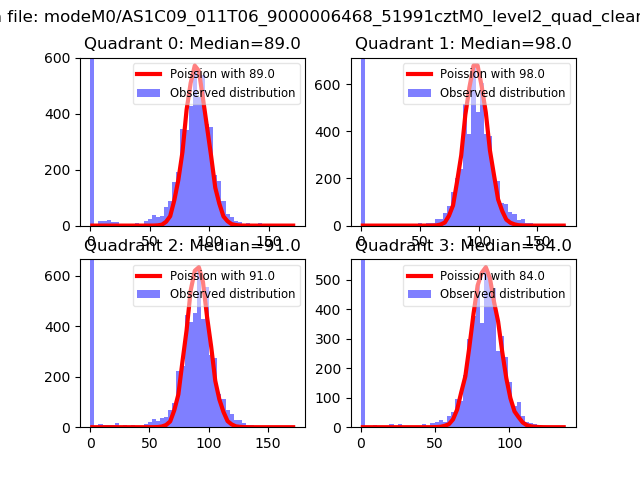 |
 |
| Quadrant-wise count rates Data is divided into 100 sec bins |
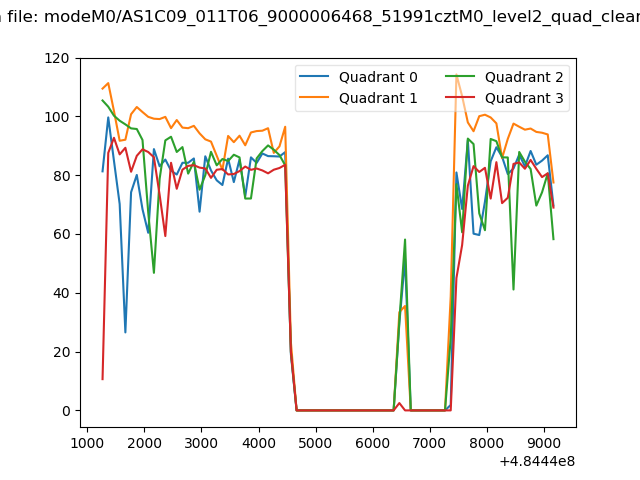 |
|
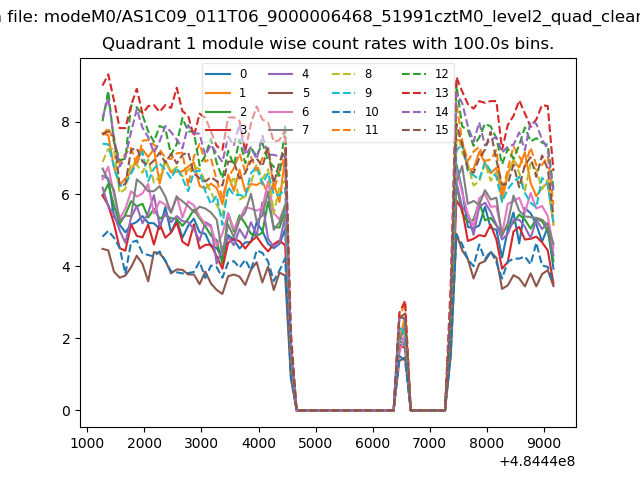
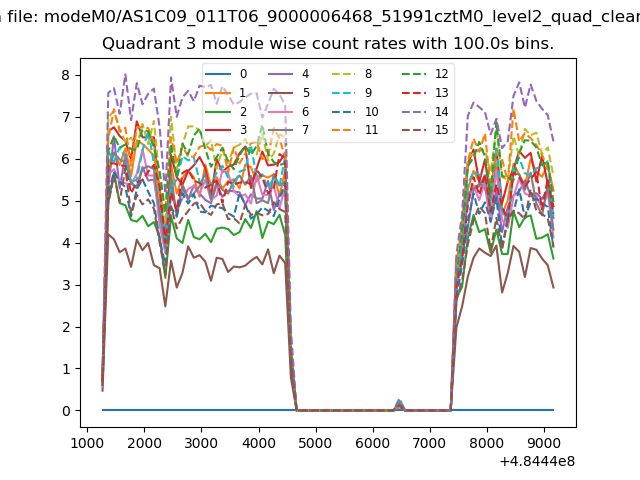
| Module-wise count rates for Quadrant A Data is divided into 100 sec bins |
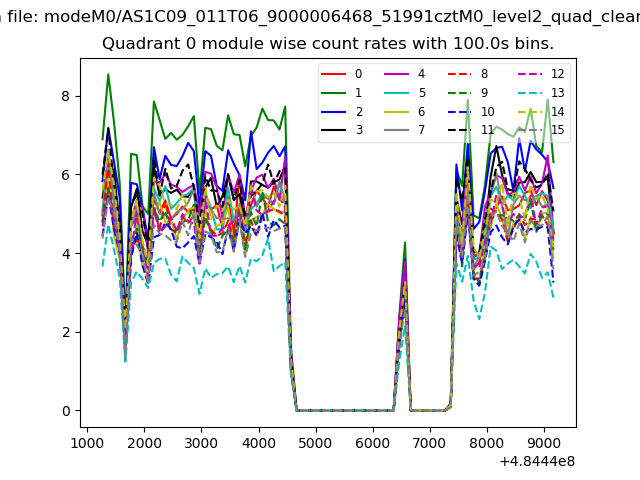 |
 |
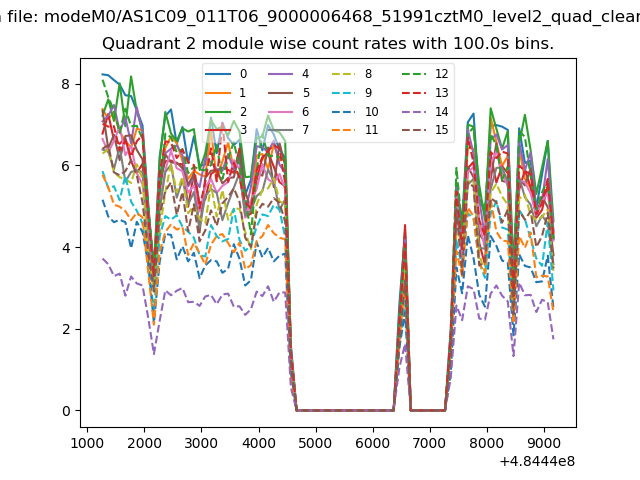
| Module-wise count rates for Quadrant B Data is divided into 100 sec bins |
 |
 |
| Module-wise count rates for Quadrant C Data is divided into 100 sec bins |
 |
 |
| Module-wise count rates for Quadrant D Data is divided into 100 sec bins |
 |
 |
| Parameter | Plot |
|---|---|
| CZT HV Monitor | 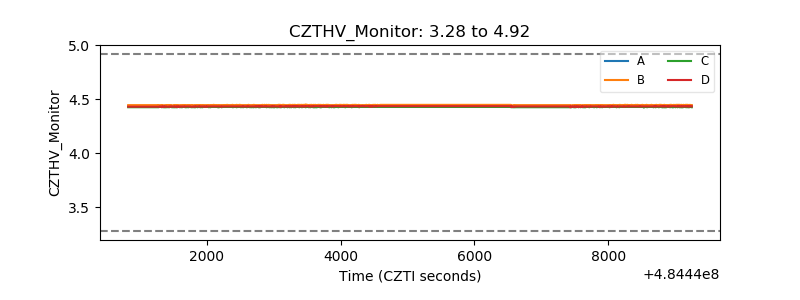 |
| D_VDD | 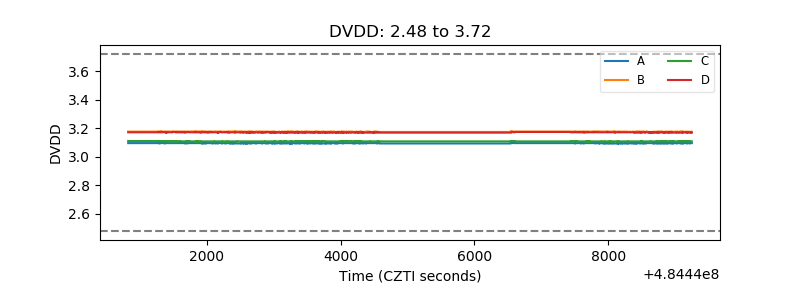 |
| Temperature 1 | 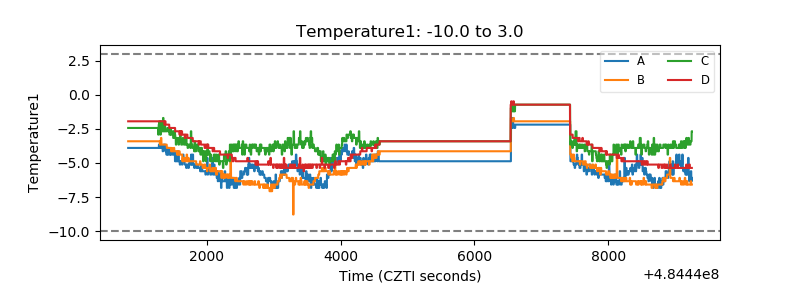 |
| Veto HV Monitor | 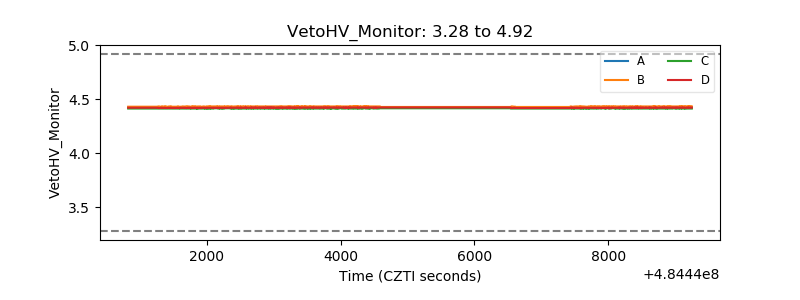 |
| Veto LLD | 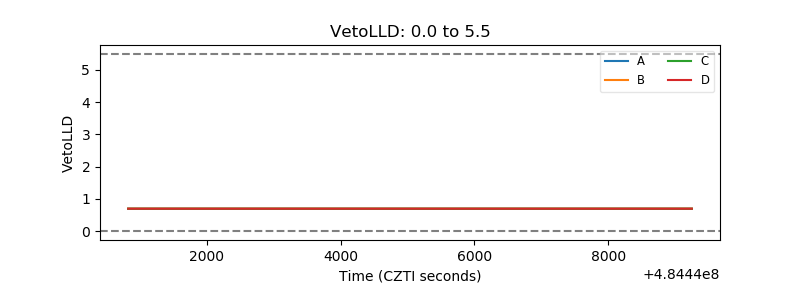 |
| Alpha Counter | 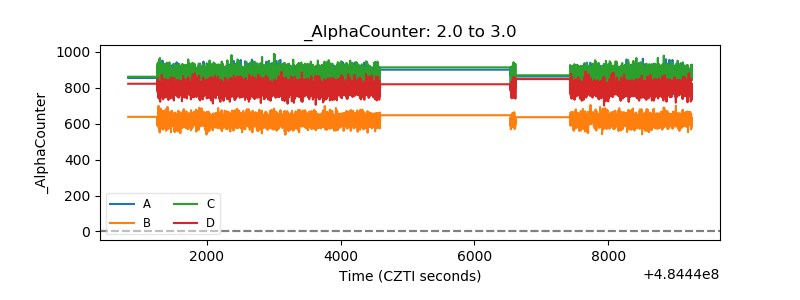 |
| _CPM_Rate | 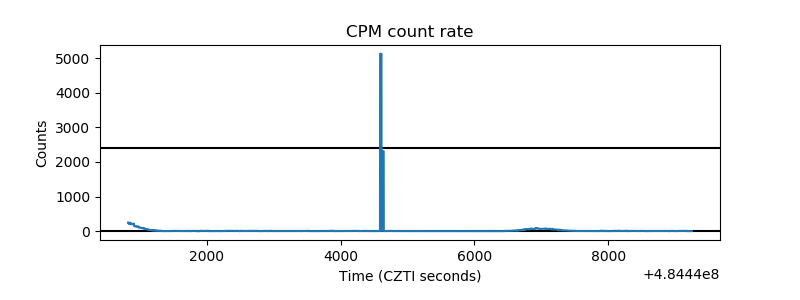 |
| CZT Counter | 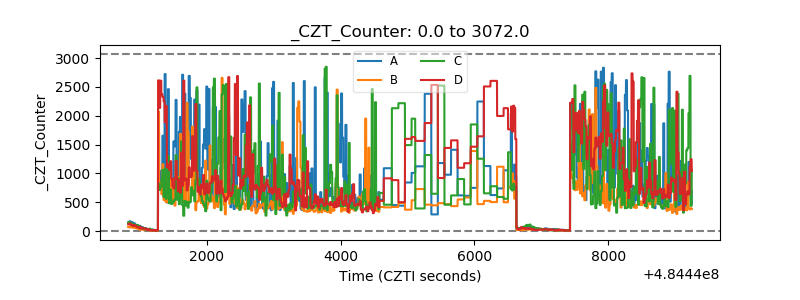 |
| +2.5 Volts monitor | 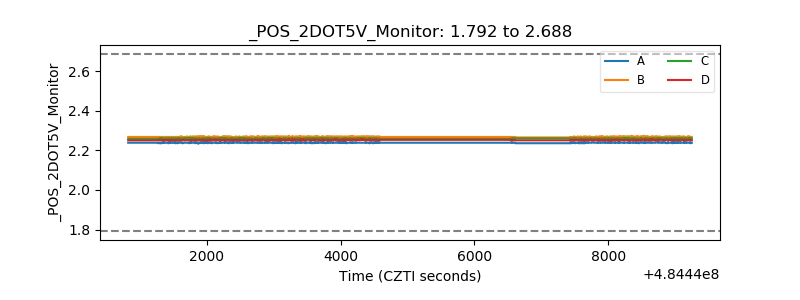 |
| +5 Volts monitor | 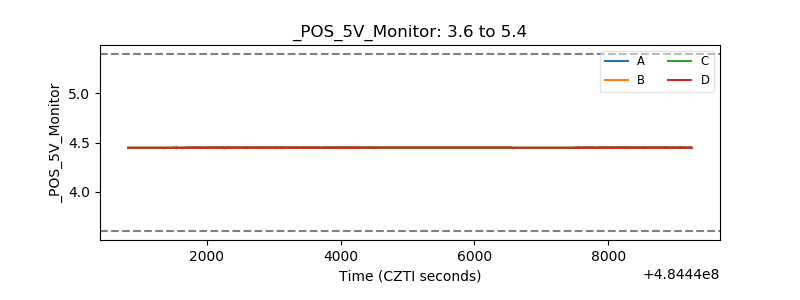 |
| _ROLL_ROT | 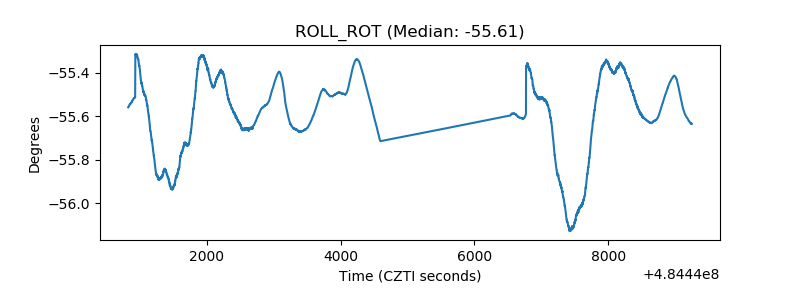 |
| _Roll_DEC | 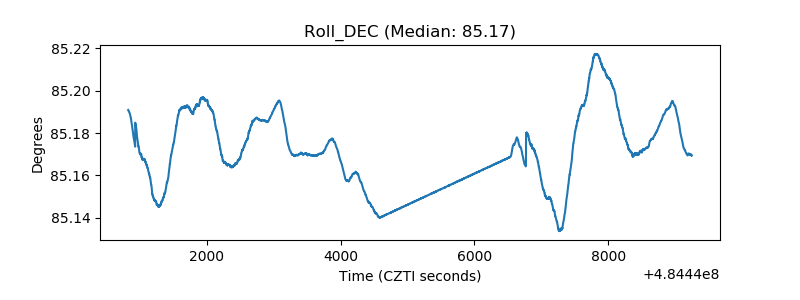 |
| _Roll_RA | 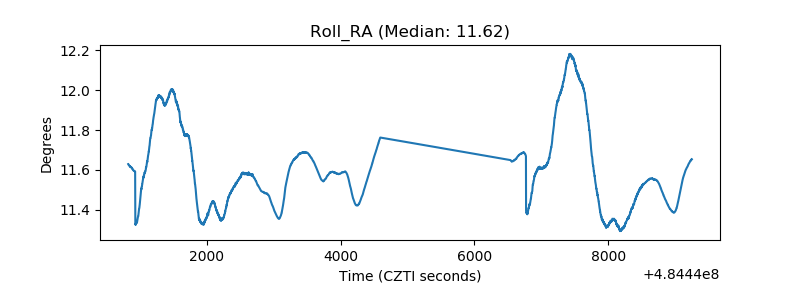 |
| Veto Counter | 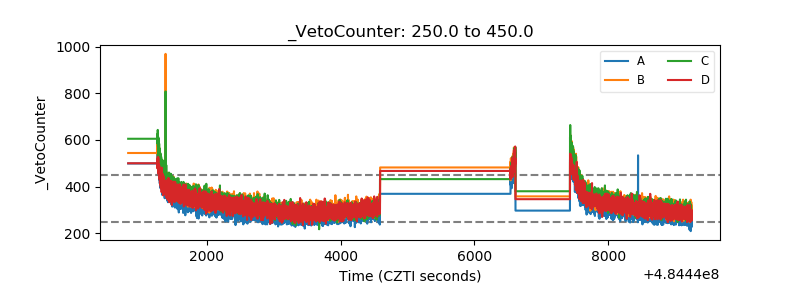 |