| Param | Original file | Final file |
|---|---|---|
| Filename | modeM0/AS1C09_011T06_9000006468_51992cztM0_level2.fits | modeM0/AS1C09_011T06_9000006468_51992cztM0_level2_quad_clean.evt |
| Size (bytes) | 834,503,040 | 96,701,760 |
| Size | 795.8 MB | 92.2 MB |
| Events in quadrant A | 8,430,719 | 576,935 |
| Events in quadrant B | 4,716,218 | 712,840 |
| Events in quadrant C | 6,921,257 | 604,238 |
| Events in quadrant D | 10,253,263 | 520,640 |
| Mode M0 | |||
|---|---|---|---|
| Quadrant | BADHDUFLAG | Total packets | Discarded packets |
| A | 0 | 30281 | 1 |
| B | 0 | 19462 | 1 |
| C | 0 | 25838 | 1 |
| D | 0 | 35641 | 1 |
| Mode M9 | |||
|---|---|---|---|
| Quadrant | BADHDUFLAG | Total packets | Discarded packets |
| A | 0 | 3 | 0 |
| B | 0 | 3 | 0 |
| C | 0 | 3 | 0 |
| D | 0 | 3 | 0 |
| Mode SS | |||
|---|---|---|---|
| Quadrant | BADHDUFLAG | Total packets | Discarded packets |
| A | 0 | 148 | 0 |
| B | 0 | 148 | 0 |
| C | 0 | 148 | 0 |
| D | 0 | 148 | 0 |
| Quadrant | Total seconds | Saturated seconds | Saturation percentage |
|---|---|---|---|
| A | 7374 | 1322 | 17.927855% |
| B | 7374 | 392 | 5.315975% |
| C | 7375 | 928 | 12.583051% |
| D | 7375 | 1518 | 20.583051% |
Noise dominated data is calculated using 1-second bins in cleaned event files. If a bin has >2000 counts, and if more than 50% of those come from <1% of pixels, then it is considered to be noise-dominated and hence unusable.
| Quadrant | # 1 sec bins | Bins with >0 counts | Bins with >2000 counts | High rate bins dominated by noise | Noise dominated (total time) | Noise dominated (detector-on time) | Marked lightcurve |
|---|---|---|---|---|---|---|---|
| A | 7684 | 7375 | 1093 | 1093 | 14.22% | 14.82% | 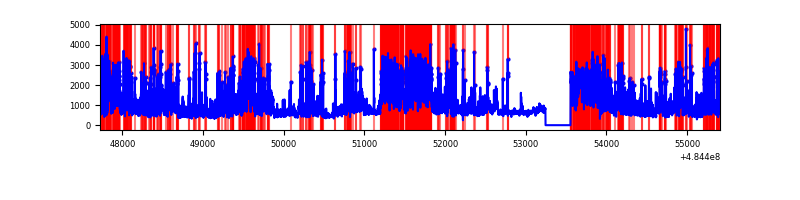 |
| B | 7684 | 7375 | 145 | 145 | 1.89% | 1.97% | 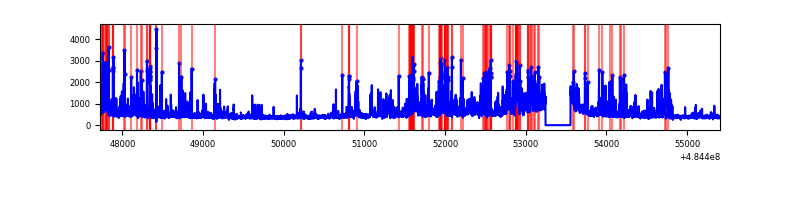 |
| C | 7685 | 7376 | 844 | 844 | 10.98% | 11.44% | 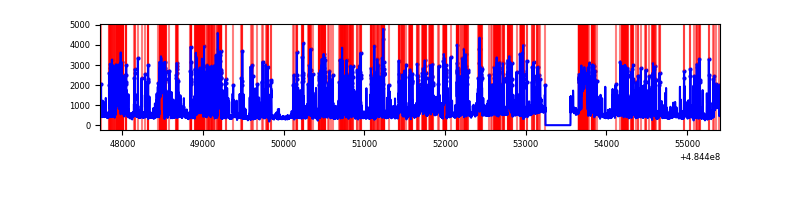 |
| D | 7685 | 7376 | 1549 | 1549 | 20.16% | 21.00% | 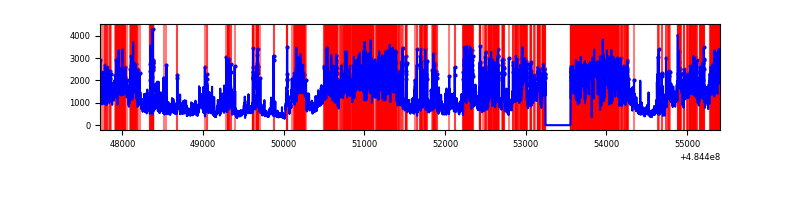 |
Top three noisy pixels from each quadrant. If the there are fewer than three noisy pixels in the level2.evt file, extra rows are filled as -1
| Pixel properties | Quadrant properties | ||||||
|---|---|---|---|---|---|---|---|
| Quadrant | DetID | PixID | Counts | Sigma | Mean | Median | Sigma |
| A | 7 | 64 | 2680258 | 15235.65 | 699 | 682 | 175.9 |
| A | 4 | 95 | 683445 | 3882.08 | 699 | 682 | 175.9 |
| A | 3 | 14 | 631231 | 3585.2 | 699 | 682 | 175.9 |
| B | 4 | 206 | 364411 | 2272.33 | 748 | 721 | 160.1 |
| B | 4 | 81 | 233451 | 1454.09 | 748 | 721 | 160.1 |
| B | 4 | 170 | 149769 | 931.25 | 748 | 721 | 160.1 |
| C | 15 | 224 | 3276414 | 16657.12 | 703 | 696 | 196.7 |
| C | 13 | 3 | 374696 | 1901.8 | 703 | 696 | 196.7 |
| C | 15 | 192 | 135494 | 685.45 | 703 | 696 | 196.7 |
| D | 6 | 42 | 3571615 | 18565.56 | 670 | 640 | 192.3 |
| D | 8 | 176 | 1038048 | 5393.5 | 670 | 640 | 192.3 |
| D | 12 | 6 | 783641 | 4070.84 | 670 | 640 | 192.3 |
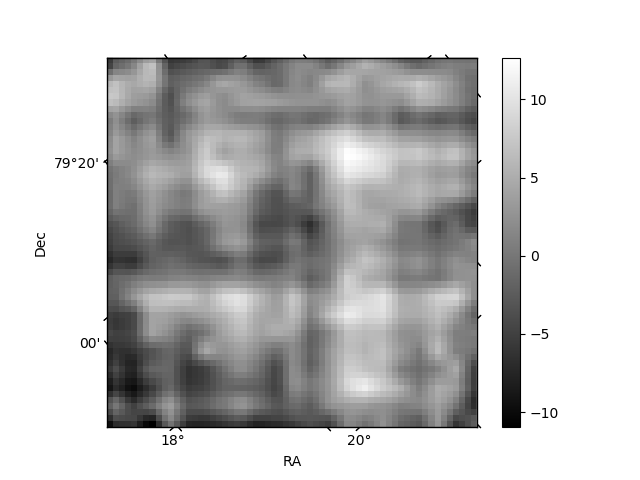
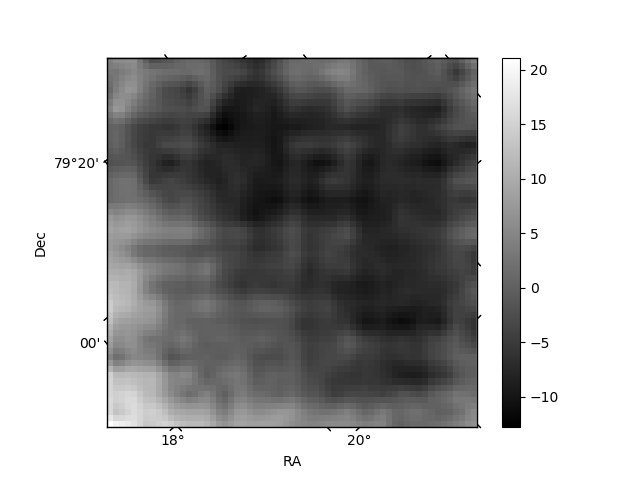
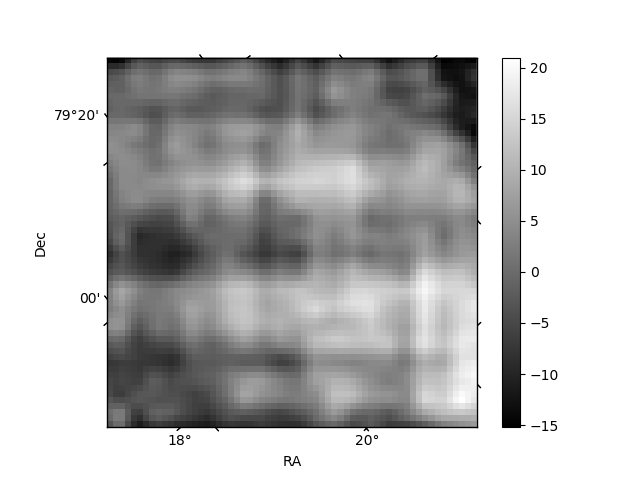
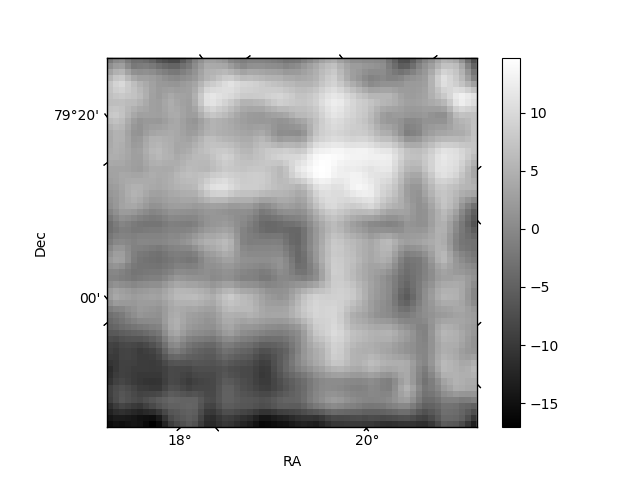
Histogram calculated using DETX and DETY for each event in the final _common_clean file
| Quadrant A | 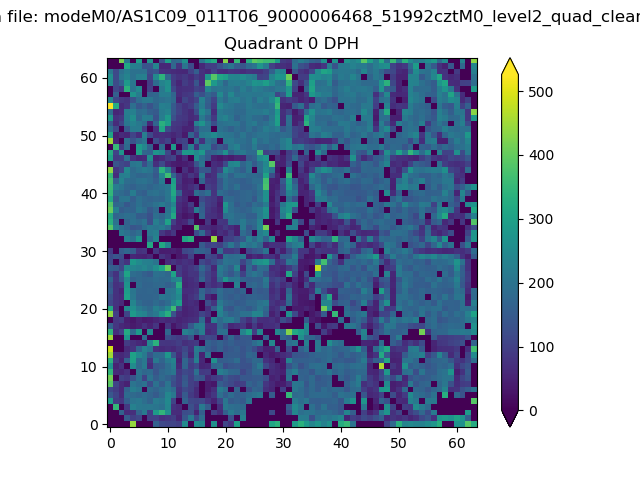 |
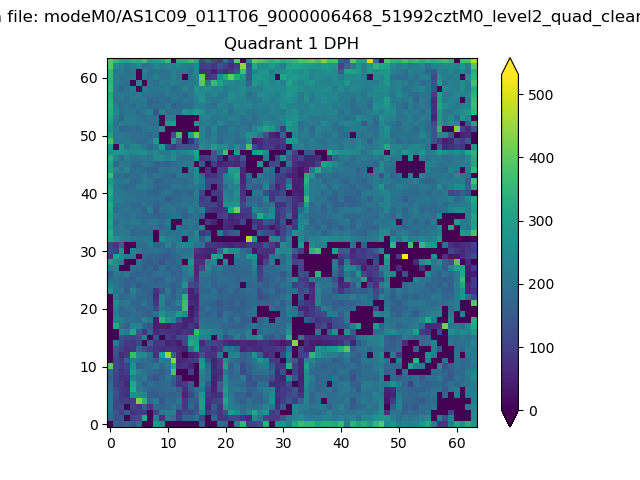 |
Quadrant B |
|---|---|---|---|
| Quadrant D | 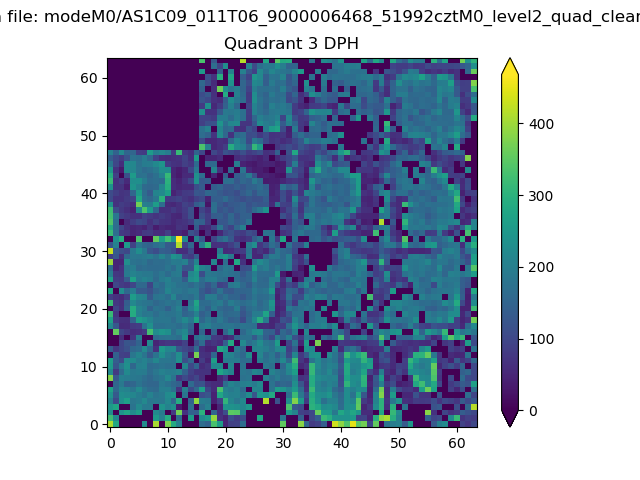 |
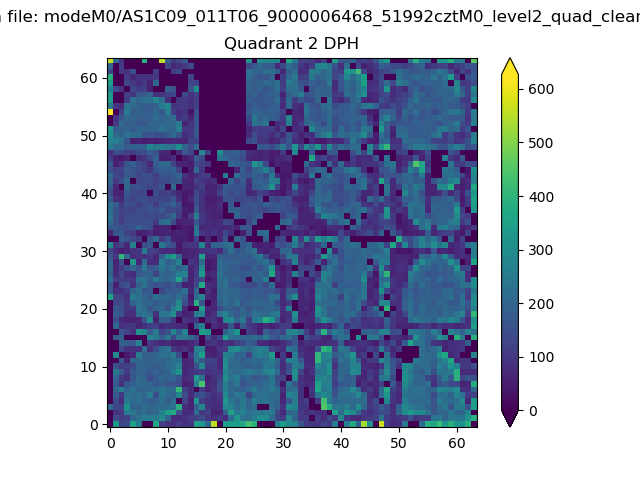 |
Quadrant C |
| Plot type | Count rate plots | Images |
|---|---|---|
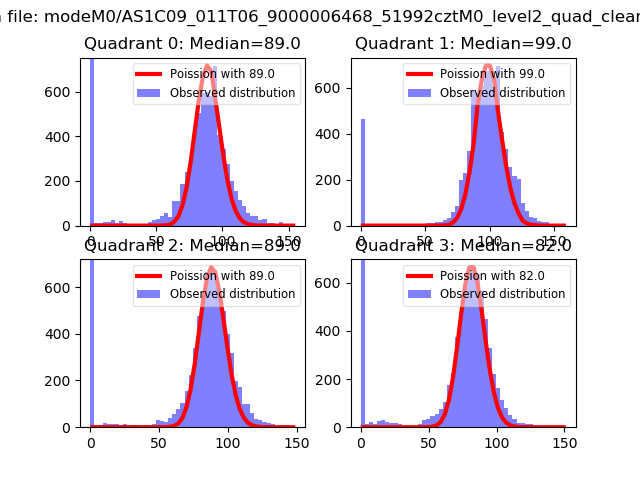
| Comparison with Poisson distribution Blue bars denote a histogram of data divided into 1 sec bins. Red curve is a Poisson curve with rate = median count rate of data. |
 |
 |
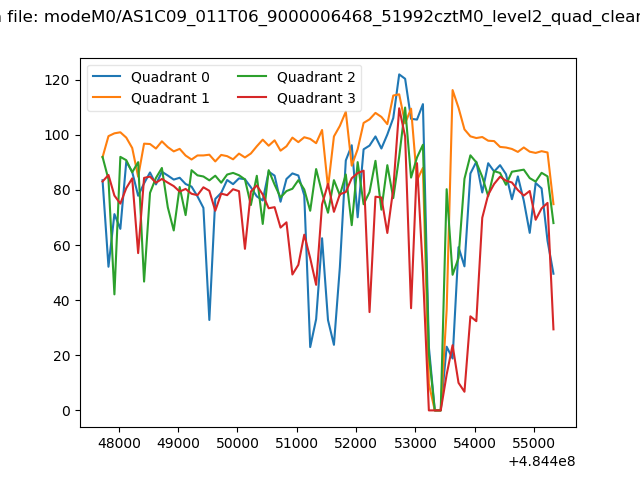
| Quadrant-wise count rates Data is divided into 100 sec bins |
 |
|
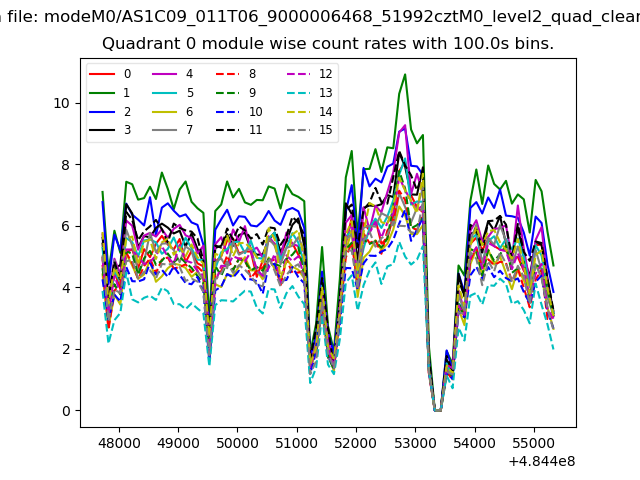
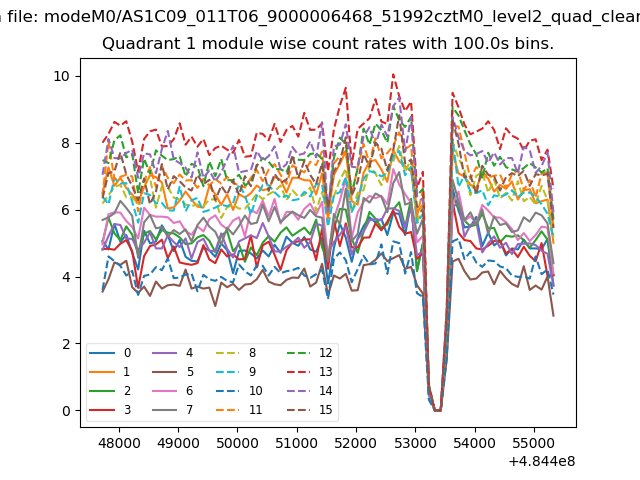
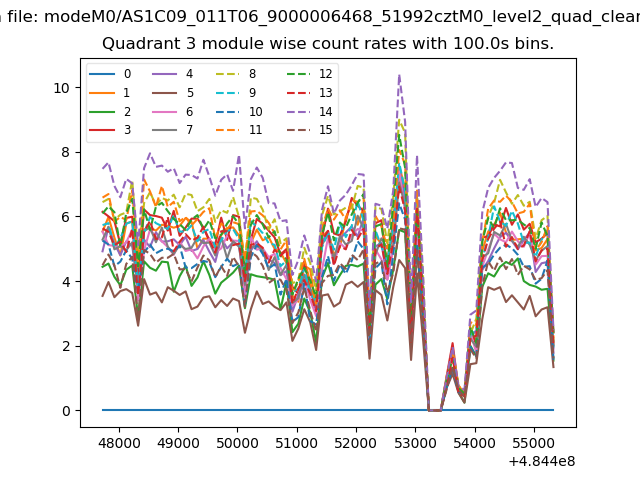
| Module-wise count rates for Quadrant A Data is divided into 100 sec bins |
 |
 |
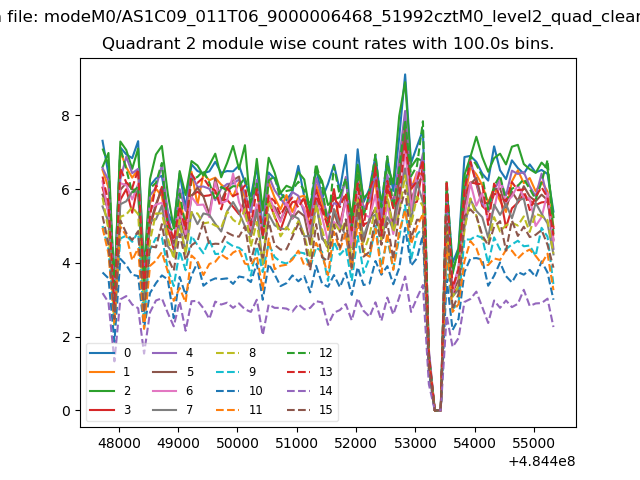
| Module-wise count rates for Quadrant B Data is divided into 100 sec bins |
 |
 |
| Module-wise count rates for Quadrant C Data is divided into 100 sec bins |
 |
 |
| Module-wise count rates for Quadrant D Data is divided into 100 sec bins |
 |
 |
| Parameter | Plot |
|---|---|
| CZT HV Monitor | 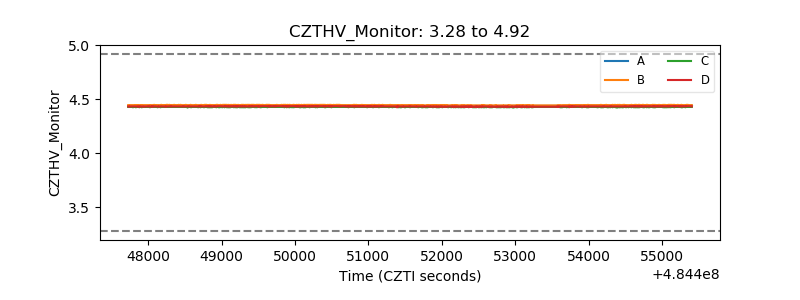 |
| D_VDD | 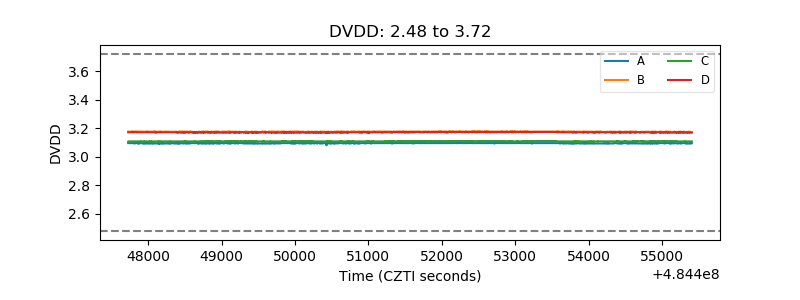 |
| Temperature 1 | 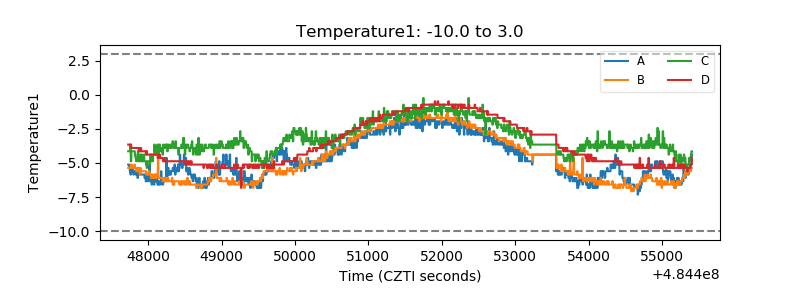 |
| Veto HV Monitor | 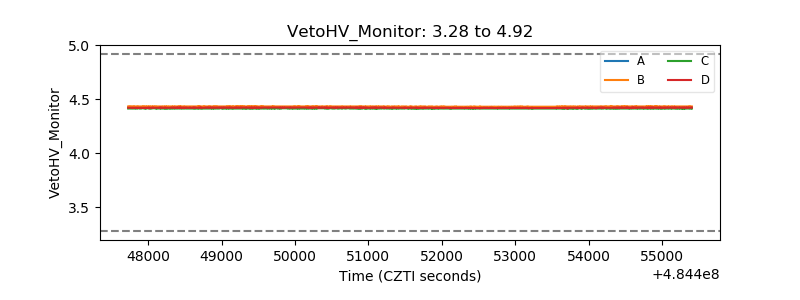 |
| Veto LLD | 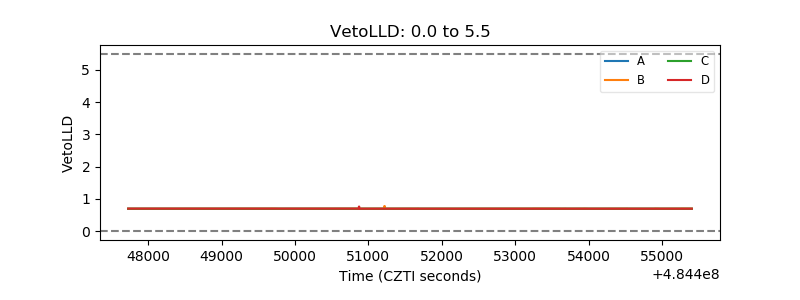 |
| Alpha Counter | 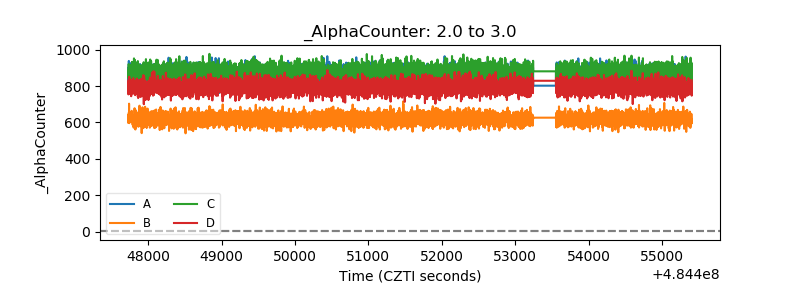 |
| _CPM_Rate | 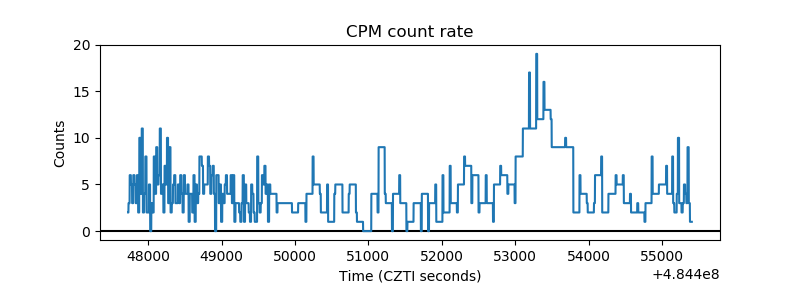 |
| CZT Counter | 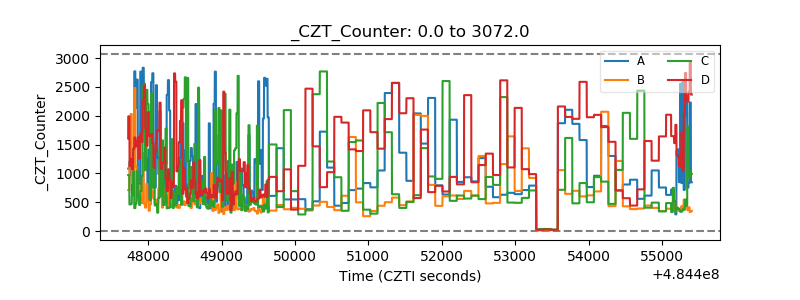 |
| +2.5 Volts monitor | 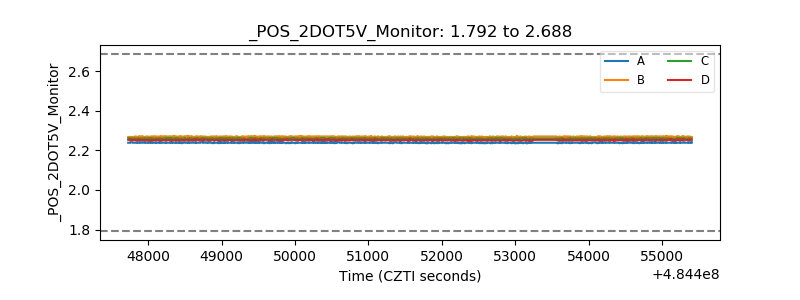 |
| +5 Volts monitor | 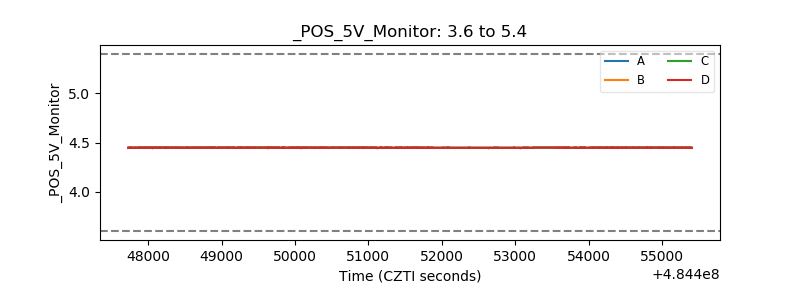 |
| _ROLL_ROT | 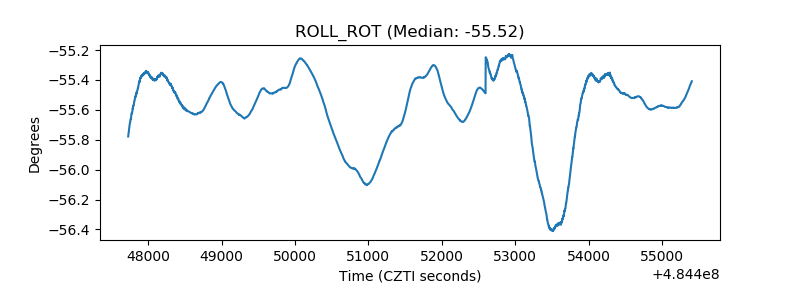 |
| _Roll_DEC | 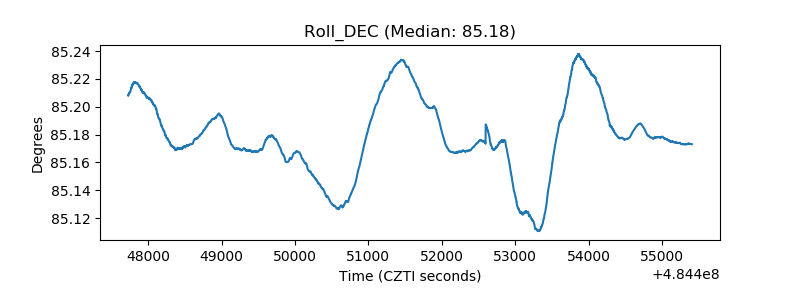 |
| _Roll_RA | 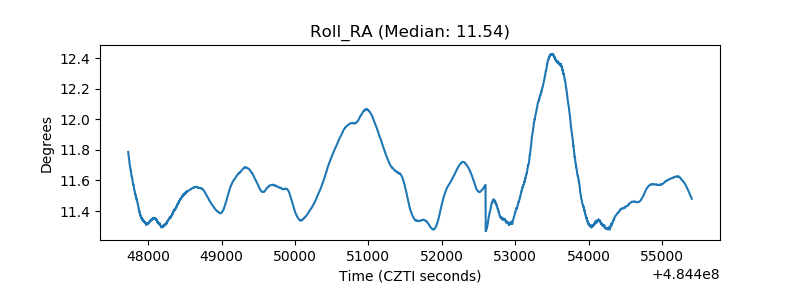 |
| Veto Counter | 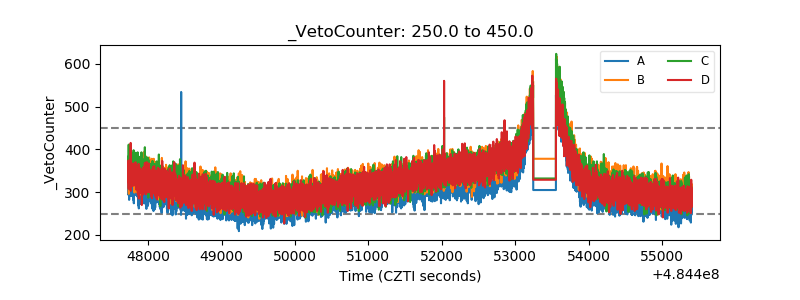 |