| Param | Original file | Final file |
|---|---|---|
| Filename | modeM0/AS1C09_011T06_9000006468_51993cztM0_level2.fits | modeM0/AS1C09_011T06_9000006468_51993cztM0_level2_quad_clean.evt |
| Size (bytes) | 836,147,520 | 102,381,120 |
| Size | 797.4 MB | 97.6 MB |
| Events in quadrant A | 8,152,463 | 647,166 |
| Events in quadrant B | 4,588,326 | 755,090 |
| Events in quadrant C | 7,860,367 | 603,340 |
| Events in quadrant D | 9,753,622 | 556,398 |
| Mode M0 | |||
|---|---|---|---|
| Quadrant | BADHDUFLAG | Total packets | Discarded packets |
| A | 0 | 29631 | 0 |
| B | 0 | 19307 | 0 |
| C | 0 | 28811 | 0 |
| D | 0 | 34409 | 0 |
| Mode SS | |||
|---|---|---|---|
| Quadrant | BADHDUFLAG | Total packets | Discarded packets |
| A | 0 | 154 | 0 |
| B | 0 | 154 | 0 |
| C | 0 | 154 | 0 |
| D | 0 | 154 | 0 |
| Quadrant | Total seconds | Saturated seconds | Saturation percentage |
|---|---|---|---|
| A | 7729 | 881 | 11.398629% |
| B | 7729 | 232 | 3.001682% |
| C | 7729 | 1197 | 15.487126% |
| D | 7729 | 1313 | 16.987967% |
Noise dominated data is calculated using 1-second bins in cleaned event files. If a bin has >2000 counts, and if more than 50% of those come from <1% of pixels, then it is considered to be noise-dominated and hence unusable.
| Quadrant | # 1 sec bins | Bins with >0 counts | Bins with >2000 counts | High rate bins dominated by noise | Noise dominated (total time) | Noise dominated (detector-on time) | Marked lightcurve |
|---|---|---|---|---|---|---|---|
| A | 7729 | 7729 | 757 | 757 | 9.79% | 9.79% | 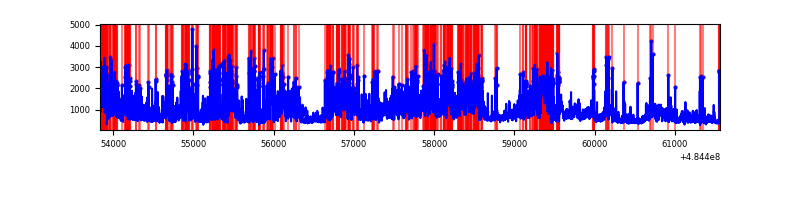 |
| B | 7729 | 7729 | 131 | 131 | 1.69% | 1.69% | 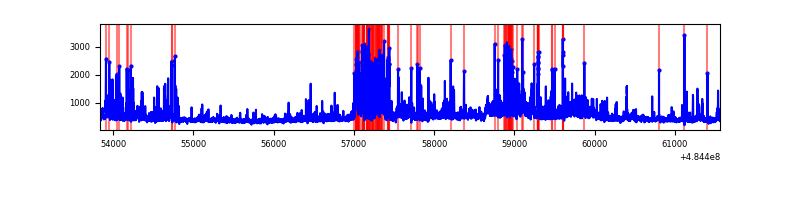 |
| C | 7729 | 7729 | 1075 | 1075 | 13.91% | 13.91% | 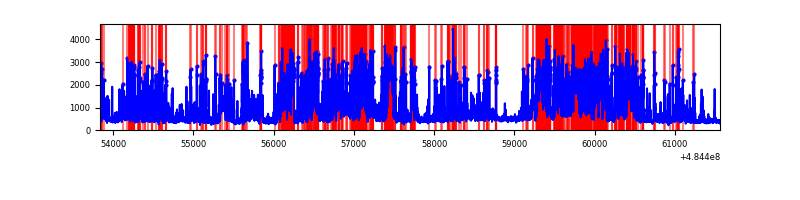 |
| D | 7729 | 7729 | 1434 | 1434 | 18.55% | 18.55% | 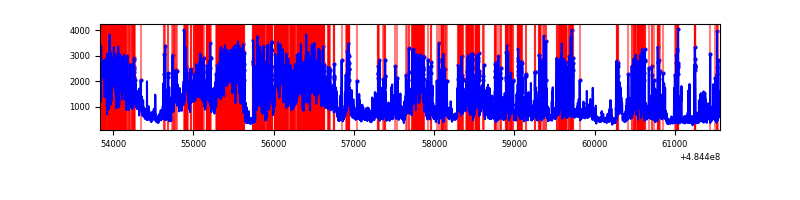 |
Top three noisy pixels from each quadrant. If the there are fewer than three noisy pixels in the level2.evt file, extra rows are filled as -1
| Pixel properties | Quadrant properties | ||||||
|---|---|---|---|---|---|---|---|
| Quadrant | DetID | PixID | Counts | Sigma | Mean | Median | Sigma |
| A | 7 | 64 | 1652837 | 8954.42 | 749 | 732 | 184.5 |
| A | 4 | 95 | 1522252 | 8246.65 | 749 | 732 | 184.5 |
| A | 3 | 14 | 371998 | 2012.26 | 749 | 732 | 184.5 |
| B | 4 | 206 | 424010 | 2577.77 | 782 | 755 | 164.2 |
| B | 10 | 247 | 112436 | 680.18 | 782 | 755 | 164.2 |
| B | 1 | 223 | 99057 | 598.69 | 782 | 755 | 164.2 |
| C | 15 | 224 | 3972808 | 19843.43 | 722 | 717 | 200.2 |
| C | 15 | 192 | 276794 | 1379.2 | 722 | 717 | 200.2 |
| C | 12 | 252 | 146235 | 726.97 | 722 | 717 | 200.2 |
| D | 6 | 42 | 3556408 | 17185.1 | 718 | 685 | 206.9 |
| D | 12 | 16 | 751850 | 3630.44 | 718 | 685 | 206.9 |
| D | 12 | 6 | 639062 | 3085.33 | 718 | 685 | 206.9 |
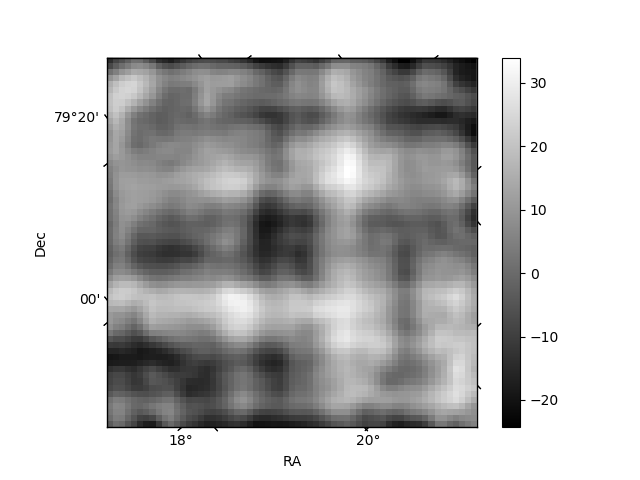
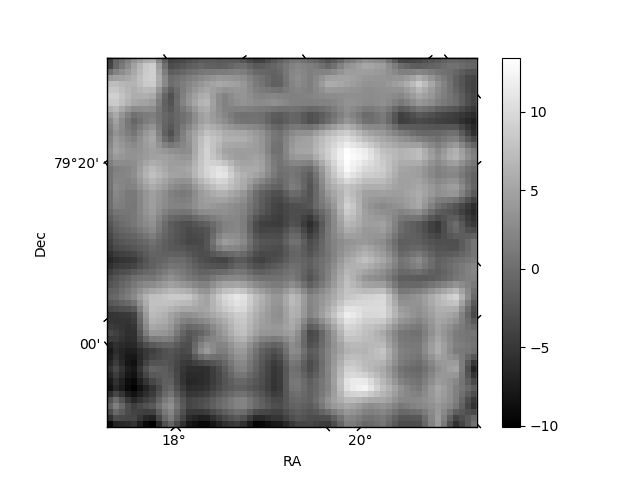
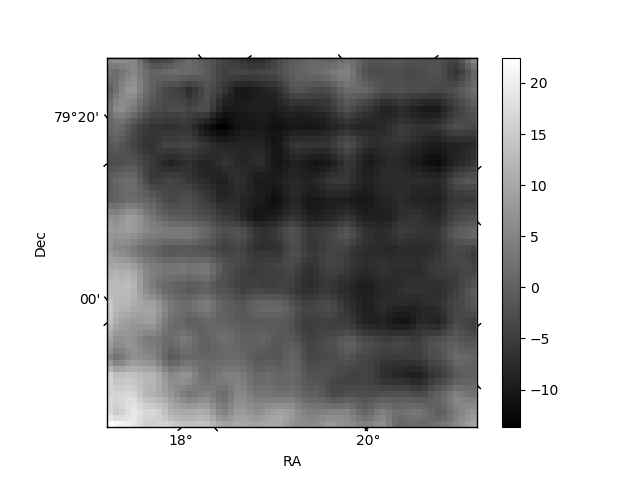
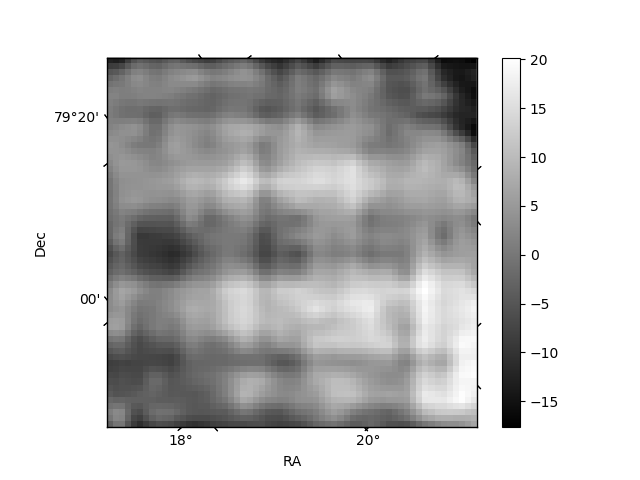
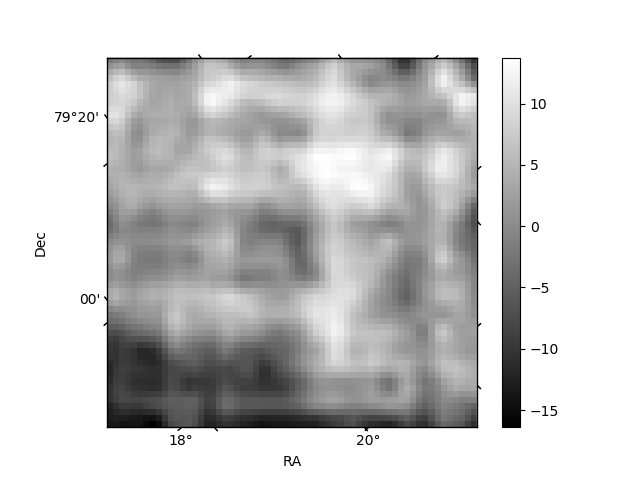
Histogram calculated using DETX and DETY for each event in the final _common_clean file
| Quadrant A | 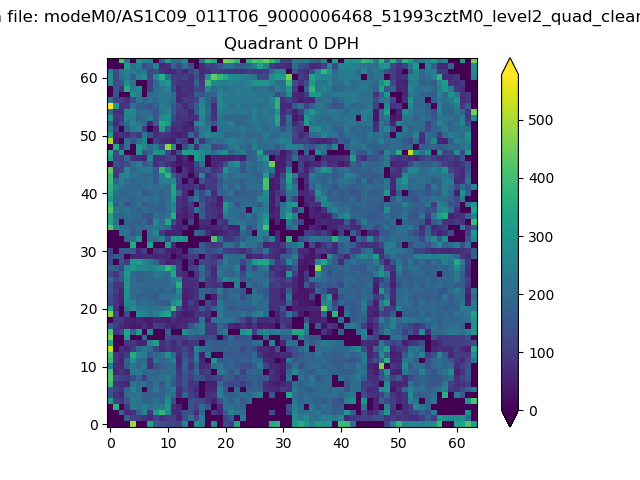 |
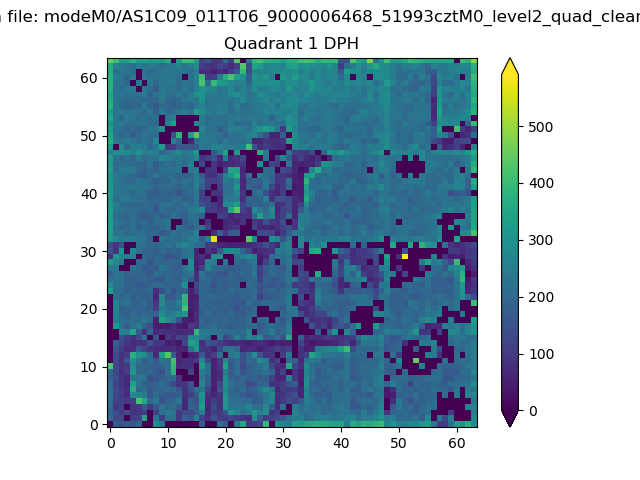 |
Quadrant B |
|---|---|---|---|
| Quadrant D | 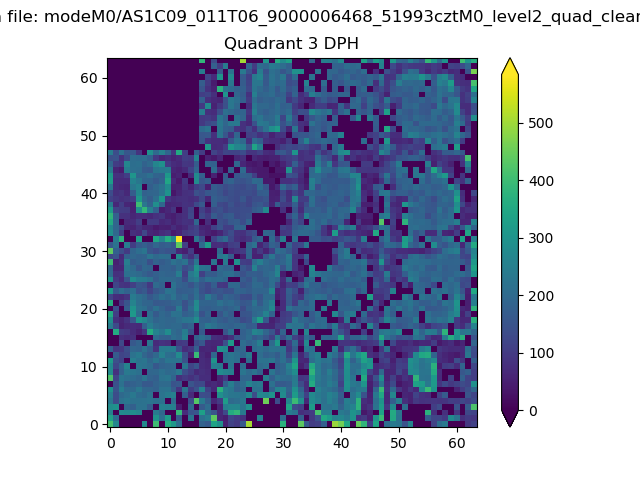 |
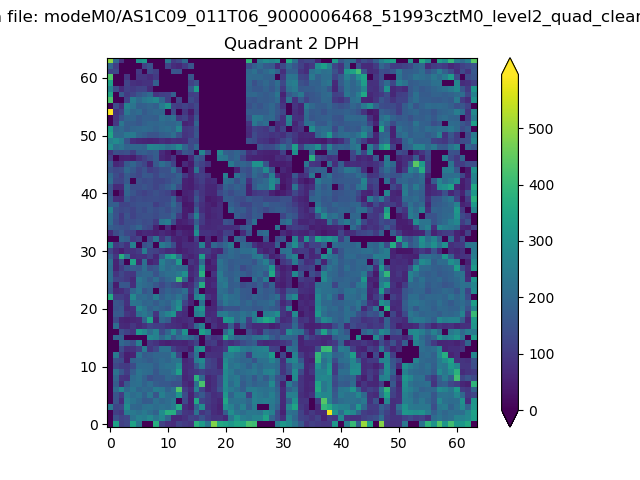 |
Quadrant C |
| Plot type | Count rate plots | Images |
|---|---|---|
| Comparison with Poisson distribution Blue bars denote a histogram of data divided into 1 sec bins. Red curve is a Poisson curve with rate = median count rate of data. |
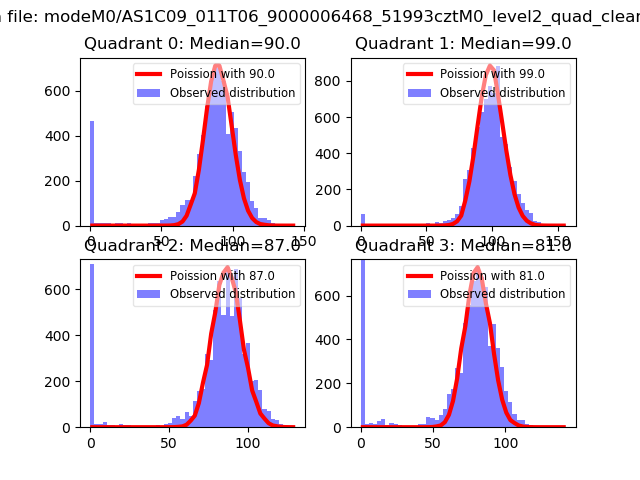 |
 |
| Quadrant-wise count rates Data is divided into 100 sec bins |
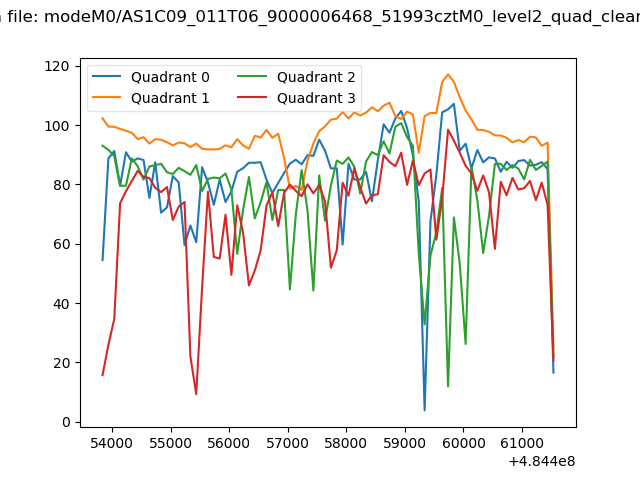 |
|
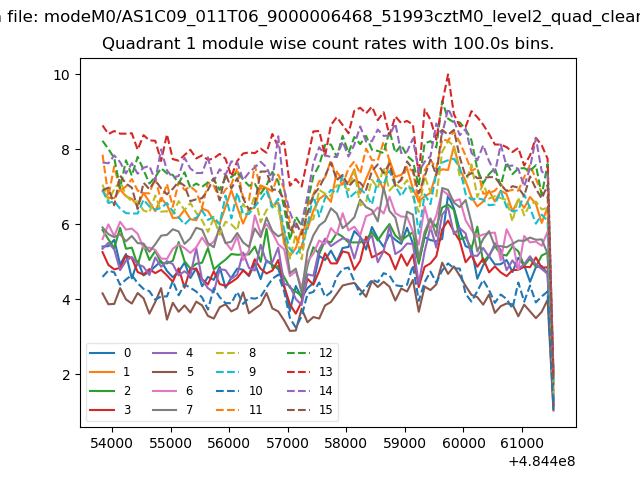
| Module-wise count rates for Quadrant A Data is divided into 100 sec bins |
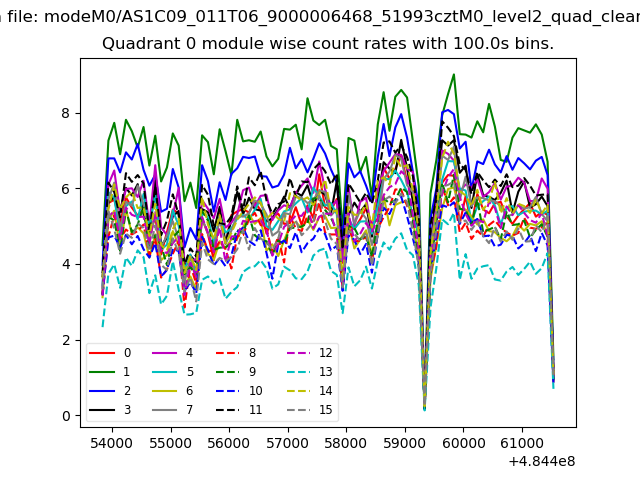 |
 |
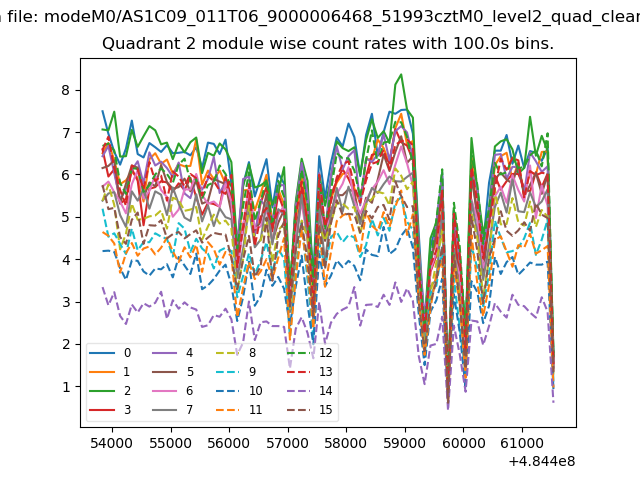
| Module-wise count rates for Quadrant B Data is divided into 100 sec bins |
 |
 |
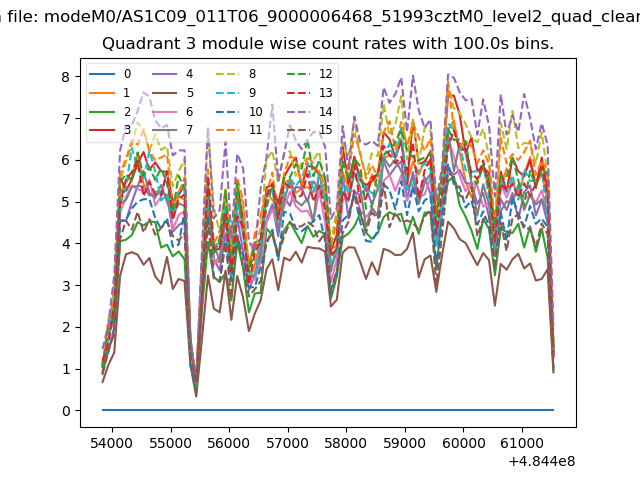
| Module-wise count rates for Quadrant C Data is divided into 100 sec bins |
 |
 |
| Module-wise count rates for Quadrant D Data is divided into 100 sec bins |
 |
 |
| Parameter | Plot |
|---|---|
| CZT HV Monitor |  |
| D_VDD | 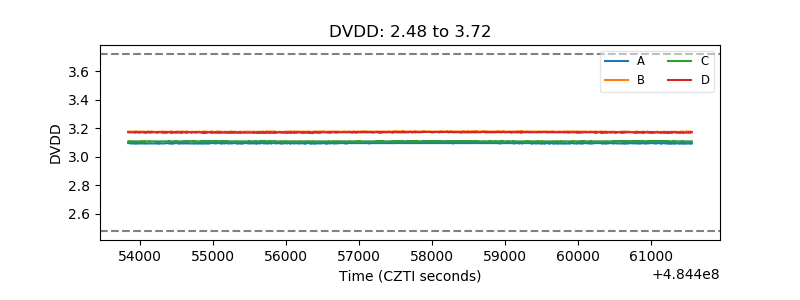 |
| Temperature 1 | 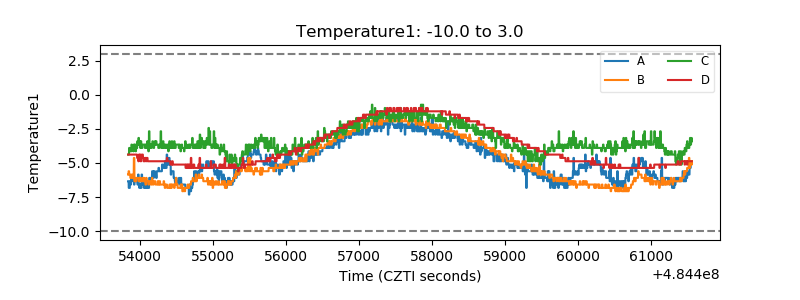 |
| Veto HV Monitor | 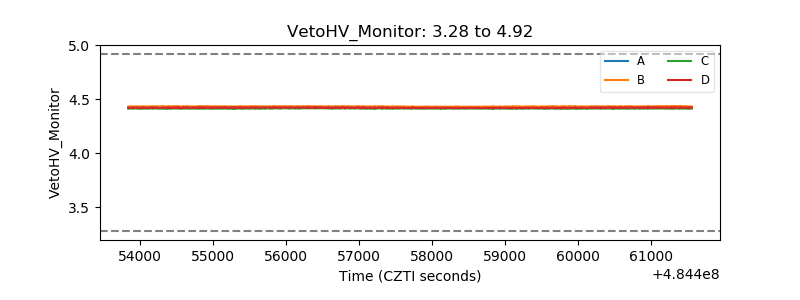 |
| Veto LLD | 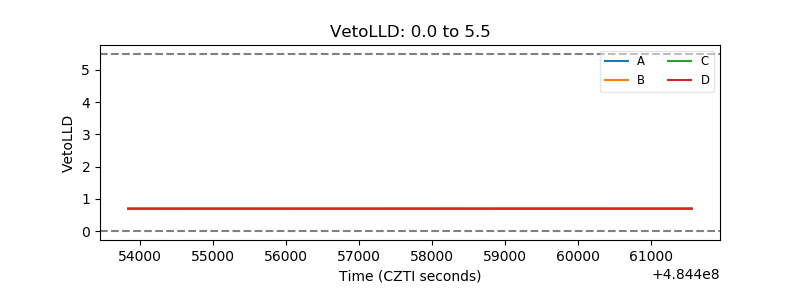 |
| Alpha Counter | 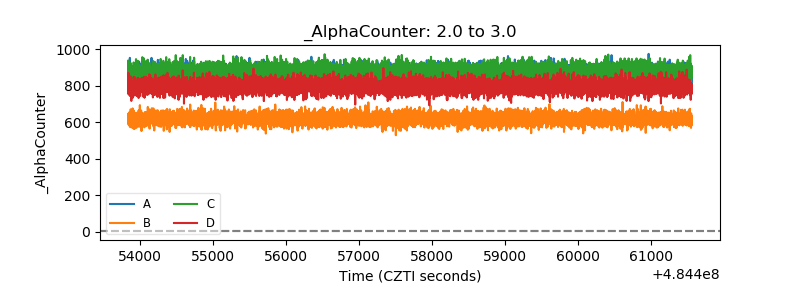 |
| _CPM_Rate | 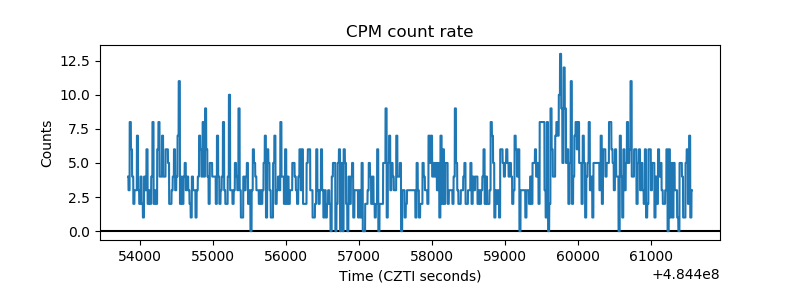 |
| CZT Counter | 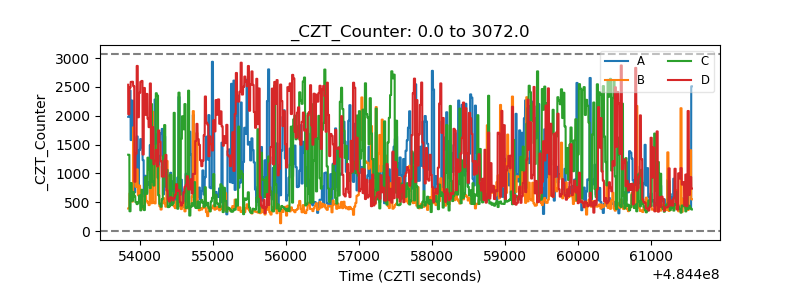 |
| +2.5 Volts monitor | 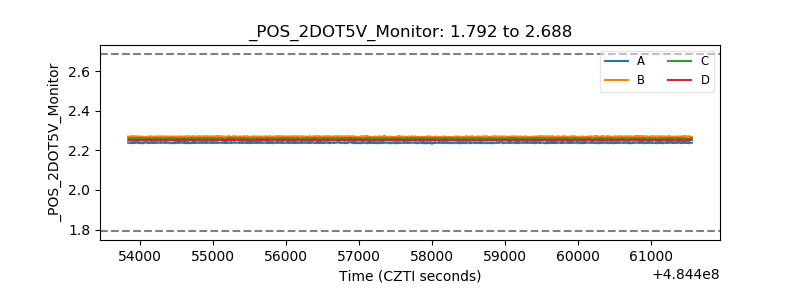 |
| +5 Volts monitor | 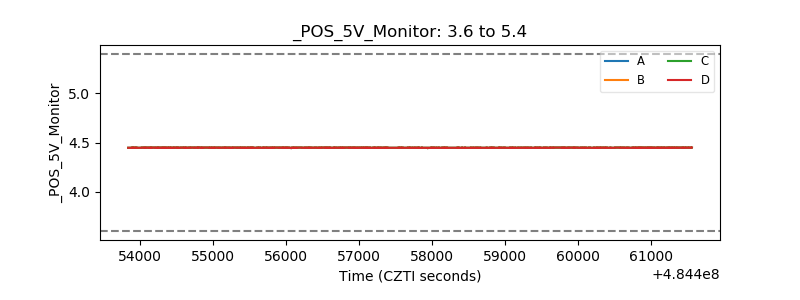 |
| _ROLL_ROT | 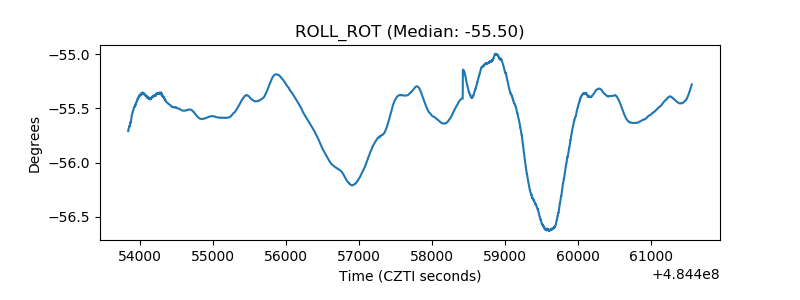 |
| _Roll_DEC | 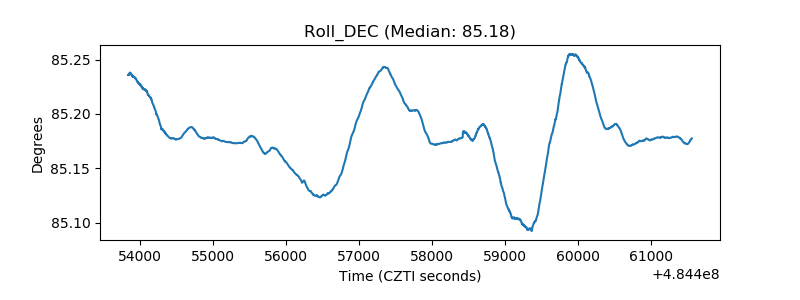 |
| _Roll_RA | 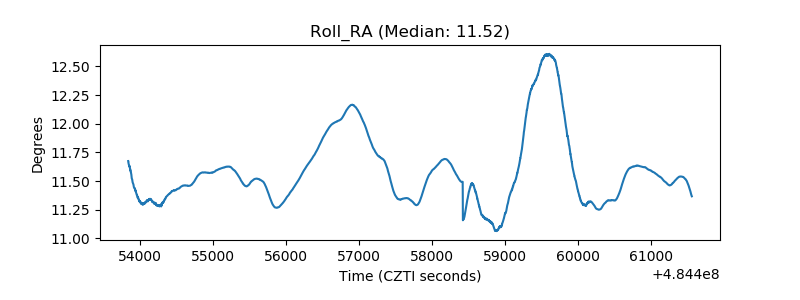 |
| Veto Counter | 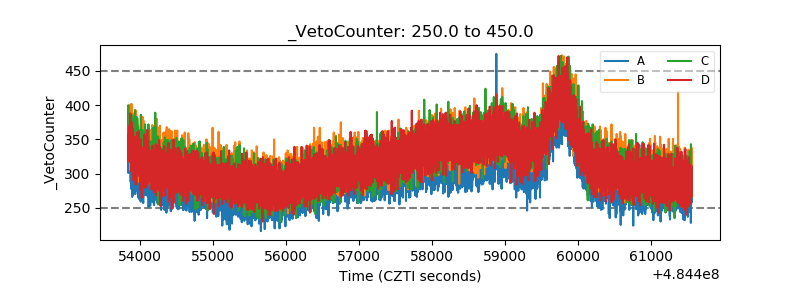 |