| Param | Original file | Final file |
|---|---|---|
| Filename | modeM0/AS1C09_011T06_9000006468_51994cztM0_level2.fits | modeM0/AS1C09_011T06_9000006468_51994cztM0_level2_quad_clean.evt |
| Size (bytes) | 760,017,600 | 91,103,040 |
| Size | 724.8 MB | 86.9 MB |
| Events in quadrant A | 5,166,785 | 602,697 |
| Events in quadrant B | 4,308,485 | 691,699 |
| Events in quadrant C | 6,434,177 | 561,456 |
| Events in quadrant D | 11,676,870 | 409,663 |
| Mode M0 | |||
|---|---|---|---|
| Quadrant | BADHDUFLAG | Total packets | Discarded packets |
| A | 0 | 20097 | 1 |
| B | 0 | 17753 | 0 |
| C | 0 | 24159 | 0 |
| D | 0 | 39610 | 0 |
| Mode SS | |||
|---|---|---|---|
| Quadrant | BADHDUFLAG | Total packets | Discarded packets |
| A | 0 | 142 | 0 |
| B | 0 | 142 | 0 |
| C | 0 | 142 | 0 |
| D | 0 | 142 | 0 |
| Quadrant | Total seconds | Saturated seconds | Saturation percentage |
|---|---|---|---|
| A | 7071 | 452 | 6.392307% |
| B | 7072 | 156 | 2.205882% |
| C | 7072 | 924 | 13.065611% |
| D | 7072 | 2494 | 35.265837% |
Noise dominated data is calculated using 1-second bins in cleaned event files. If a bin has >2000 counts, and if more than 50% of those come from <1% of pixels, then it is considered to be noise-dominated and hence unusable.
| Quadrant | # 1 sec bins | Bins with >0 counts | Bins with >2000 counts | High rate bins dominated by noise | Noise dominated (total time) | Noise dominated (detector-on time) | Marked lightcurve |
|---|---|---|---|---|---|---|---|
| A | 7071 | 7071 | 407 | 407 | 5.76% | 5.76% | 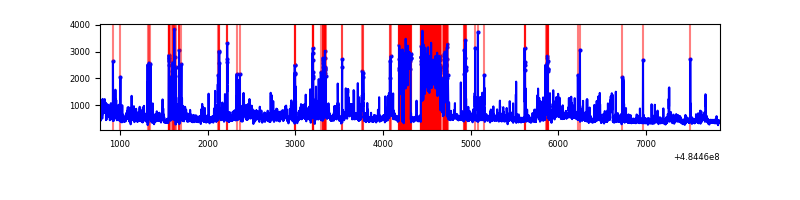 |
| B | 7072 | 7072 | 99 | 99 | 1.40% | 1.40% | 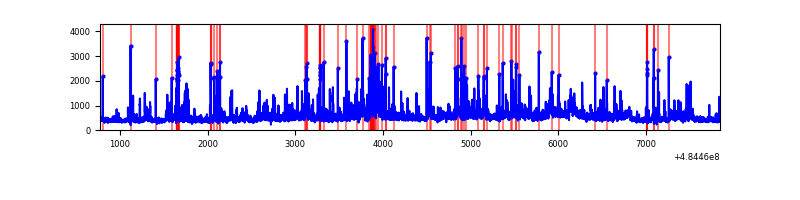 |
| C | 7072 | 7072 | 816 | 816 | 11.54% | 11.54% | 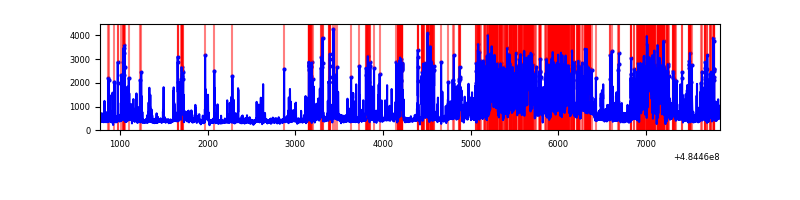 |
| D | 7072 | 7072 | 2532 | 2532 | 35.80% | 35.80% | 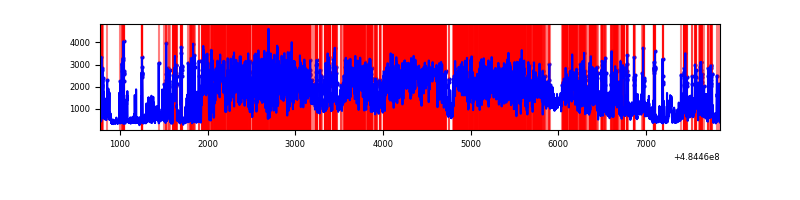 |
Top three noisy pixels from each quadrant. If the there are fewer than three noisy pixels in the level2.evt file, extra rows are filled as -1
| Pixel properties | Quadrant properties | ||||||
|---|---|---|---|---|---|---|---|
| Quadrant | DetID | PixID | Counts | Sigma | Mean | Median | Sigma |
| A | 5 | 243 | 796729 | 4532.78 | 704 | 686 | 175.6 |
| A | 4 | 95 | 345959 | 1966.03 | 704 | 686 | 175.6 |
| A | 7 | 64 | 344405 | 1957.18 | 704 | 686 | 175.6 |
| B | 4 | 206 | 253753 | 1660.01 | 716 | 690 | 152.4 |
| B | 10 | 128 | 160863 | 1050.68 | 716 | 690 | 152.4 |
| B | 0 | 172 | 118871 | 775.23 | 716 | 690 | 152.4 |
| C | 15 | 224 | 2195038 | 11813.37 | 664 | 658 | 185.8 |
| C | 4 | 5 | 496519 | 2669.45 | 664 | 658 | 185.8 |
| C | 13 | 3 | 430299 | 2312.96 | 664 | 658 | 185.8 |
| D | 6 | 42 | 3876188 | 22460.42 | 608 | 580 | 172.6 |
| D | 12 | 16 | 2341554 | 13566.71 | 608 | 580 | 172.6 |
| D | 12 | 17 | 1018175 | 5897.29 | 608 | 580 | 172.6 |
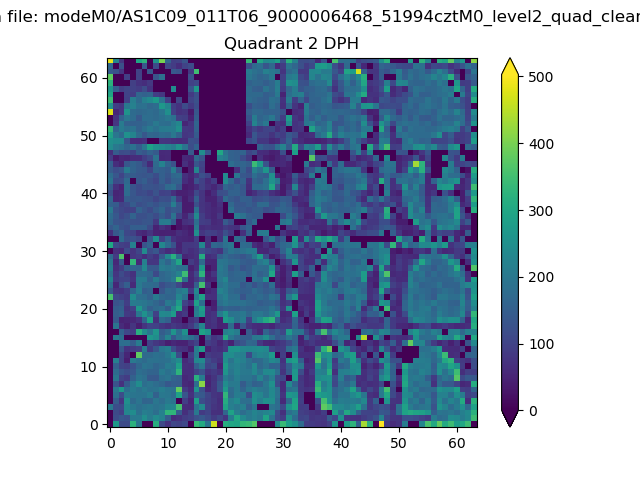
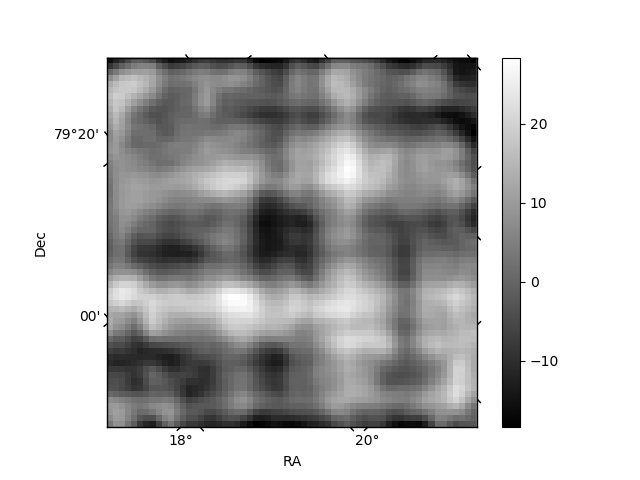
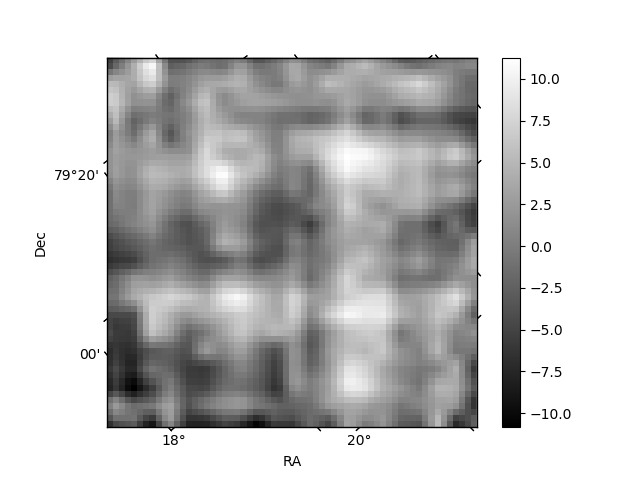
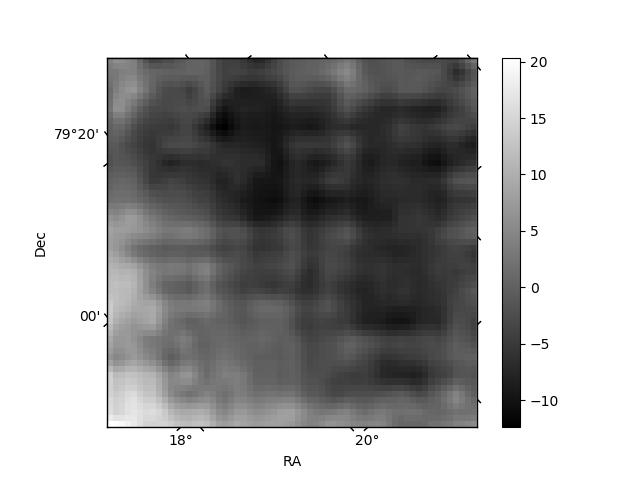
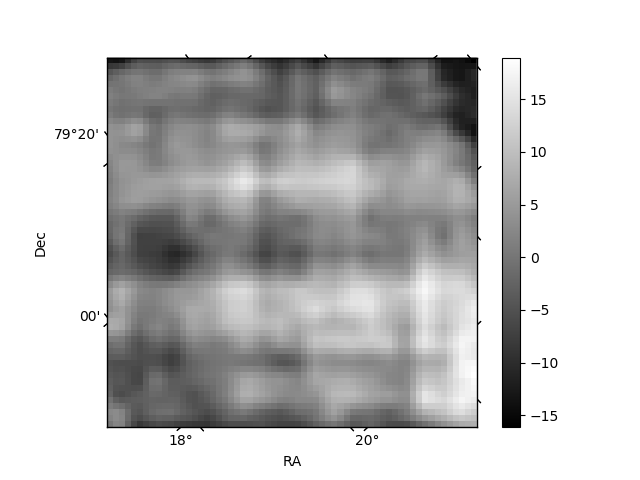
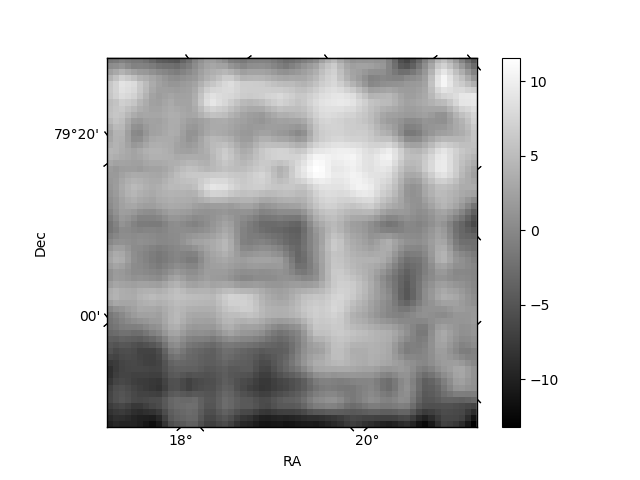
Histogram calculated using DETX and DETY for each event in the final _common_clean file
| Quadrant A | 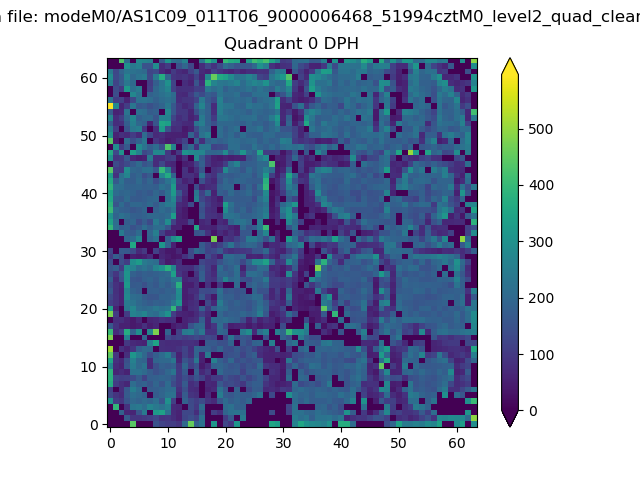 |
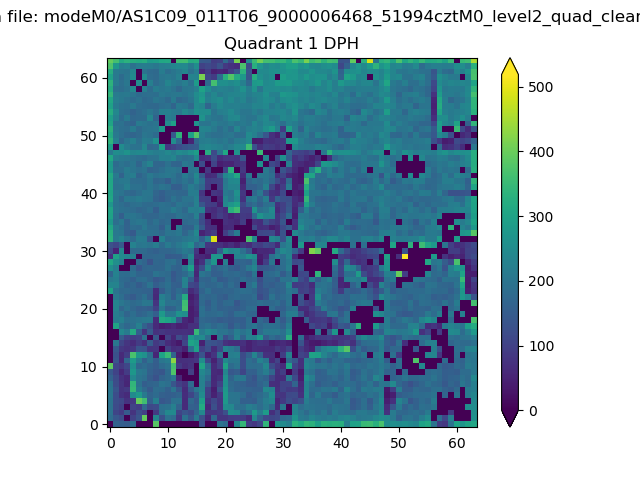 |
Quadrant B |
|---|---|---|---|
| Quadrant D | 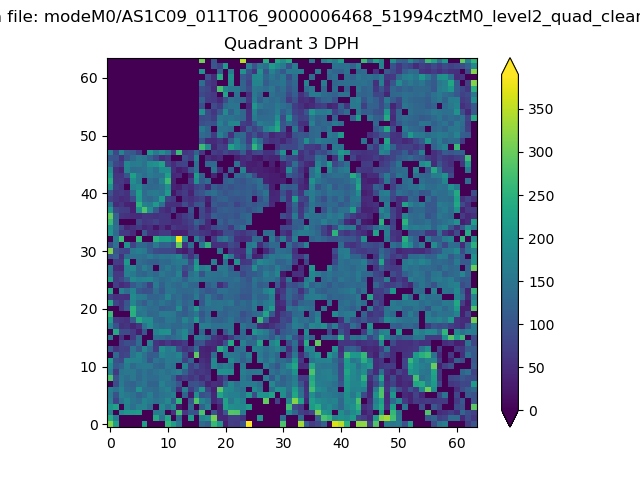 |
 |
Quadrant C |
| Plot type | Count rate plots | Images |
|---|---|---|
| Comparison with Poisson distribution Blue bars denote a histogram of data divided into 1 sec bins. Red curve is a Poisson curve with rate = median count rate of data. |
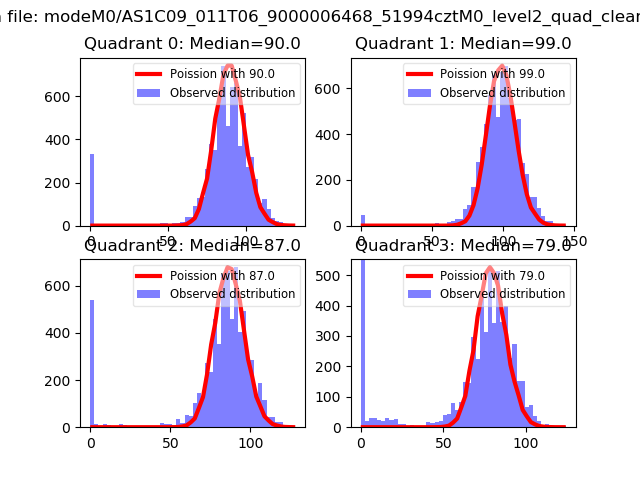 |
 |
| Quadrant-wise count rates Data is divided into 100 sec bins |
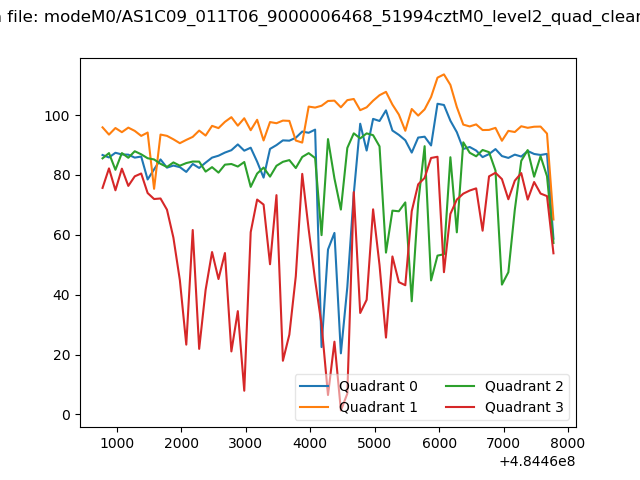 |
|
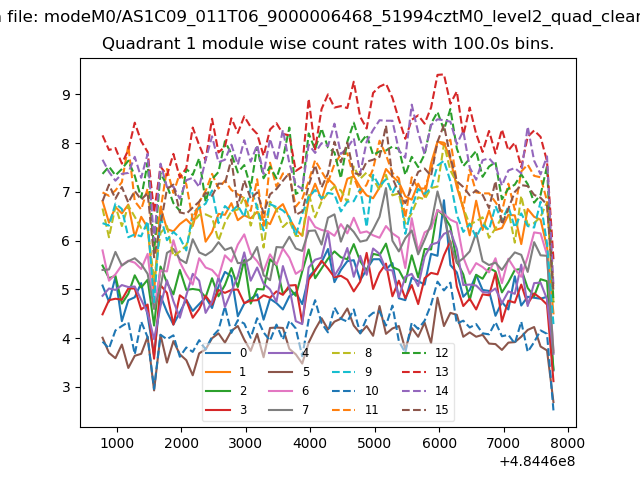
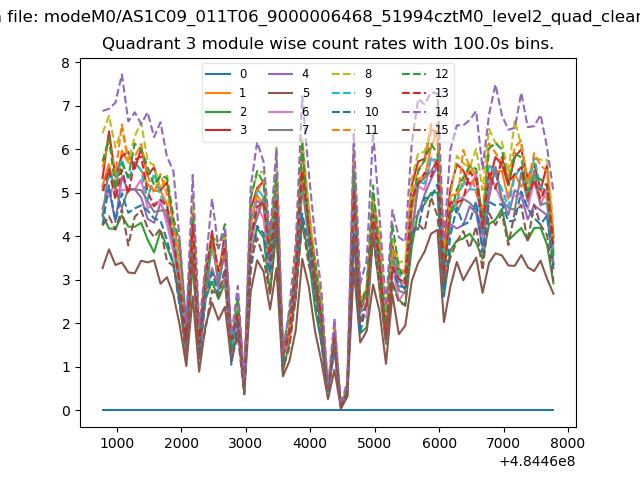
| Module-wise count rates for Quadrant A Data is divided into 100 sec bins |
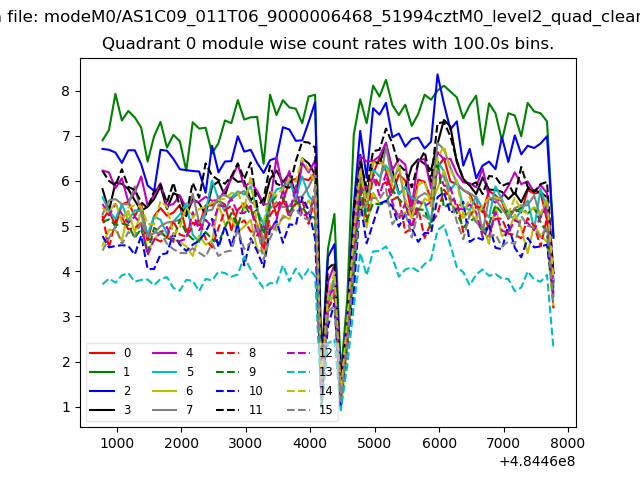 |
 |
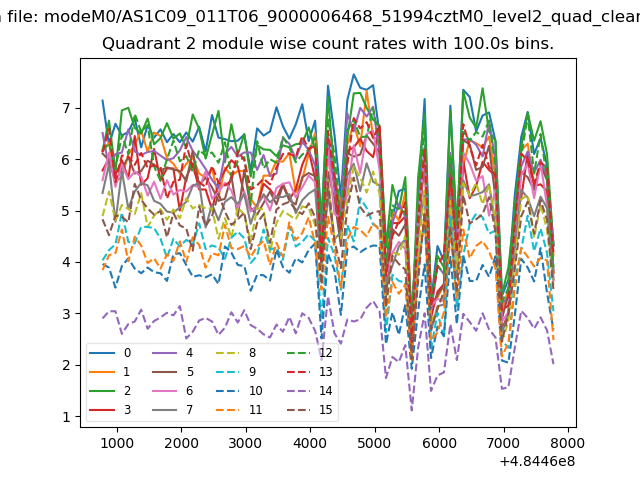
| Module-wise count rates for Quadrant B Data is divided into 100 sec bins |
 |
 |
| Module-wise count rates for Quadrant C Data is divided into 100 sec bins |
 |
 |
| Module-wise count rates for Quadrant D Data is divided into 100 sec bins |
 |
 |
| Parameter | Plot |
|---|---|
| CZT HV Monitor |  |
| D_VDD | 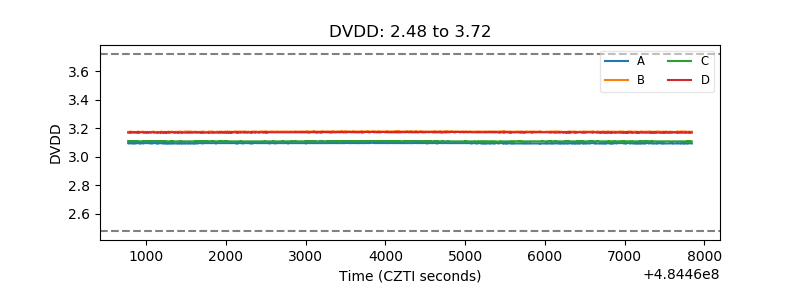 |
| Temperature 1 | 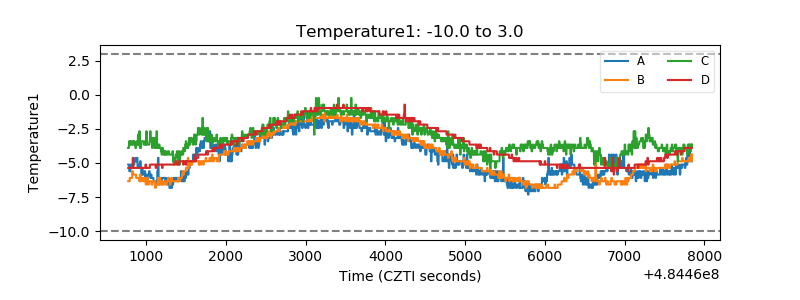 |
| Veto HV Monitor | 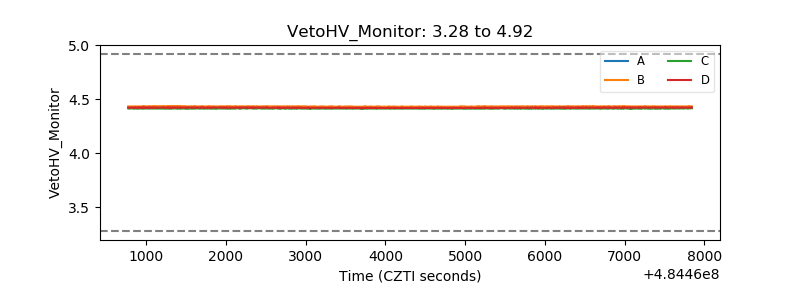 |
| Veto LLD | 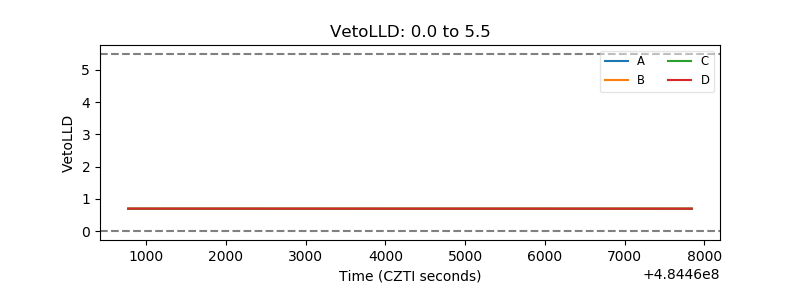 |
| Alpha Counter | 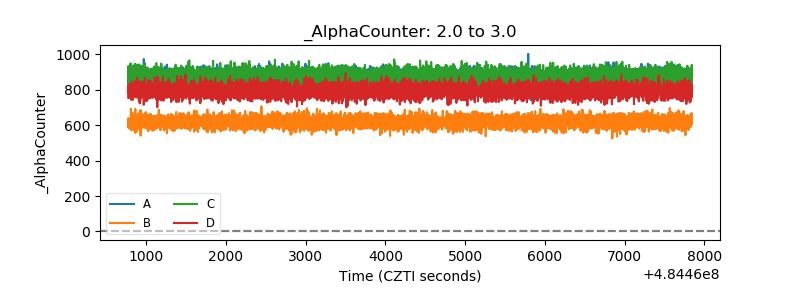 |
| _CPM_Rate | 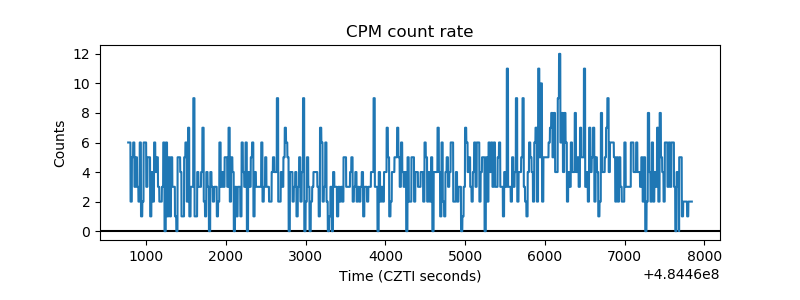 |
| CZT Counter | 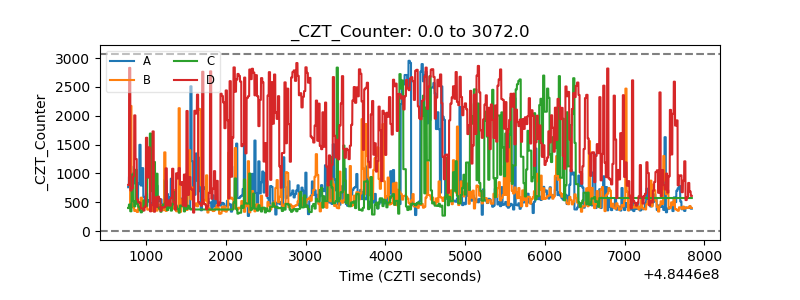 |
| +2.5 Volts monitor | 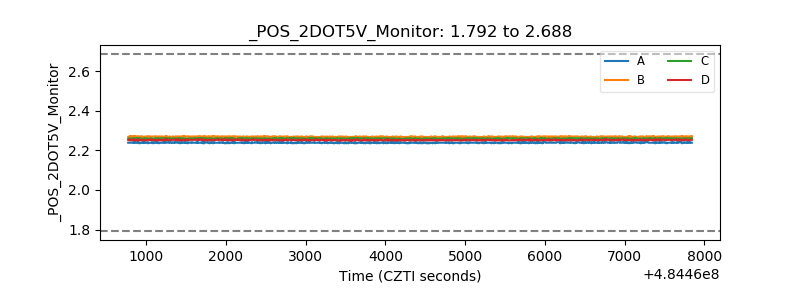 |
| +5 Volts monitor | 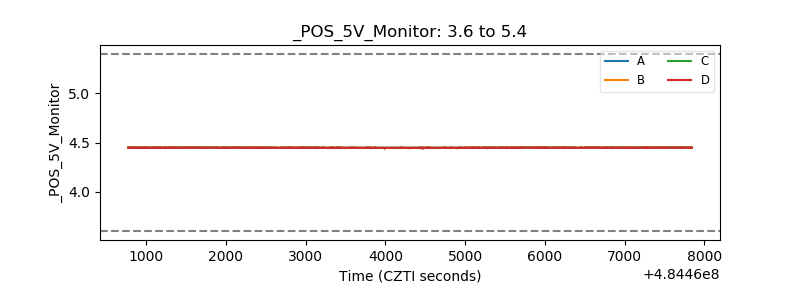 |
| _ROLL_ROT | 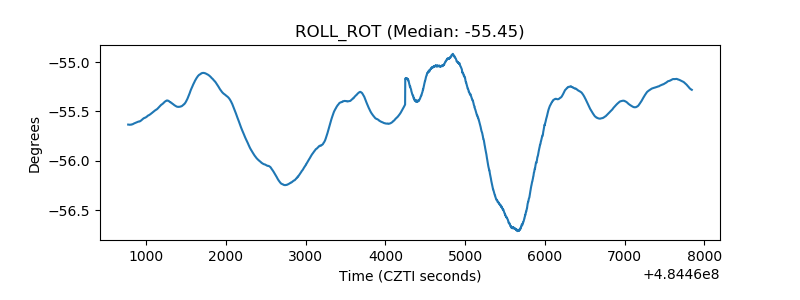 |
| _Roll_DEC | 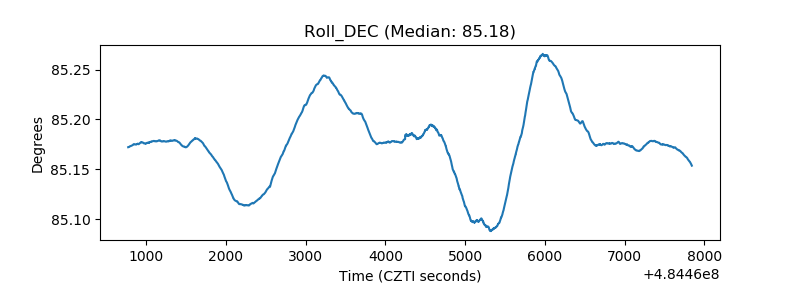 |
| _Roll_RA | 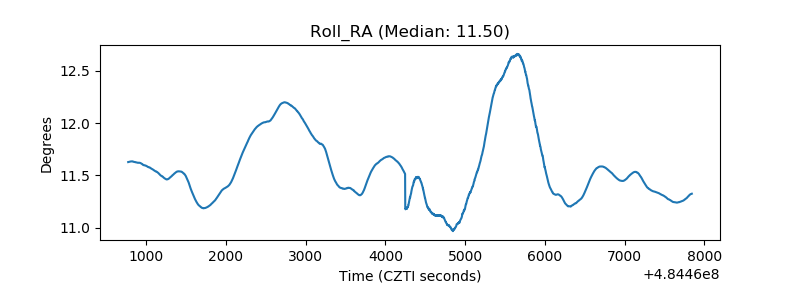 |
| Veto Counter | 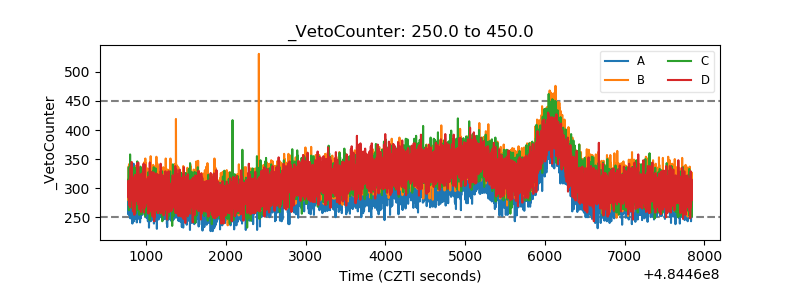 |