| Param | Original file | Final file |
|---|---|---|
| Filename | modeM0/AS1C09_011T06_9000006468_51997cztM0_level2.fits | modeM0/AS1C09_011T06_9000006468_51997cztM0_level2_quad_clean.evt |
| Size (bytes) | 1,831,340,160 | 211,029,120 |
| Size | 1.7 GB | 201.3 MB |
| Events in quadrant A | 12,715,245 | 1,442,764 |
| Events in quadrant B | 11,073,505 | 1,599,272 |
| Events in quadrant C | 15,335,701 | 1,326,932 |
| Events in quadrant D | 27,374,262 | 862,517 |
| Mode M0 | |||
|---|---|---|---|
| Quadrant | BADHDUFLAG | Total packets | Discarded packets |
| A | 0 | 49471 | 4 |
| B | 0 | 44551 | 2 |
| C | 0 | 57201 | 2 |
| D | 0 | 93021 | 2 |
| Mode M9 | |||
|---|---|---|---|
| Quadrant | BADHDUFLAG | Total packets | Discarded packets |
| A | 0 | 2 | 0 |
| B | 0 | 2 | 0 |
| C | 0 | 2 | 0 |
| D | 0 | 2 | 0 |
| Mode SS | |||
|---|---|---|---|
| Quadrant | BADHDUFLAG | Total packets | Discarded packets |
| A | 0 | 340 | 0 |
| B | 0 | 340 | 0 |
| C | 0 | 340 | 0 |
| D | 0 | 340 | 0 |
| Quadrant | Total seconds | Saturated seconds | Saturation percentage |
|---|---|---|---|
| A | 16764 | 972 | 5.798139% |
| B | 16764 | 726 | 4.330709% |
| C | 16764 | 1859 | 11.089239% |
| D | 16765 | 6327 | 37.739338% |
Noise dominated data is calculated using 1-second bins in cleaned event files. If a bin has >2000 counts, and if more than 50% of those come from <1% of pixels, then it is considered to be noise-dominated and hence unusable.
| Quadrant | # 1 sec bins | Bins with >0 counts | Bins with >2000 counts | High rate bins dominated by noise | Noise dominated (total time) | Noise dominated (detector-on time) | Marked lightcurve |
|---|---|---|---|---|---|---|---|
| A | 17034 | 16765 | 747 | 747 | 4.39% | 4.46% | 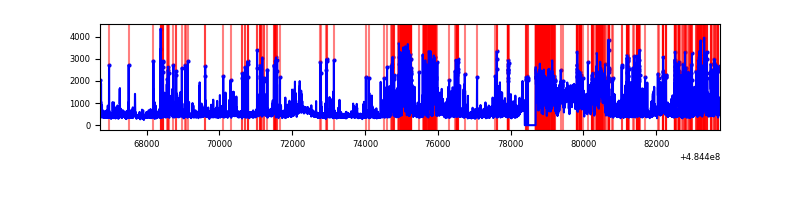 |
| B | 17034 | 16765 | 440 | 440 | 2.58% | 2.62% | 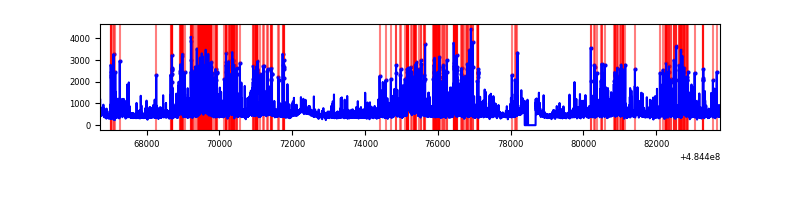 |
| C | 17034 | 16766 | 1716 | 1716 | 10.07% | 10.23% | 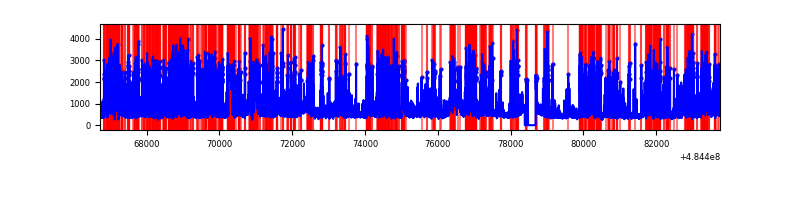 |
| D | 17035 | 16765 | 6217 | 6217 | 36.50% | 37.08% | 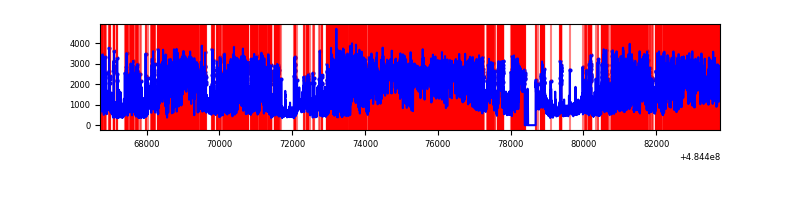 |
Top three noisy pixels from each quadrant. If the there are fewer than three noisy pixels in the level2.evt file, extra rows are filled as -1
| Pixel properties | Quadrant properties | ||||||
|---|---|---|---|---|---|---|---|
| Quadrant | DetID | PixID | Counts | Sigma | Mean | Median | Sigma |
| A | 7 | 64 | 2312530 | 5537.56 | 1707 | 1668 | 417.3 |
| A | 4 | 95 | 1869382 | 4475.64 | 1707 | 1668 | 417.3 |
| A | 3 | 14 | 235655 | 560.71 | 1707 | 1668 | 417.3 |
| B | 4 | 206 | 1453442 | 4000.61 | 1711 | 1651 | 362.9 |
| B | 0 | 172 | 345042 | 946.26 | 1711 | 1651 | 362.9 |
| B | 10 | 128 | 266729 | 730.46 | 1711 | 1651 | 362.9 |
| C | 15 | 224 | 4819002 | 10690.82 | 1625 | 1612 | 450.6 |
| C | 13 | 3 | 1204887 | 2670.33 | 1625 | 1612 | 450.6 |
| C | 4 | 5 | 739760 | 1638.11 | 1625 | 1612 | 450.6 |
| D | 6 | 42 | 7766510 | 19331.44 | 1420 | 1357 | 401.7 |
| D | 12 | 17 | 5851995 | 14565.23 | 1420 | 1357 | 401.7 |
| D | 12 | 16 | 2172548 | 5405.2 | 1420 | 1357 | 401.7 |
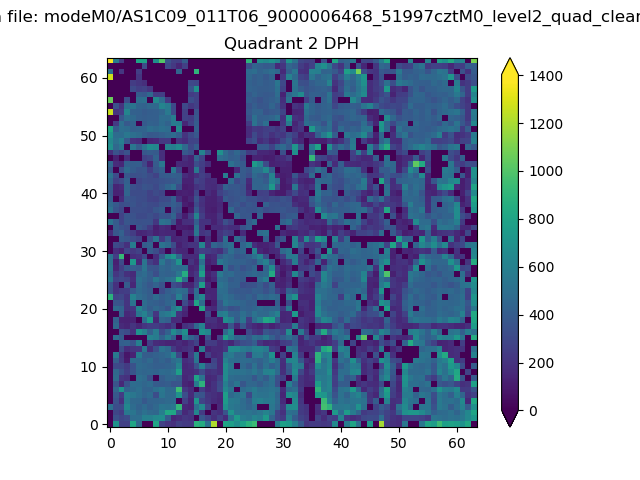
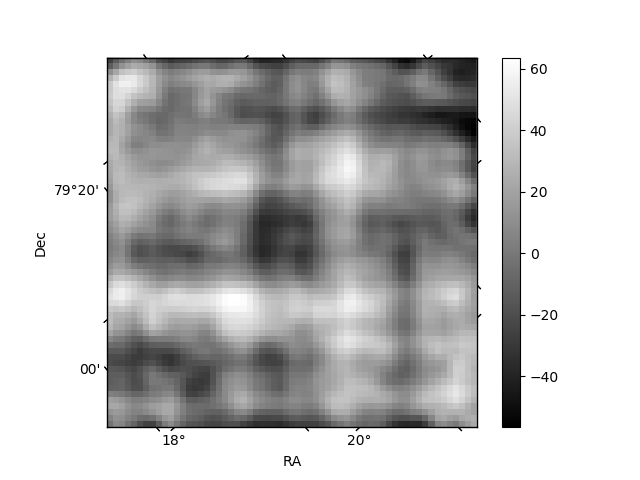
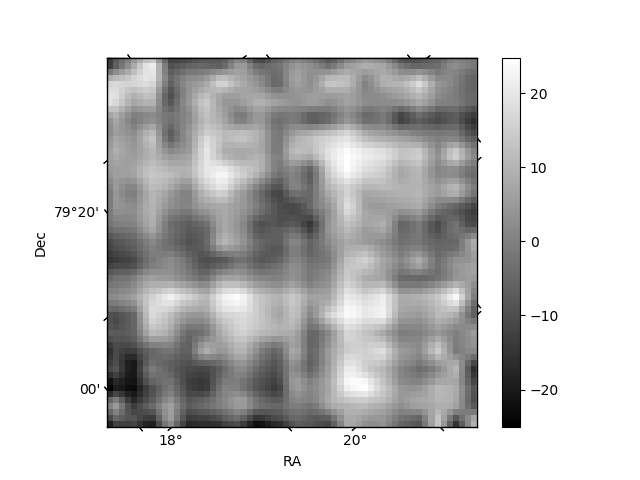
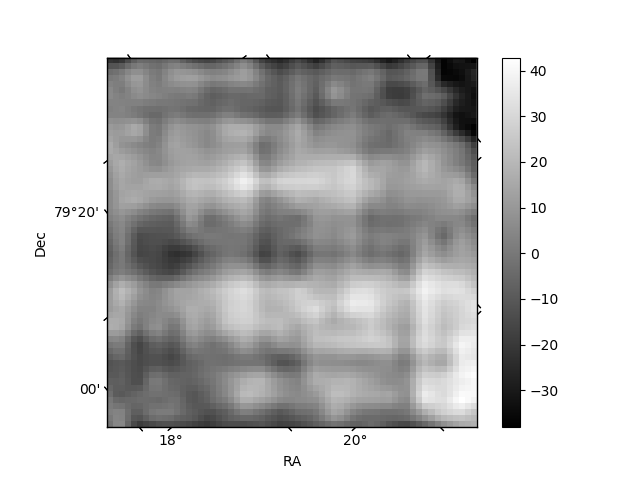
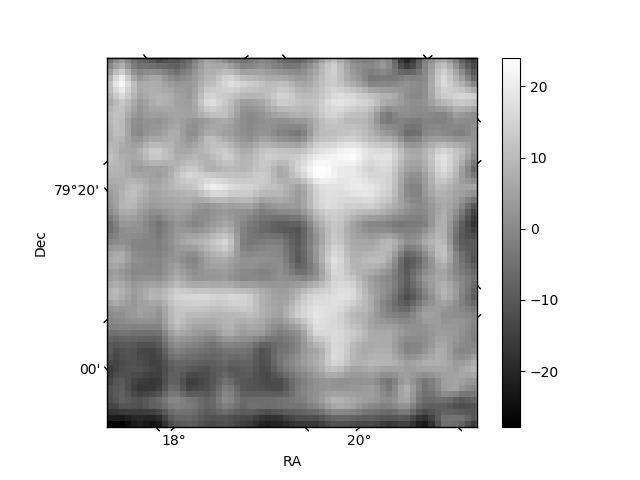
Histogram calculated using DETX and DETY for each event in the final _common_clean file
| Quadrant A | 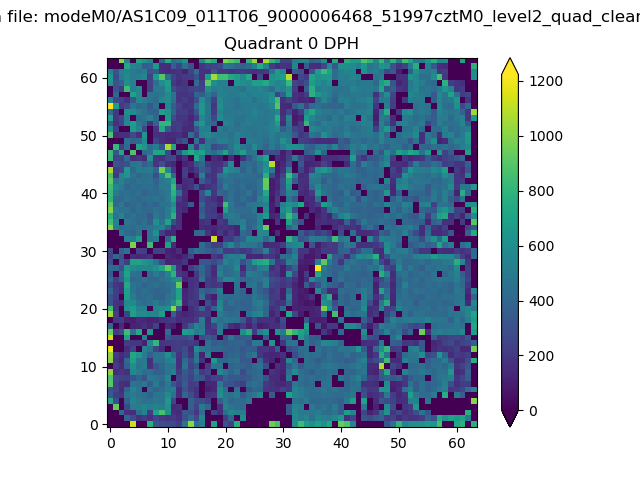 |
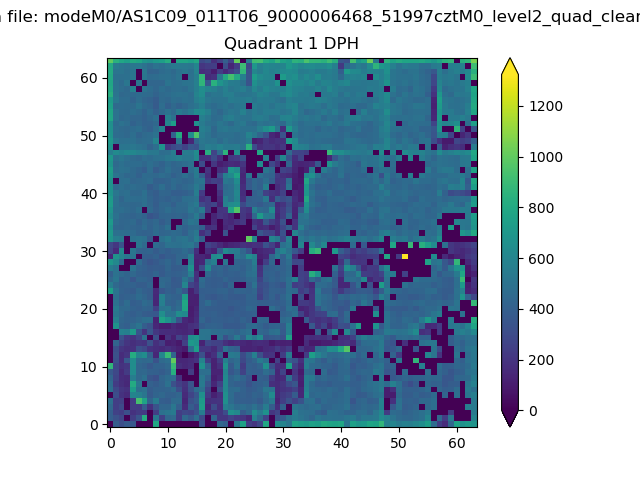 |
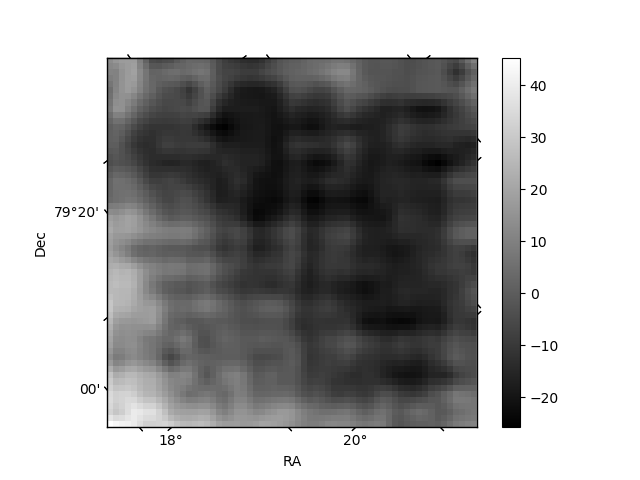
Quadrant B |
|---|---|---|---|
| Quadrant D | 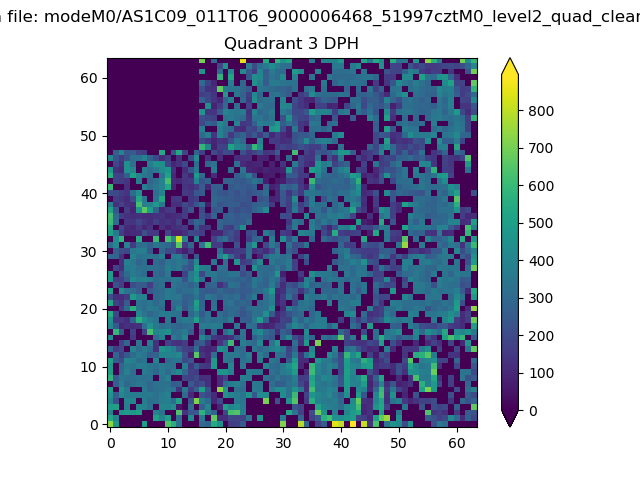 |
 |
Quadrant C |
| Plot type | Count rate plots | Images |
|---|---|---|
| Comparison with Poisson distribution Blue bars denote a histogram of data divided into 1 sec bins. Red curve is a Poisson curve with rate = median count rate of data. |
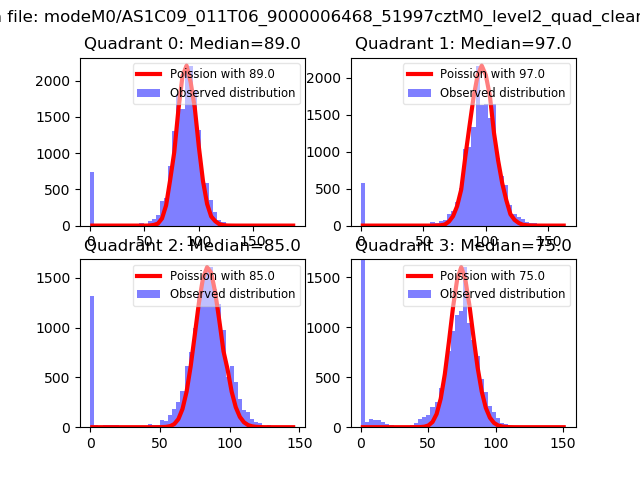 |
 |
| Quadrant-wise count rates Data is divided into 100 sec bins |
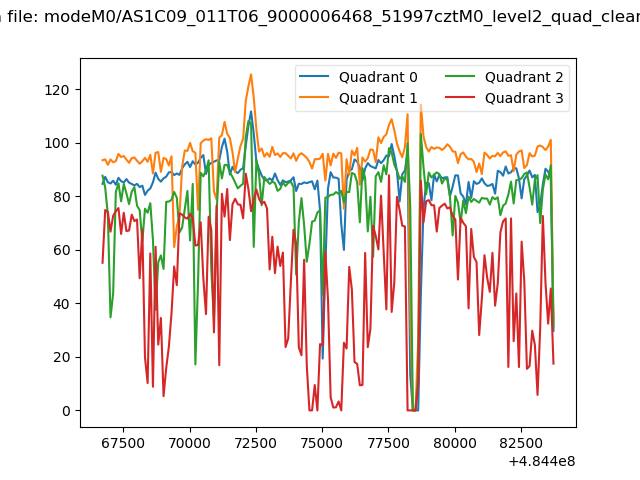 |
|
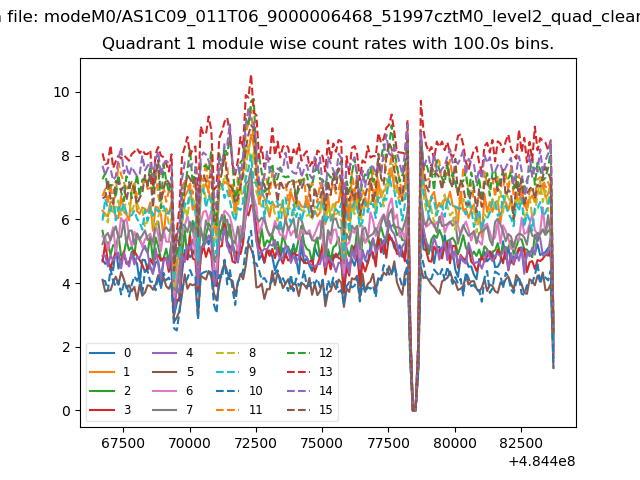
| Module-wise count rates for Quadrant A Data is divided into 100 sec bins |
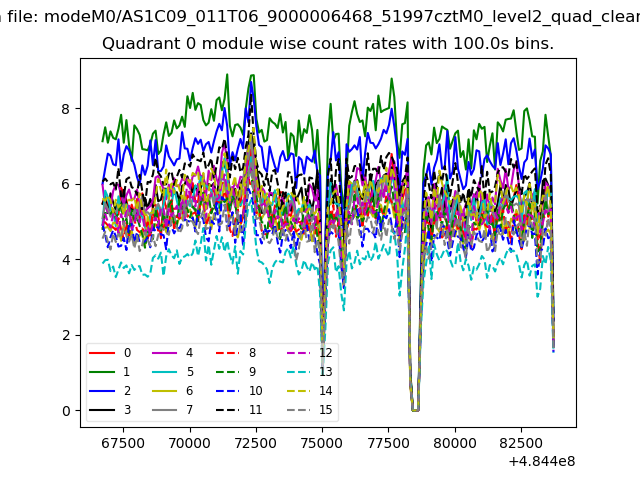 |
 |
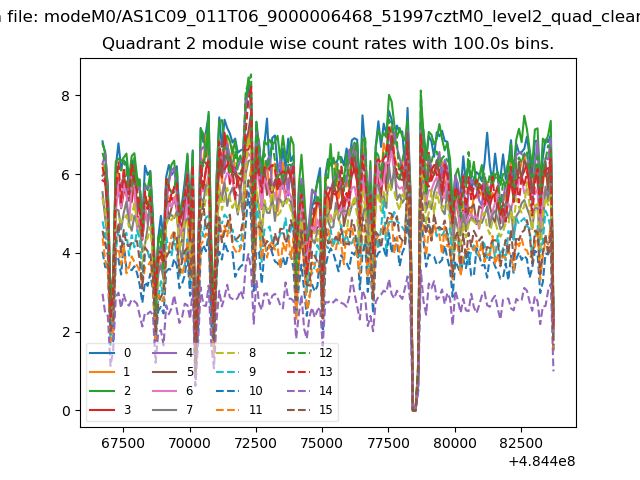
| Module-wise count rates for Quadrant B Data is divided into 100 sec bins |
 |
 |
| Module-wise count rates for Quadrant C Data is divided into 100 sec bins |
 |
 |
| Module-wise count rates for Quadrant D Data is divided into 100 sec bins |
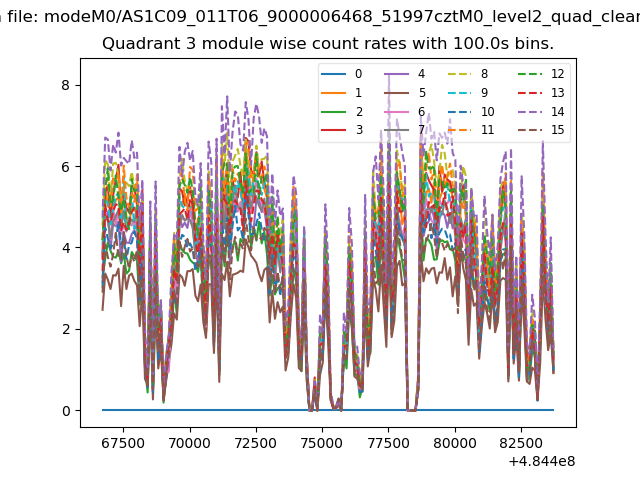 |
 |
| Parameter | Plot |
|---|---|
| CZT HV Monitor | 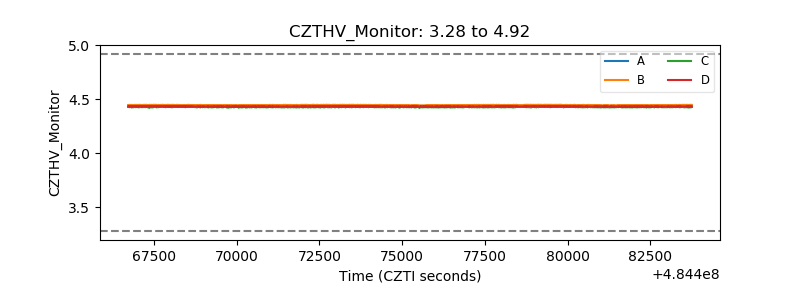 |
| D_VDD | 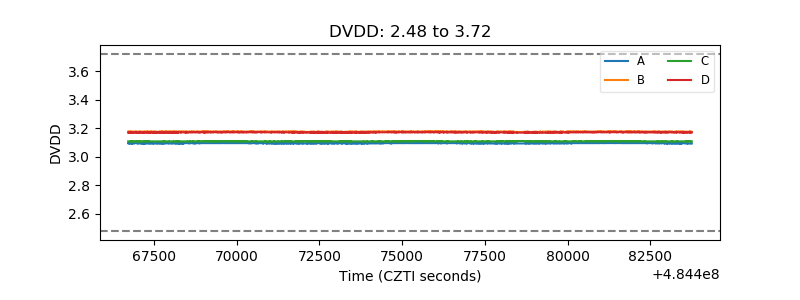 |
| Temperature 1 | 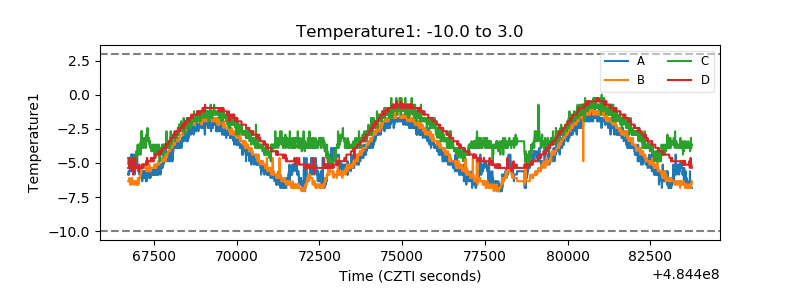 |
| Veto HV Monitor | 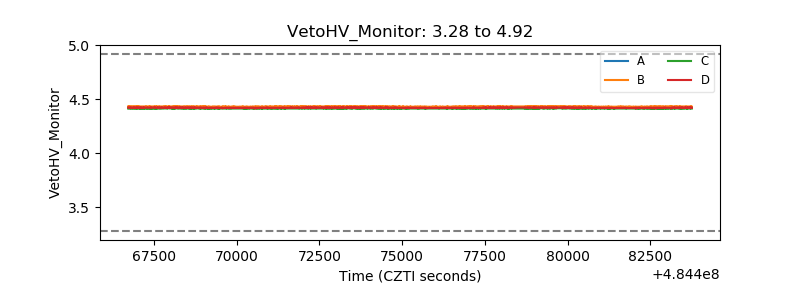 |
| Veto LLD | 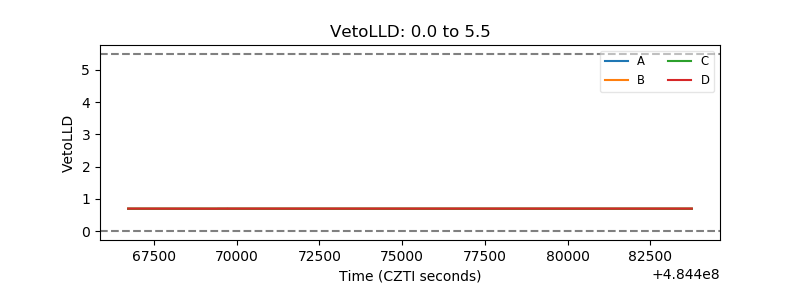 |
| Alpha Counter | 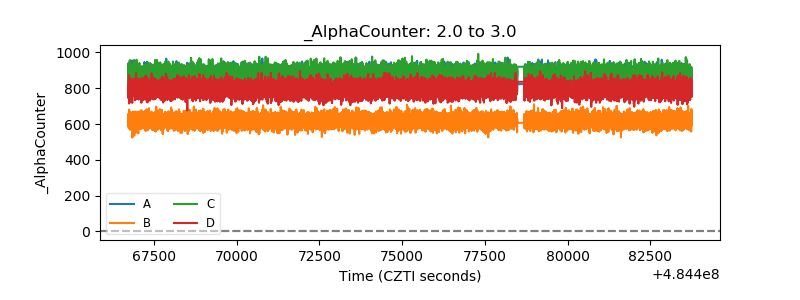 |
| _CPM_Rate | 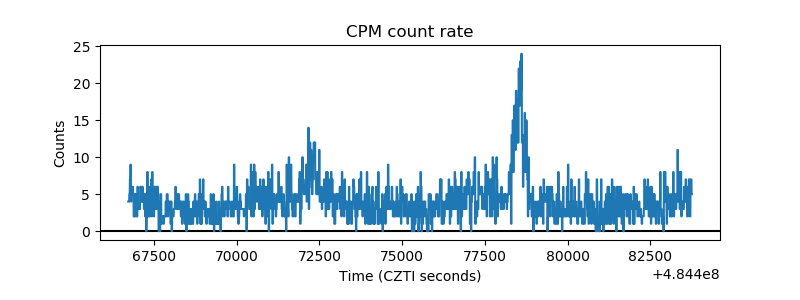 |
| CZT Counter | 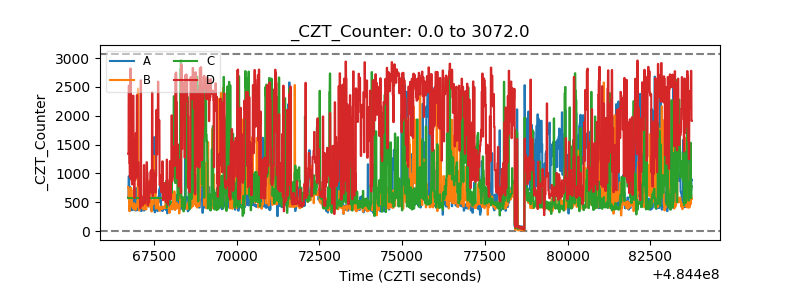 |
| +2.5 Volts monitor | 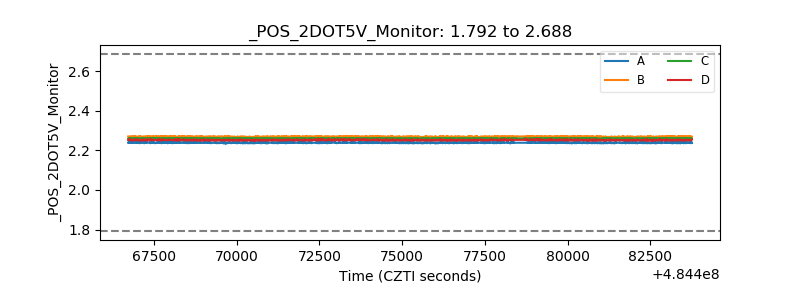 |
| +5 Volts monitor | 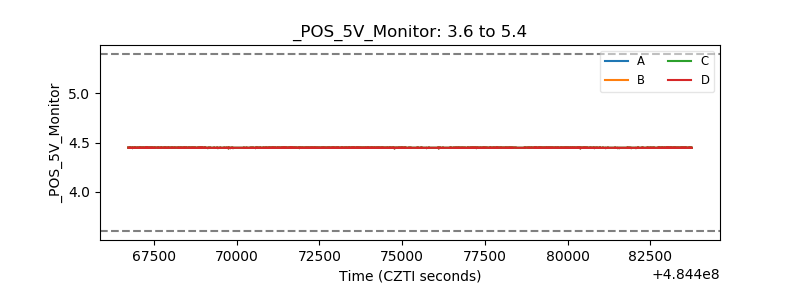 |
| _ROLL_ROT | 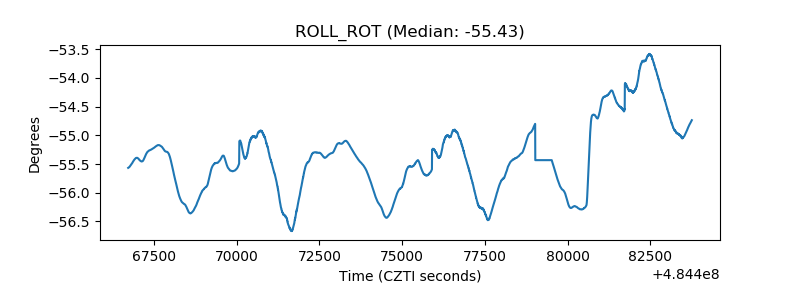 |
| _Roll_DEC | 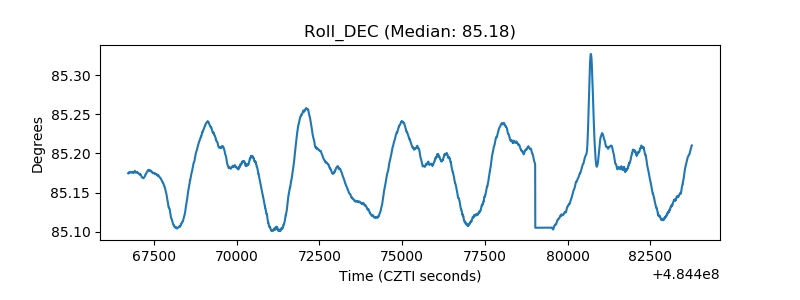 |
| _Roll_RA | 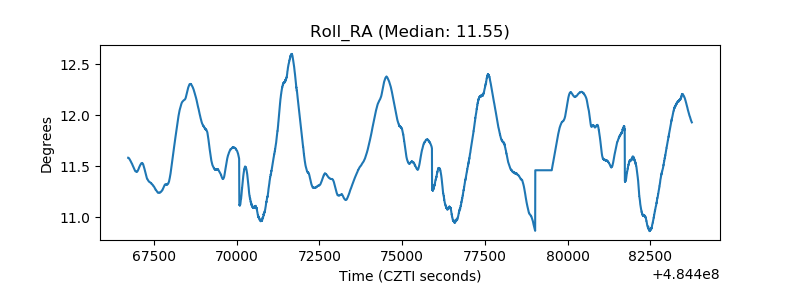 |
| Veto Counter | 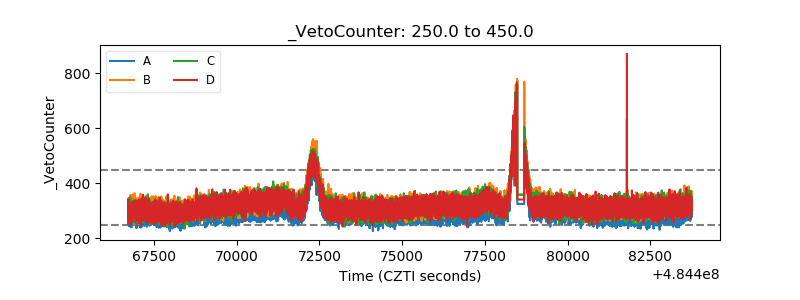 |