| Param | Original file | Final file |
|---|---|---|
| Filename | modeM0/AS1C09_011T06_9000006468_51998cztM0_level2.fits | modeM0/AS1C09_011T06_9000006468_51998cztM0_level2_quad_clean.evt |
| Size (bytes) | 1,094,984,640 | 105,289,920 |
| Size | 1.0 GB | 100.4 MB |
| Events in quadrant A | 13,102,002 | 510,345 |
| Events in quadrant B | 5,770,788 | 827,749 |
| Events in quadrant C | 7,456,646 | 713,038 |
| Events in quadrant D | 13,532,001 | 532,315 |
| Mode M0 | |||
|---|---|---|---|
| Quadrant | BADHDUFLAG | Total packets | Discarded packets |
| A | 0 | 44926 | 2 |
| B | 0 | 23003 | 2 |
| C | 0 | 28126 | 2 |
| D | 0 | 46309 | 2 |
| Mode M9 | |||
|---|---|---|---|
| Quadrant | BADHDUFLAG | Total packets | Discarded packets |
| A | 0 | 13 | 0 |
| B | 0 | 13 | 0 |
| C | 0 | 13 | 0 |
| D | 0 | 13 | 0 |
| Mode SS | |||
|---|---|---|---|
| Quadrant | BADHDUFLAG | Total packets | Discarded packets |
| A | 0 | 178 | 0 |
| B | 0 | 178 | 0 |
| C | 0 | 178 | 0 |
| D | 0 | 178 | 0 |
| Quadrant | Total seconds | Saturated seconds | Saturation percentage |
|---|---|---|---|
| A | 8697 | 3552 | 40.841670% |
| B | 8697 | 490 | 5.634127% |
| C | 8698 | 872 | 10.025293% |
| D | 8698 | 2737 | 31.467004% |
Noise dominated data is calculated using 1-second bins in cleaned event files. If a bin has >2000 counts, and if more than 50% of those come from <1% of pixels, then it is considered to be noise-dominated and hence unusable.
| Quadrant | # 1 sec bins | Bins with >0 counts | Bins with >2000 counts | High rate bins dominated by noise | Noise dominated (total time) | Noise dominated (detector-on time) | Marked lightcurve |
|---|---|---|---|---|---|---|---|
| A | 10027 | 8697 | 3137 | 3137 | 31.29% | 36.07% | 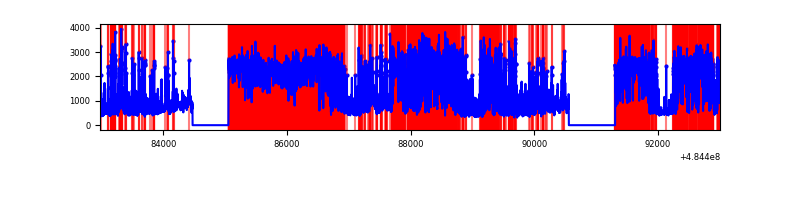 |
| B | 10027 | 8698 | 295 | 295 | 2.94% | 3.39% | 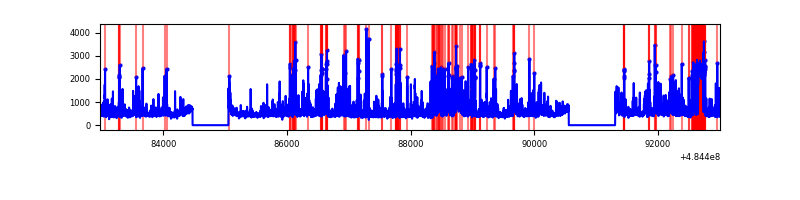 |
| C | 10028 | 8699 | 705 | 705 | 7.03% | 8.10% | 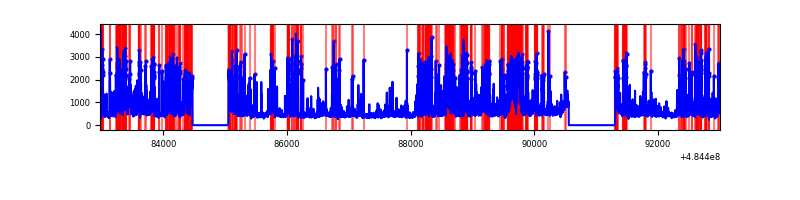 |
| D | 10028 | 8698 | 2675 | 2675 | 26.68% | 30.75% | 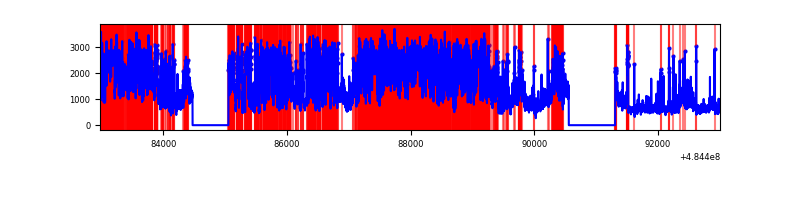 |
Top three noisy pixels from each quadrant. If the there are fewer than three noisy pixels in the level2.evt file, extra rows are filled as -1
| Pixel properties | Quadrant properties | ||||||
|---|---|---|---|---|---|---|---|
| Quadrant | DetID | PixID | Counts | Sigma | Mean | Median | Sigma |
| A | 7 | 64 | 4269514 | 21339.71 | 782 | 760 | 200.0 |
| A | 4 | 95 | 3964688 | 19815.87 | 782 | 760 | 200.0 |
| A | 12 | 2 | 389800 | 1944.83 | 782 | 760 | 200.0 |
| B | 4 | 206 | 785835 | 4121.42 | 900 | 867 | 190.5 |
| B | 10 | 128 | 309264 | 1619.22 | 900 | 867 | 190.5 |
| B | 10 | 247 | 266753 | 1396.02 | 900 | 867 | 190.5 |
| C | 15 | 224 | 2693635 | 11361.05 | 869 | 861 | 237.0 |
| C | 9 | 38 | 260541 | 1095.61 | 869 | 861 | 237.0 |
| C | 14 | 254 | 218288 | 917.34 | 869 | 861 | 237.0 |
| D | 6 | 42 | 4507654 | 19911.55 | 795 | 759 | 226.3 |
| D | 12 | 17 | 1508376 | 6660.68 | 795 | 759 | 226.3 |
| D | 6 | 43 | 1039404 | 4588.75 | 795 | 759 | 226.3 |
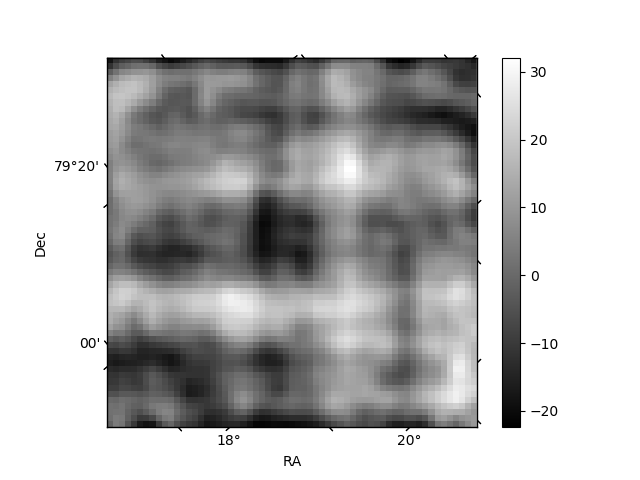
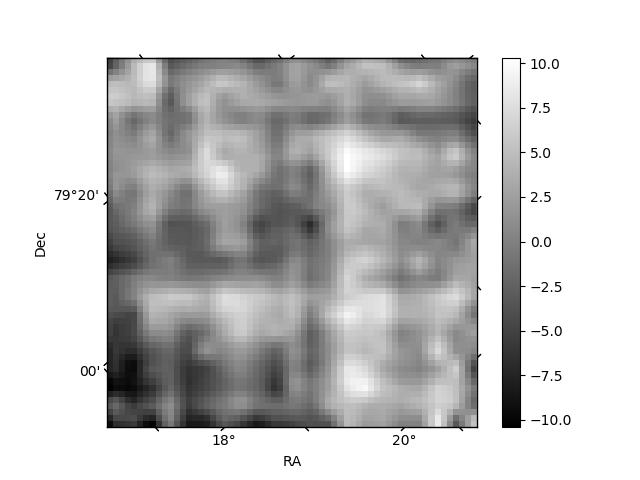
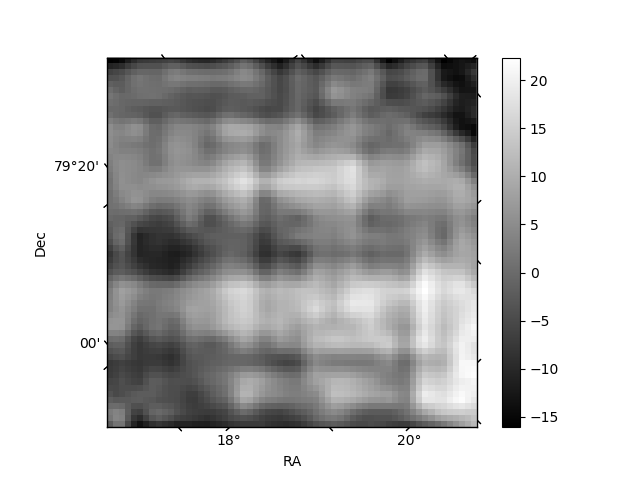
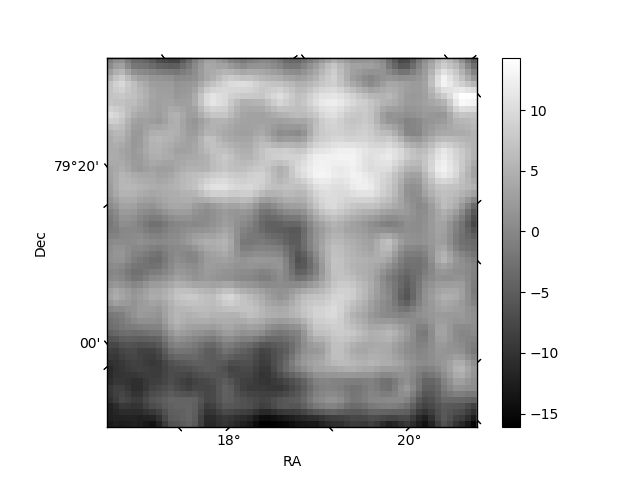
Histogram calculated using DETX and DETY for each event in the final _common_clean file
| Quadrant A | 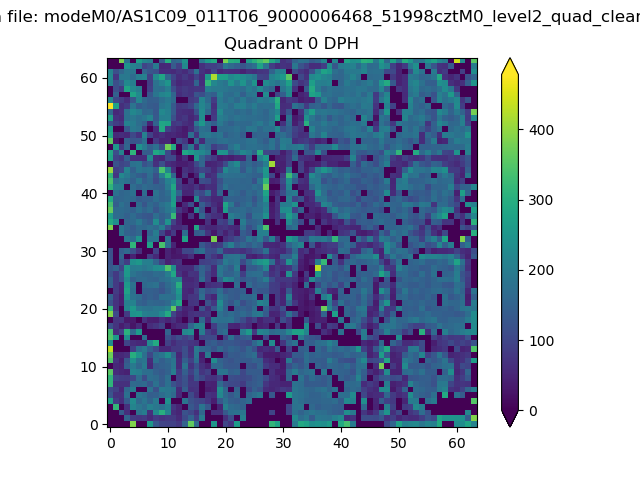 |
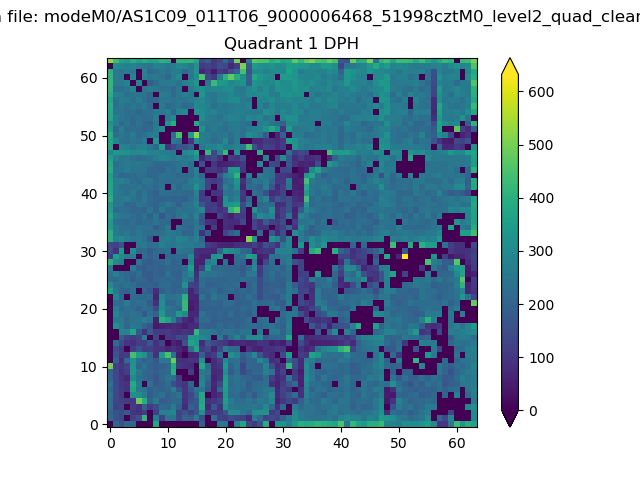 |
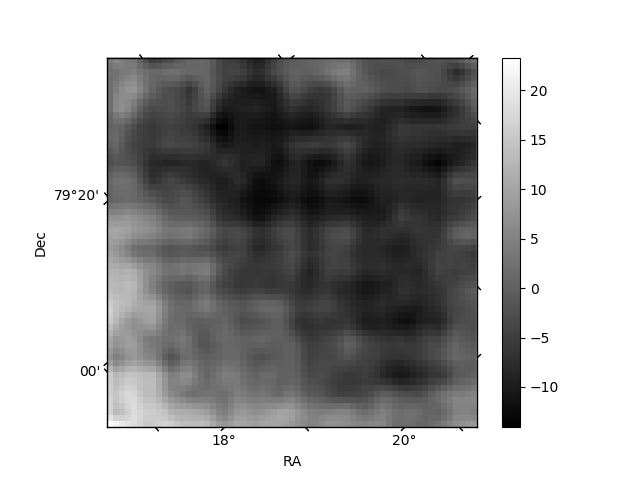
Quadrant B |
|---|---|---|---|
| Quadrant D | 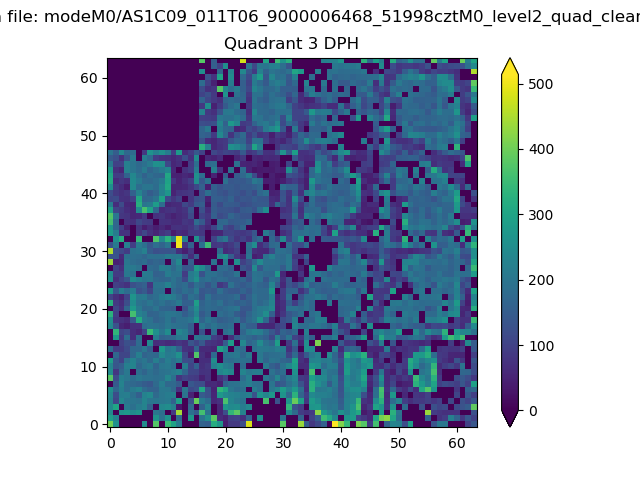 |
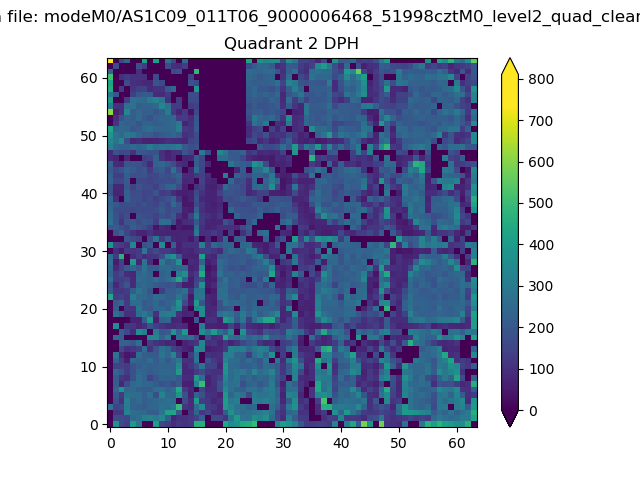 |
Quadrant C |
| Plot type | Count rate plots | Images |
|---|---|---|
| Comparison with Poisson distribution Blue bars denote a histogram of data divided into 1 sec bins. Red curve is a Poisson curve with rate = median count rate of data. |
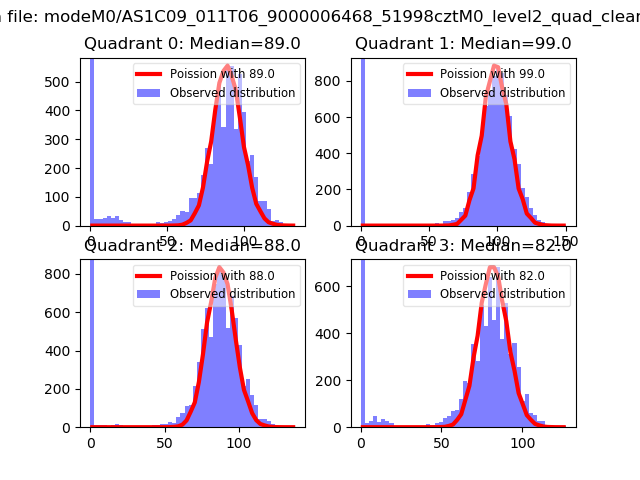 |
 |
| Quadrant-wise count rates Data is divided into 100 sec bins |
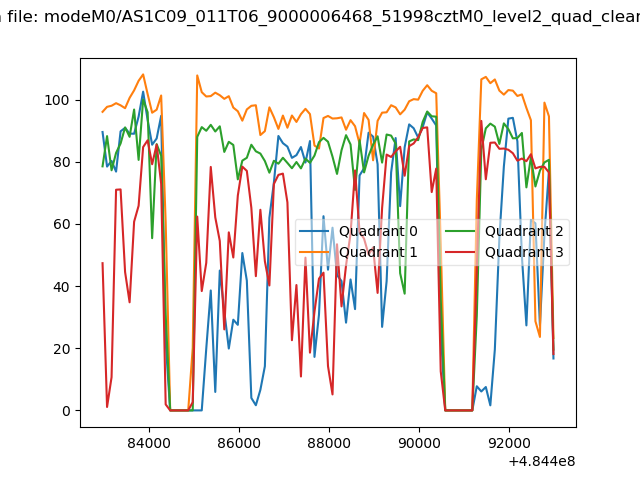 |
|
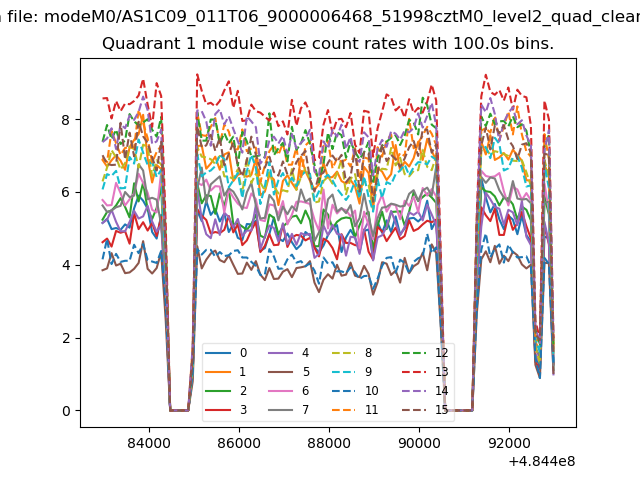
| Module-wise count rates for Quadrant A Data is divided into 100 sec bins |
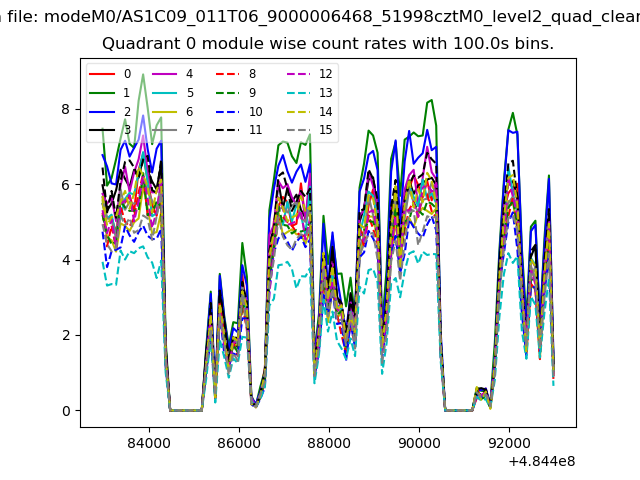 |
 |
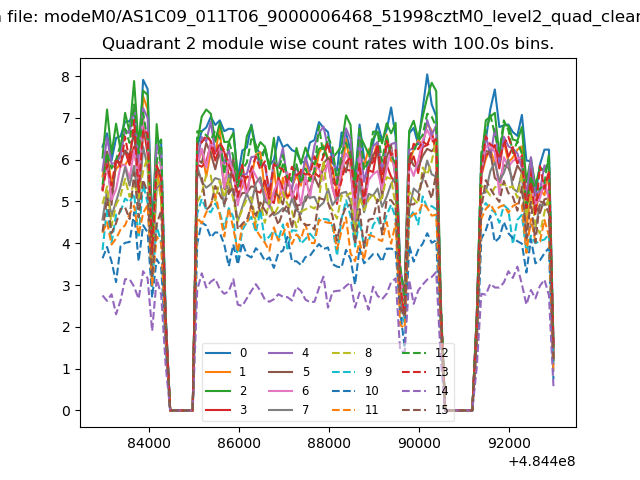
| Module-wise count rates for Quadrant B Data is divided into 100 sec bins |
 |
 |
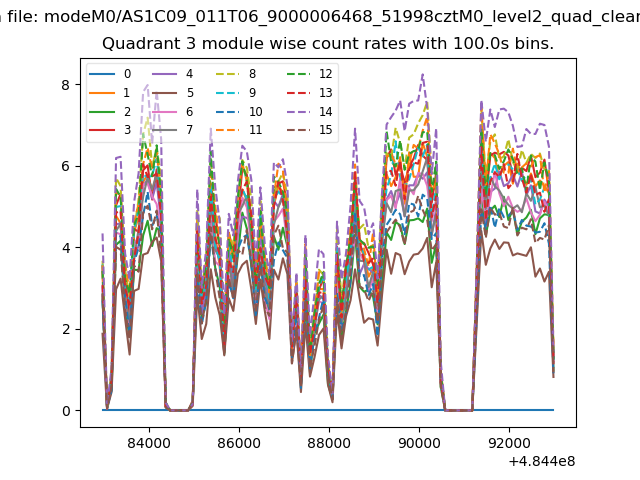
| Module-wise count rates for Quadrant C Data is divided into 100 sec bins |
 |
 |
| Module-wise count rates for Quadrant D Data is divided into 100 sec bins |
 |
 |
| Parameter | Plot |
|---|---|
| CZT HV Monitor | 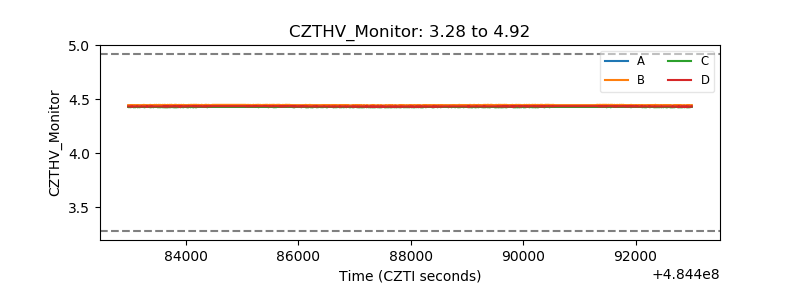 |
| D_VDD | 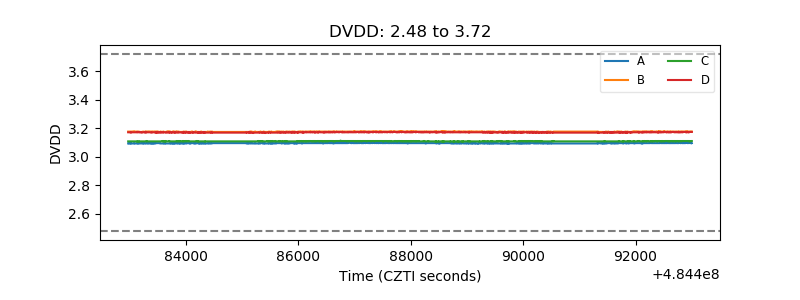 |
| Temperature 1 | 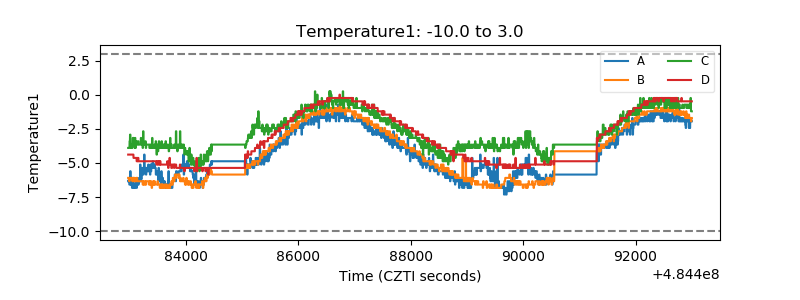 |
| Veto HV Monitor | 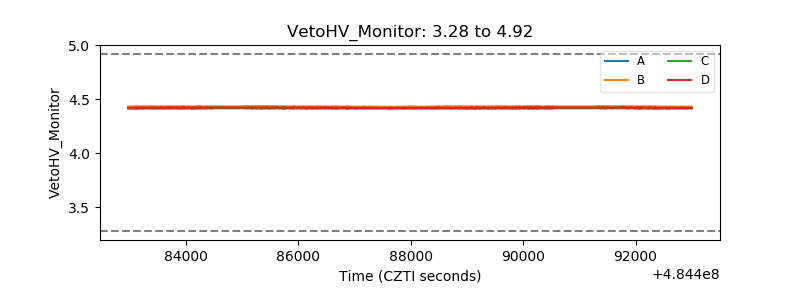 |
| Veto LLD | 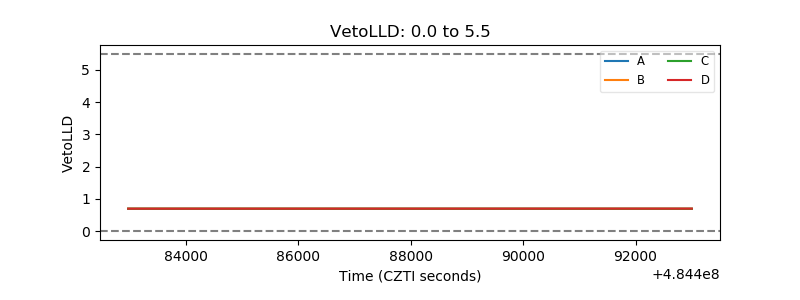 |
| Alpha Counter | 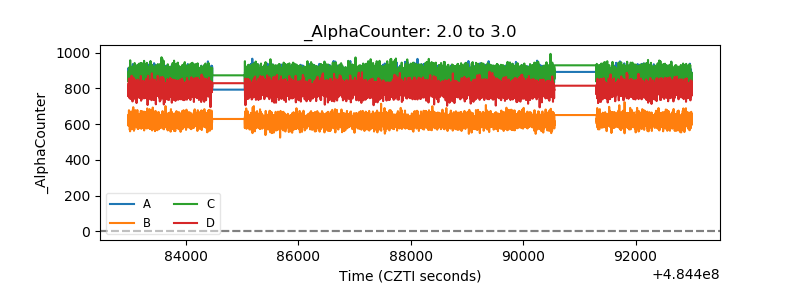 |
| _CPM_Rate | 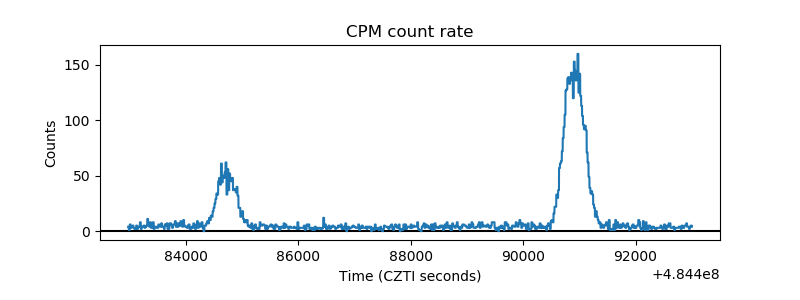 |
| CZT Counter | 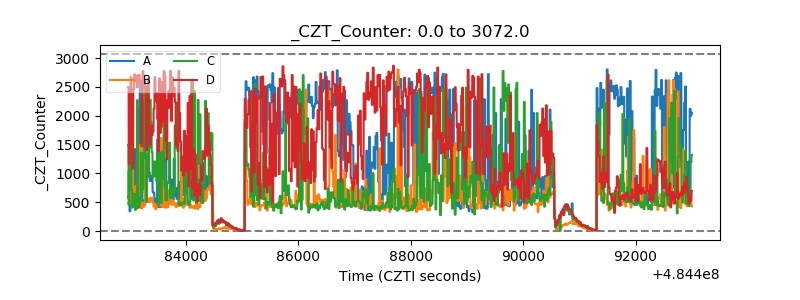 |
| +2.5 Volts monitor | 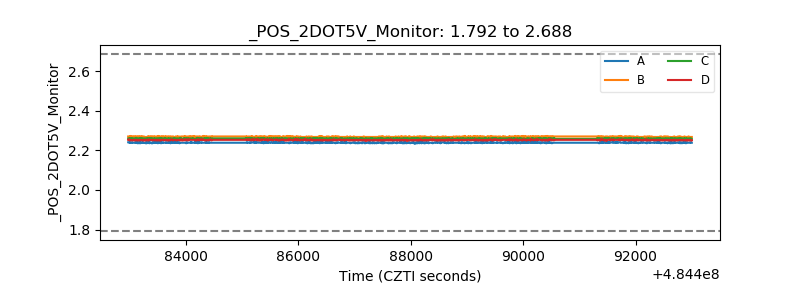 |
| +5 Volts monitor | 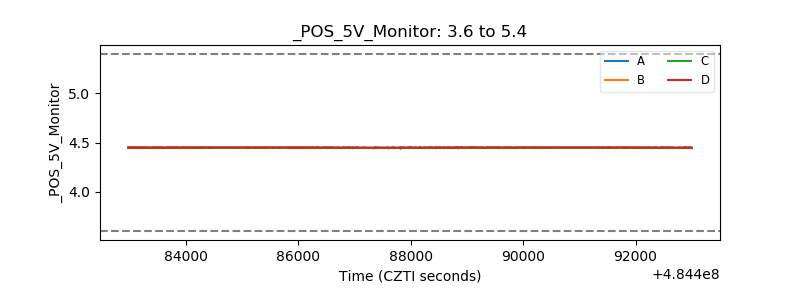 |
| _ROLL_ROT | 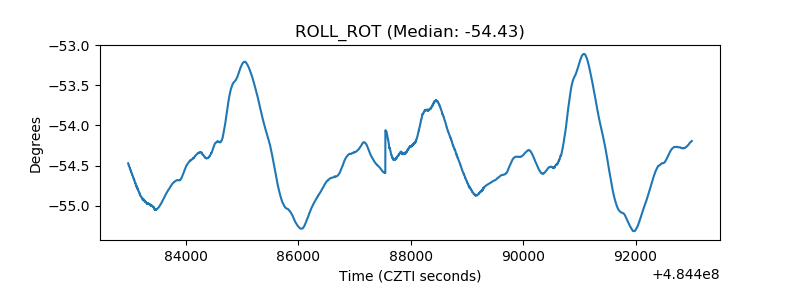 |
| _Roll_DEC | 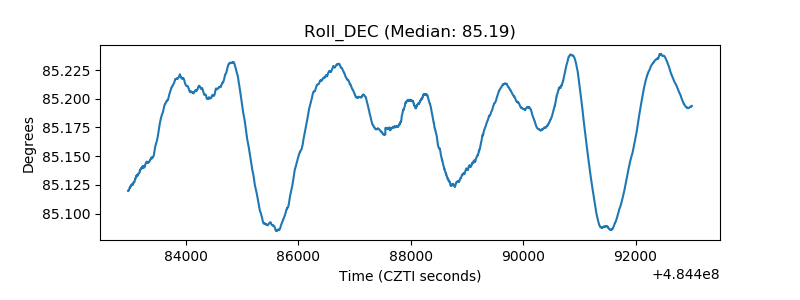 |
| _Roll_RA | 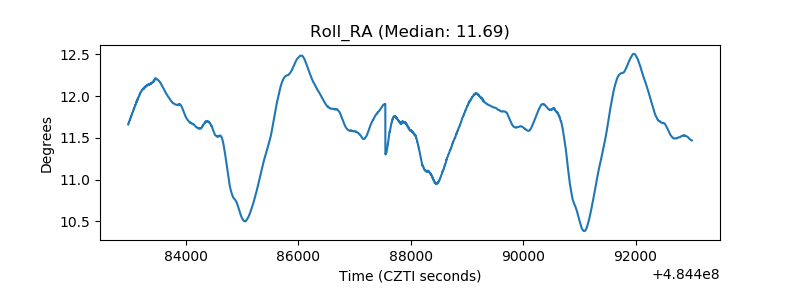 |
| Veto Counter | 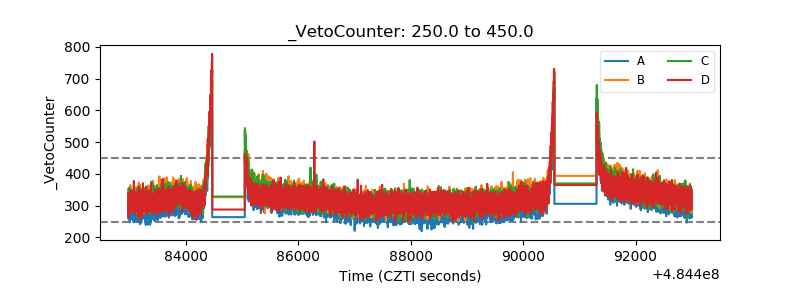 |