| Param | Original file | Final file |
|---|---|---|
| Filename | modeM0/AS1C09_011T06_9000006468_51999cztM0_level2.fits | modeM0/AS1C09_011T06_9000006468_51999cztM0_level2_quad_clean.evt |
| Size (bytes) | 696,792,960 | 75,856,320 |
| Size | 664.5 MB | 72.3 MB |
| Events in quadrant A | 9,388,664 | 357,532 |
| Events in quadrant B | 4,322,983 | 572,575 |
| Events in quadrant C | 4,614,314 | 507,678 |
| Events in quadrant D | 7,003,941 | 440,072 |
| Mode M0 | |||
|---|---|---|---|
| Quadrant | BADHDUFLAG | Total packets | Discarded packets |
| A | 0 | 31997 | 1 |
| B | 0 | 16961 | 1 |
| C | 0 | 17775 | 2 |
| D | 0 | 24948 | 1 |
| Mode M9 | |||
|---|---|---|---|
| Quadrant | BADHDUFLAG | Total packets | Discarded packets |
| A | 0 | 9 | 0 |
| B | 0 | 9 | 0 |
| C | 0 | 9 | 0 |
| D | 0 | 9 | 0 |
| Mode SS | |||
|---|---|---|---|
| Quadrant | BADHDUFLAG | Total packets | Discarded packets |
| A | 0 | 124 | 0 |
| B | 0 | 124 | 0 |
| C | 0 | 124 | 0 |
| D | 0 | 124 | 0 |
| Quadrant | Total seconds | Saturated seconds | Saturation percentage |
|---|---|---|---|
| A | 5984 | 2498 | 41.744652% |
| B | 5985 | 411 | 6.867168% |
| C | 5984 | 474 | 7.921123% |
| D | 5984 | 986 | 16.477273% |
Noise dominated data is calculated using 1-second bins in cleaned event files. If a bin has >2000 counts, and if more than 50% of those come from <1% of pixels, then it is considered to be noise-dominated and hence unusable.
| Quadrant | # 1 sec bins | Bins with >0 counts | Bins with >2000 counts | High rate bins dominated by noise | Noise dominated (total time) | Noise dominated (detector-on time) | Marked lightcurve |
|---|---|---|---|---|---|---|---|
| A | 6924 | 5984 | 2229 | 2229 | 32.19% | 37.25% |  |
| B | 6925 | 5985 | 275 | 275 | 3.97% | 4.59% |  |
| C | 6924 | 5984 | 400 | 400 | 5.78% | 6.68% | 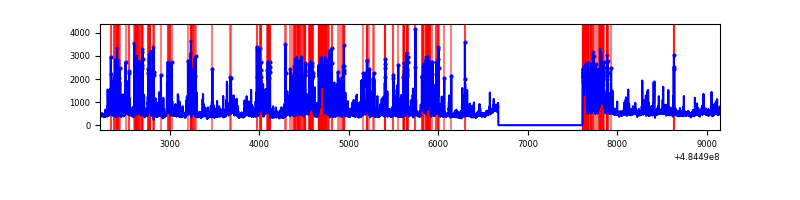 |
| D | 6924 | 5984 | 922 | 922 | 13.32% | 15.41% |  |
Top three noisy pixels from each quadrant. If the there are fewer than three noisy pixels in the level2.evt file, extra rows are filled as -1
| Pixel properties | Quadrant properties | ||||||
|---|---|---|---|---|---|---|---|
| Quadrant | DetID | PixID | Counts | Sigma | Mean | Median | Sigma |
| A | 7 | 64 | 3679143 | 28265.54 | 516 | 502 | 130.1 |
| A | 12 | 2 | 1277342 | 9810.84 | 516 | 502 | 130.1 |
| A | 4 | 95 | 836244 | 6421.58 | 516 | 502 | 130.1 |
| B | 4 | 206 | 769834 | 6041.22 | 601 | 582 | 127.3 |
| B | 10 | 128 | 181682 | 1422.25 | 601 | 582 | 127.3 |
| B | 4 | 171 | 151265 | 1183.37 | 601 | 582 | 127.3 |
| C | 15 | 224 | 1262509 | 7687.28 | 593 | 587 | 164.2 |
| C | 0 | 176 | 263145 | 1599.43 | 593 | 587 | 164.2 |
| C | 9 | 38 | 157648 | 956.77 | 593 | 587 | 164.2 |
| D | 6 | 42 | 904860 | 5549.29 | 567 | 539 | 163.0 |
| D | 12 | 17 | 868234 | 5324.54 | 567 | 539 | 163.0 |
| D | 6 | 43 | 655435 | 4018.71 | 567 | 539 | 163.0 |
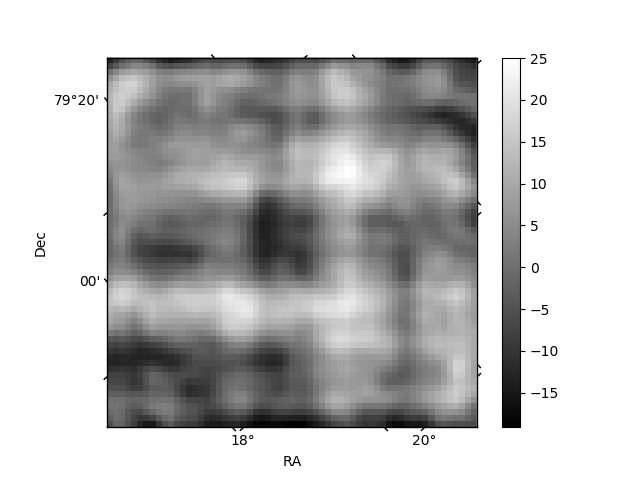
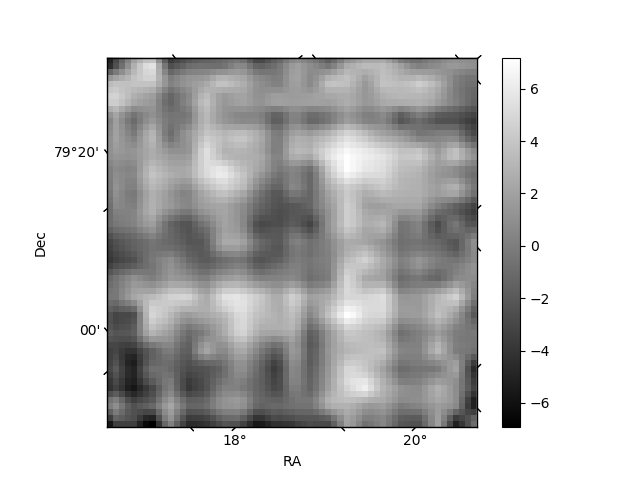
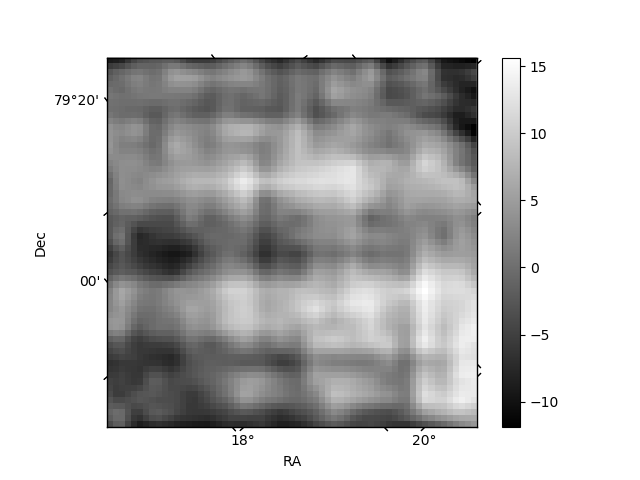
Histogram calculated using DETX and DETY for each event in the final _common_clean file
| Quadrant A | 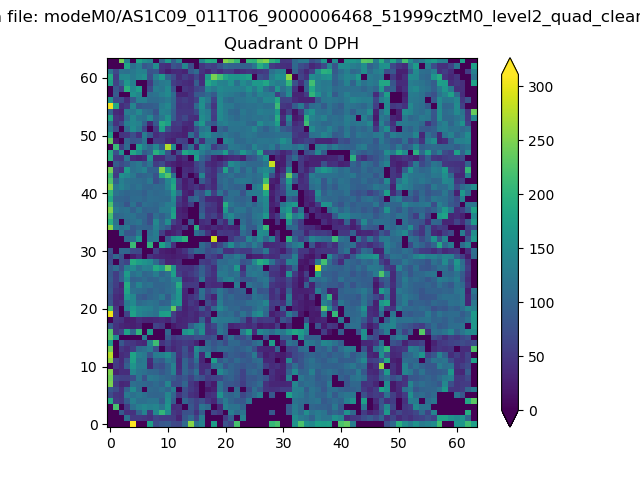 |
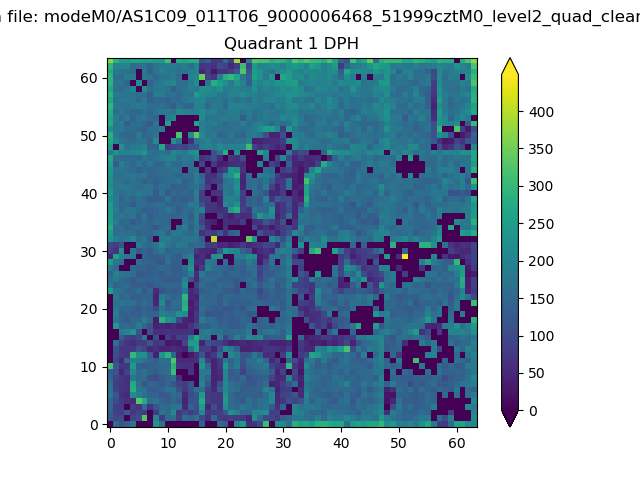 |
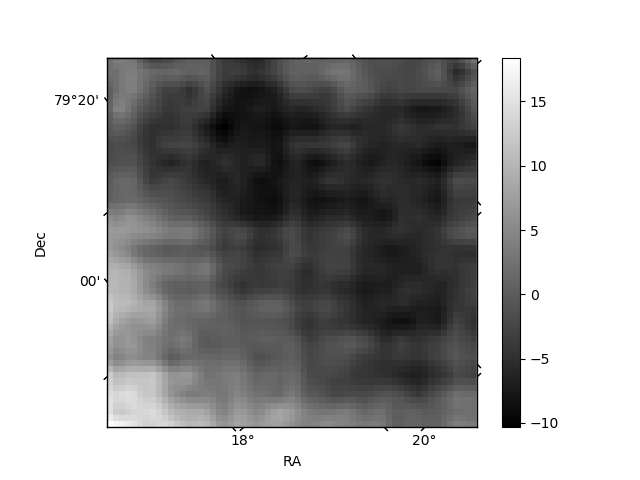
Quadrant B |
|---|---|---|---|
| Quadrant D |  |
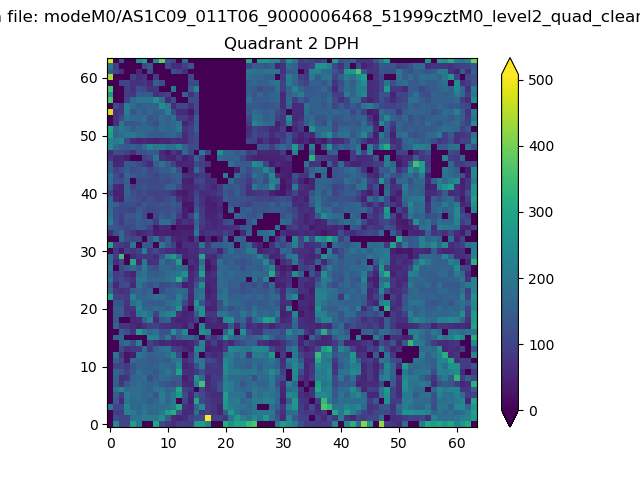 |
Quadrant C |
| Plot type | Count rate plots | Images |
|---|---|---|
| Comparison with Poisson distribution Blue bars denote a histogram of data divided into 1 sec bins. Red curve is a Poisson curve with rate = median count rate of data. |
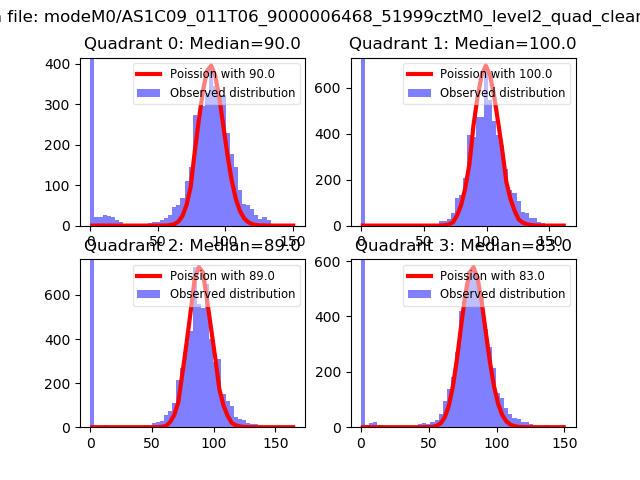 |
 |
| Quadrant-wise count rates Data is divided into 100 sec bins |
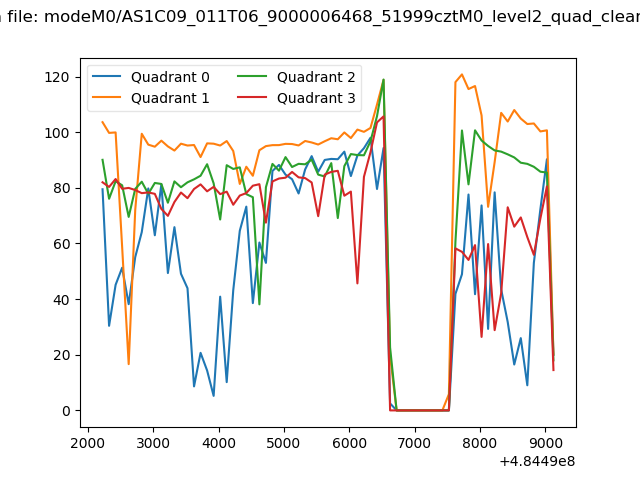 |
|
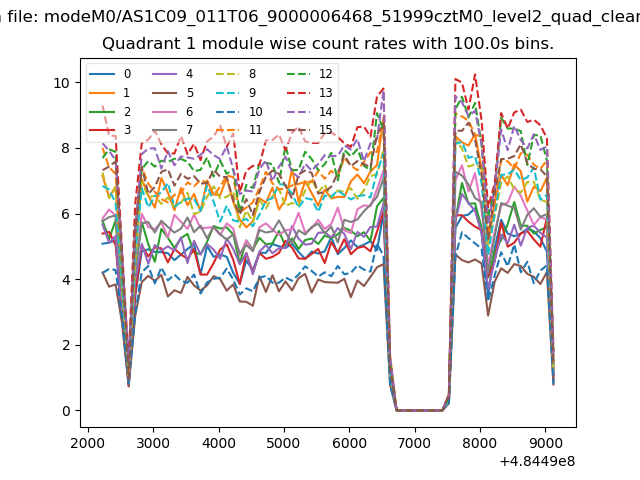
| Module-wise count rates for Quadrant A Data is divided into 100 sec bins |
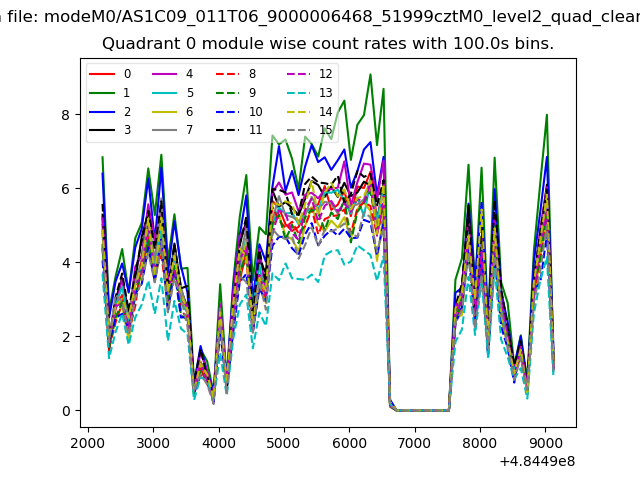 |
 |
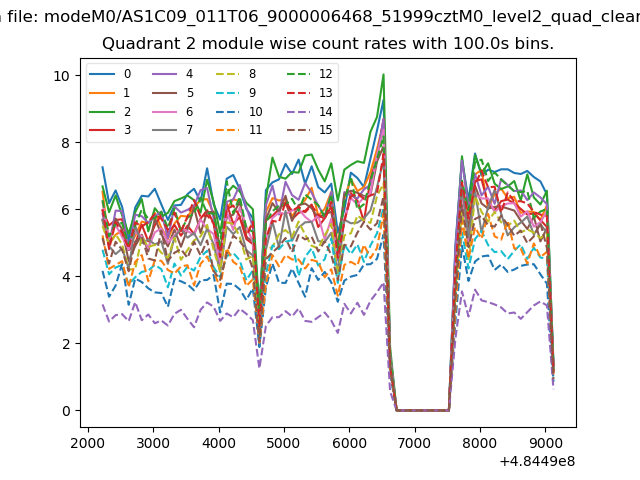
| Module-wise count rates for Quadrant B Data is divided into 100 sec bins |
 |
 |
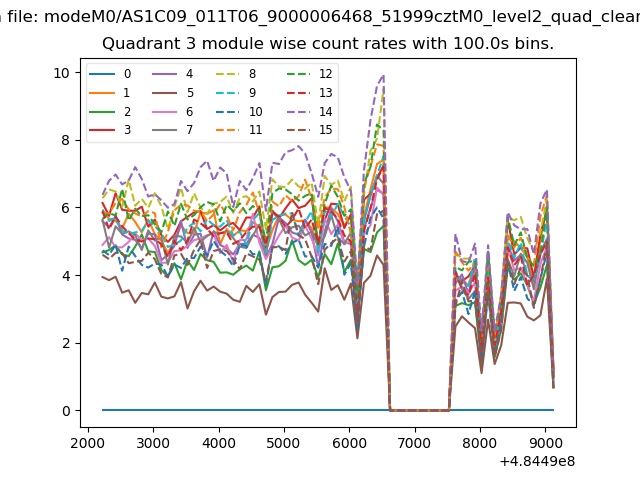
| Module-wise count rates for Quadrant C Data is divided into 100 sec bins |
 |
 |
| Module-wise count rates for Quadrant D Data is divided into 100 sec bins |
 |
 |
| Parameter | Plot |
|---|---|
| CZT HV Monitor | 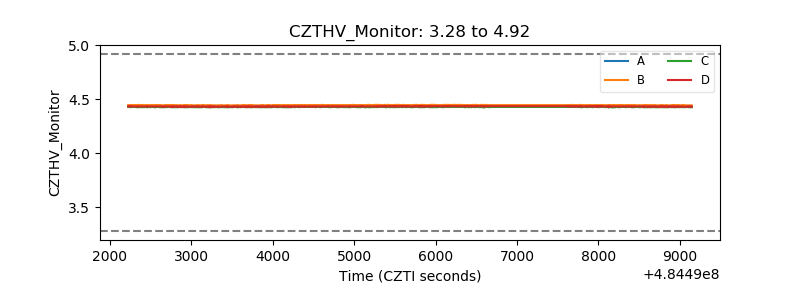 |
| D_VDD | 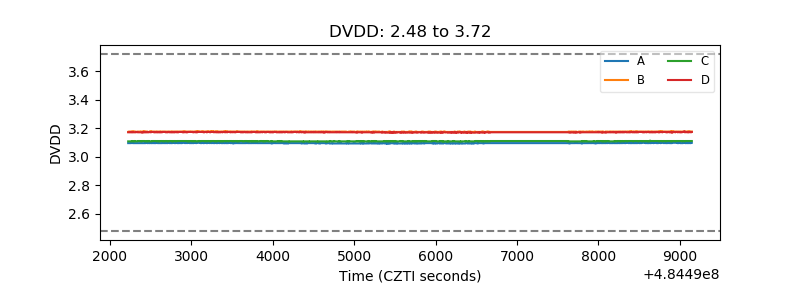 |
| Temperature 1 | 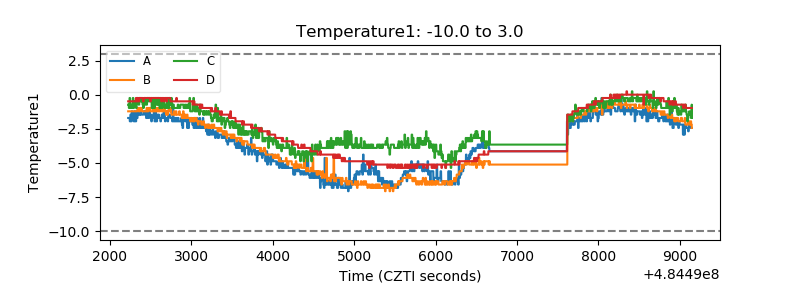 |
| Veto HV Monitor | 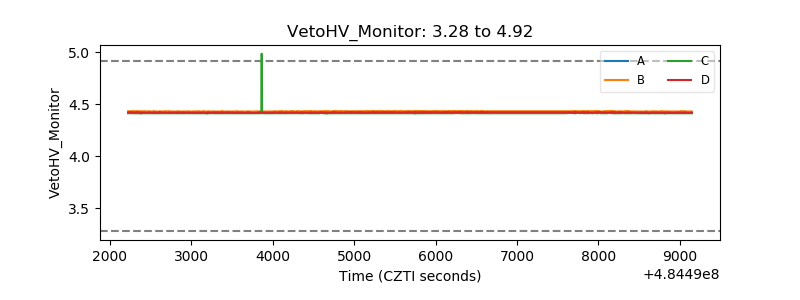 |
| Veto LLD | 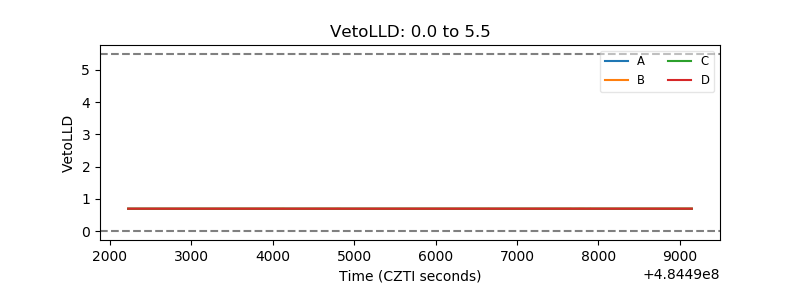 |
| Alpha Counter | 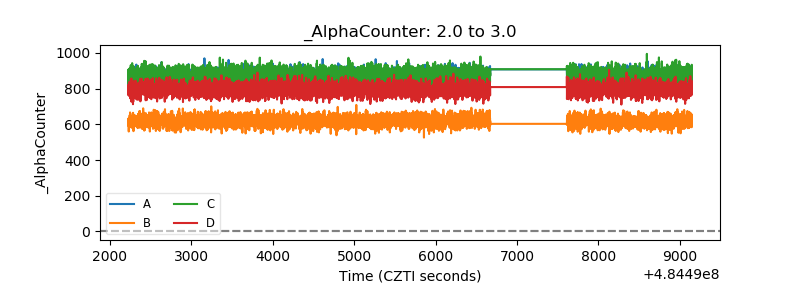 |
| _CPM_Rate | 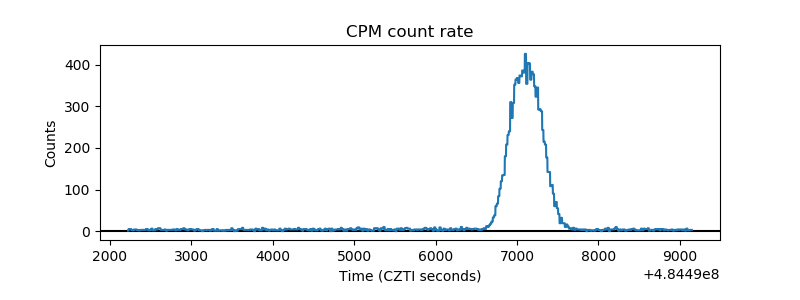 |
| CZT Counter | 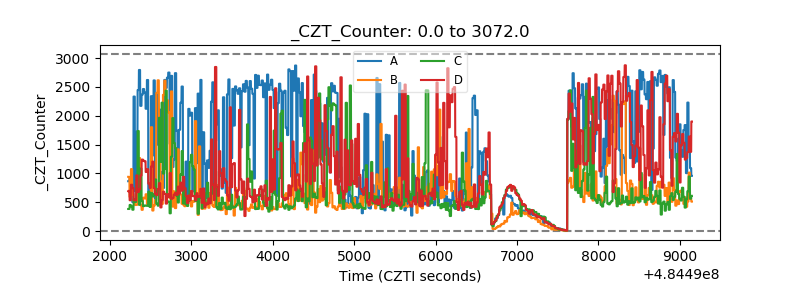 |
| +2.5 Volts monitor | 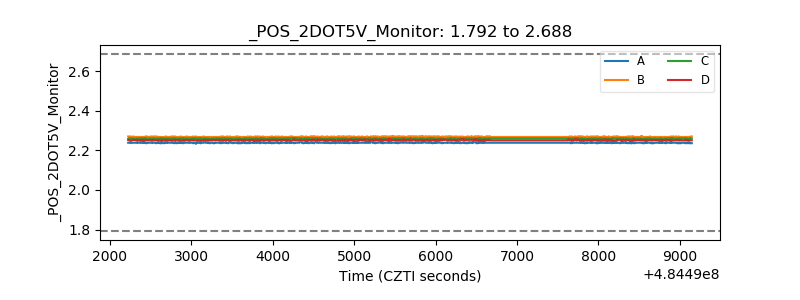 |
| +5 Volts monitor | 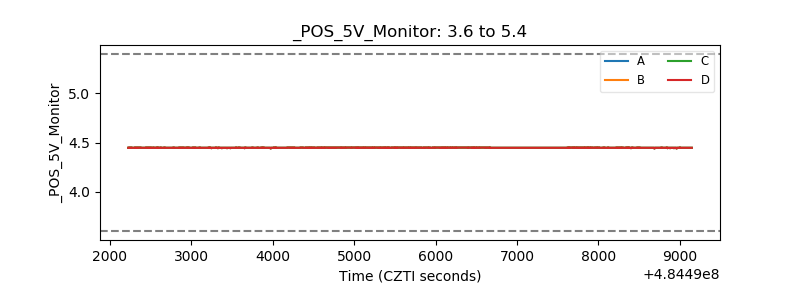 |
| _ROLL_ROT | 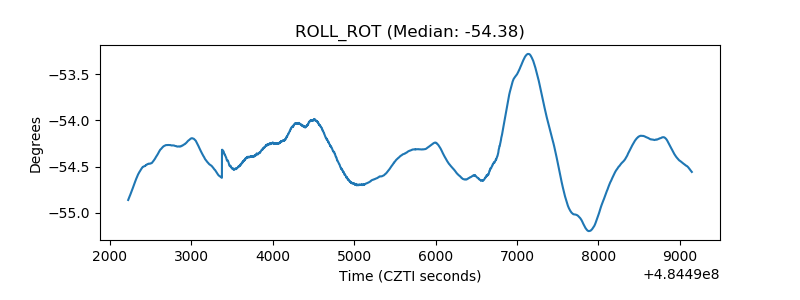 |
| _Roll_DEC | 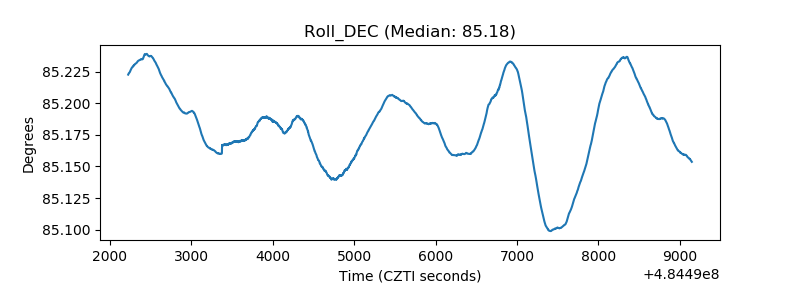 |
| _Roll_RA | 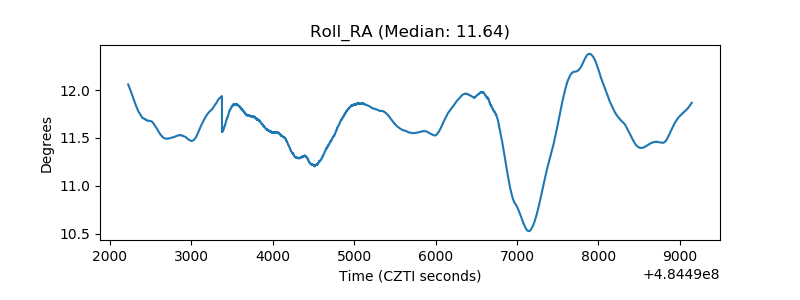 |
| Veto Counter | 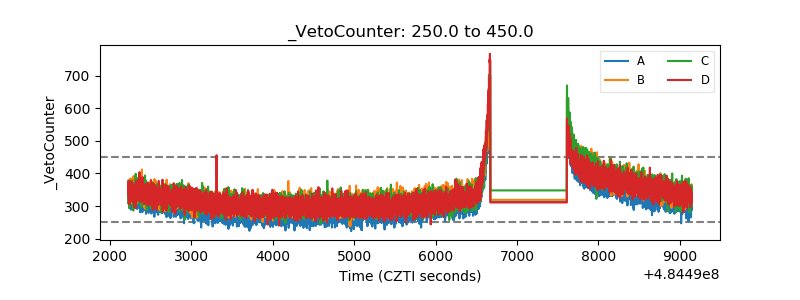 |