| Param | Original file | Final file |
|---|---|---|
| Filename | modeM0/AS1C09_011T06_9000006468_52001cztM0_level2.fits | modeM0/AS1C09_011T06_9000006468_52001cztM0_level2_quad_clean.evt |
| Size (bytes) | 710,150,400 | 74,344,320 |
| Size | 677.3 MB | 70.9 MB |
| Events in quadrant A | 6,717,282 | 460,612 |
| Events in quadrant B | 4,248,446 | 561,962 |
| Events in quadrant C | 5,241,524 | 486,083 |
| Events in quadrant D | 9,633,510 | 338,507 |
| Mode M0 | |||
|---|---|---|---|
| Quadrant | BADHDUFLAG | Total packets | Discarded packets |
| A | 0 | 23959 | 1 |
| B | 0 | 16553 | 1 |
| C | 0 | 19509 | 1 |
| D | 0 | 32653 | 1 |
| Mode M9 | |||
|---|---|---|---|
| Quadrant | BADHDUFLAG | Total packets | Discarded packets |
| A | 0 | 11 | 0 |
| B | 0 | 11 | 0 |
| C | 0 | 11 | 0 |
| D | 0 | 11 | 0 |
| Mode SS | |||
|---|---|---|---|
| Quadrant | BADHDUFLAG | Total packets | Discarded packets |
| A | 0 | 116 | 0 |
| B | 0 | 116 | 0 |
| C | 0 | 116 | 0 |
| D | 0 | 116 | 0 |
| Quadrant | Total seconds | Saturated seconds | Saturation percentage |
|---|---|---|---|
| A | 5776 | 1120 | 19.390582% |
| B | 5776 | 435 | 7.531163% |
| C | 5777 | 629 | 10.888004% |
| D | 5777 | 2055 | 35.572096% |
Noise dominated data is calculated using 1-second bins in cleaned event files. If a bin has >2000 counts, and if more than 50% of those come from <1% of pixels, then it is considered to be noise-dominated and hence unusable.
| Quadrant | # 1 sec bins | Bins with >0 counts | Bins with >2000 counts | High rate bins dominated by noise | Noise dominated (total time) | Noise dominated (detector-on time) | Marked lightcurve |
|---|---|---|---|---|---|---|---|
| A | 6856 | 5777 | 1026 | 1026 | 14.96% | 17.76% | 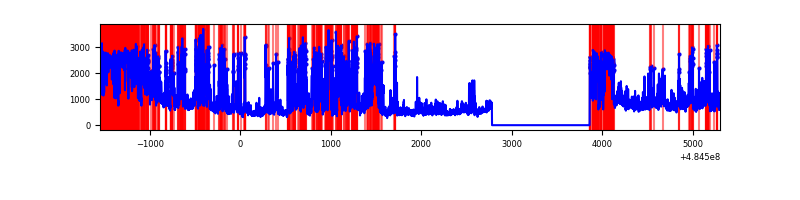 |
| B | 6856 | 5777 | 291 | 291 | 4.24% | 5.04% | 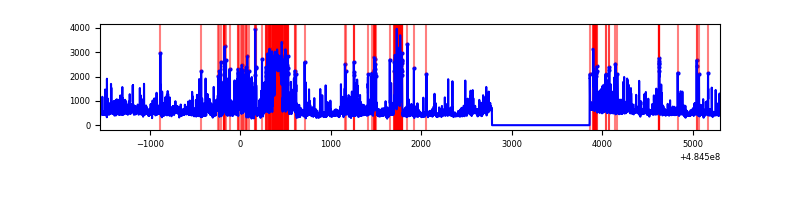 |
| C | 6857 | 5778 | 563 | 563 | 8.21% | 9.74% | 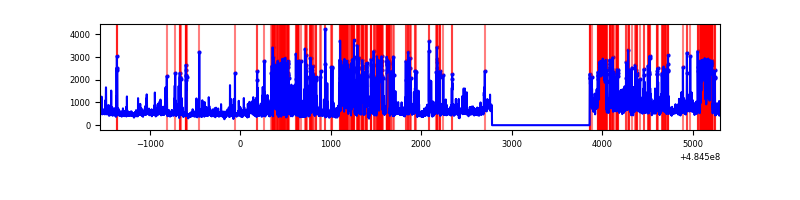 |
| D | 6857 | 5777 | 2031 | 2031 | 29.62% | 35.16% | 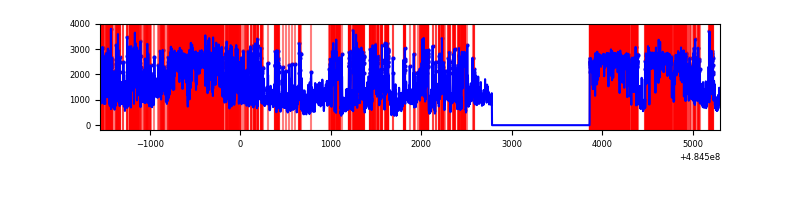 |
Top three noisy pixels from each quadrant. If the there are fewer than three noisy pixels in the level2.evt file, extra rows are filled as -1
| Pixel properties | Quadrant properties | ||||||
|---|---|---|---|---|---|---|---|
| Quadrant | DetID | PixID | Counts | Sigma | Mean | Median | Sigma |
| A | 15 | 174 | 968687 | 6895.79 | 557 | 544 | 140.4 |
| A | 12 | 2 | 876343 | 6238.05 | 557 | 544 | 140.4 |
| A | 7 | 64 | 799895 | 5693.53 | 557 | 544 | 140.4 |
| B | 4 | 171 | 461386 | 3740.68 | 584 | 565 | 123.2 |
| B | 4 | 206 | 429053 | 3478.22 | 584 | 565 | 123.2 |
| B | 8 | 128 | 259254 | 2099.89 | 584 | 565 | 123.2 |
| C | 15 | 224 | 1640172 | 10425.15 | 567 | 563 | 157.3 |
| C | 9 | 38 | 623387 | 3960.11 | 567 | 563 | 157.3 |
| C | 4 | 5 | 360241 | 2286.95 | 567 | 563 | 157.3 |
| D | 6 | 42 | 4141998 | 29511.48 | 485 | 462 | 140.3 |
| D | 12 | 17 | 1720579 | 12257.09 | 485 | 462 | 140.3 |
| D | 8 | 176 | 582275 | 4145.84 | 485 | 462 | 140.3 |
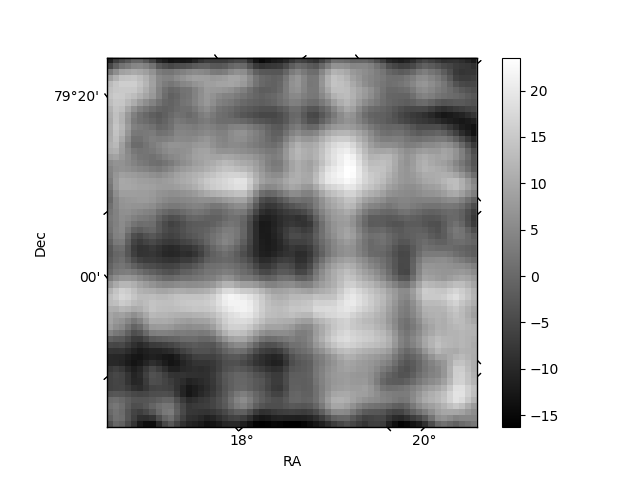
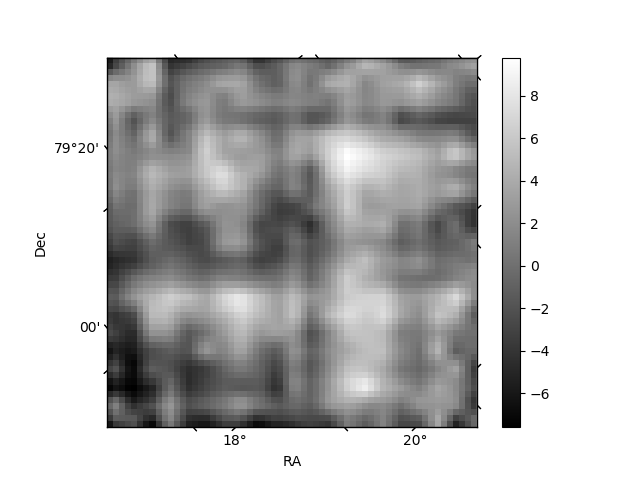
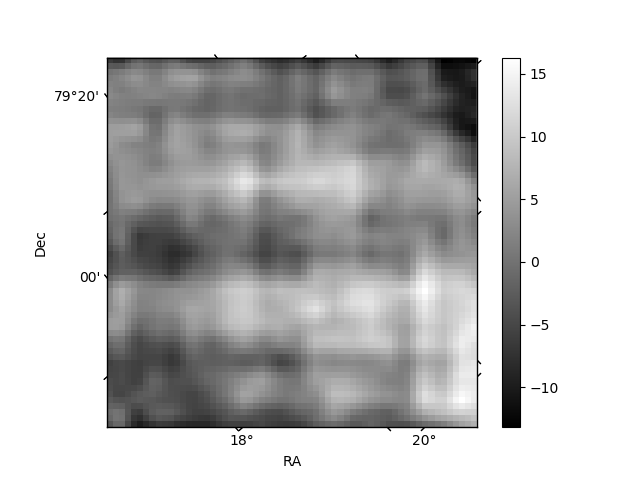
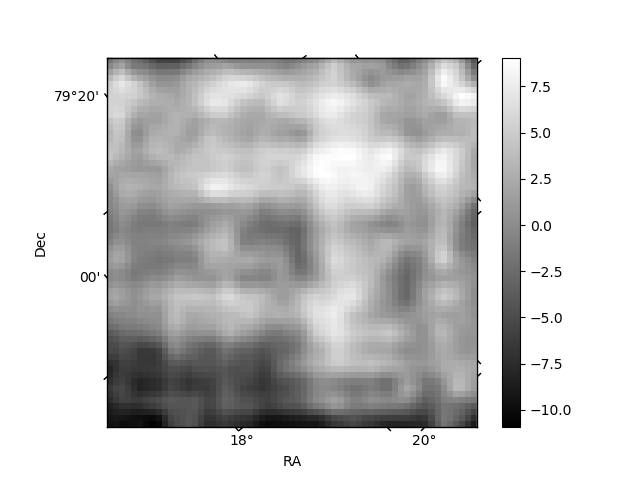
Histogram calculated using DETX and DETY for each event in the final _common_clean file
| Quadrant A | 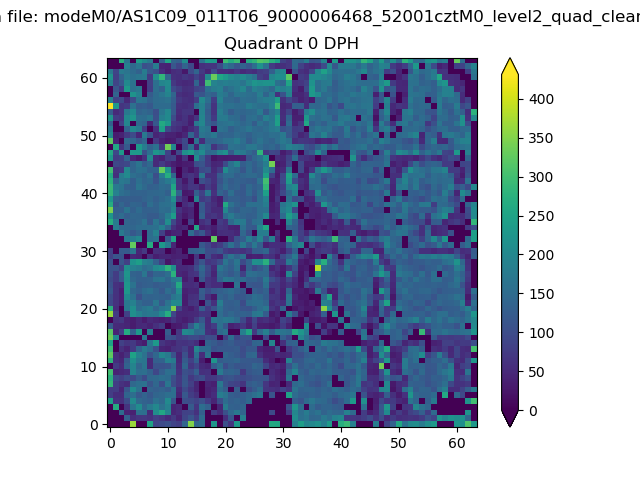 |
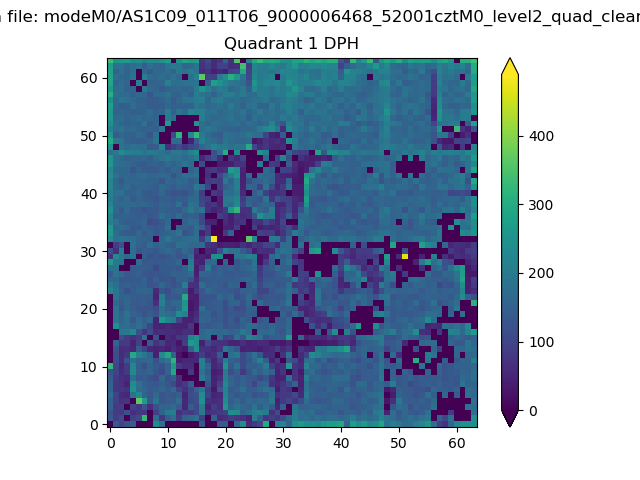 |
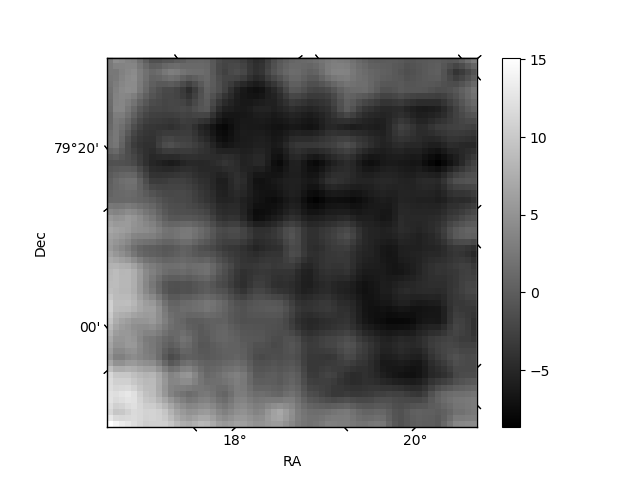
Quadrant B |
|---|---|---|---|
| Quadrant D | 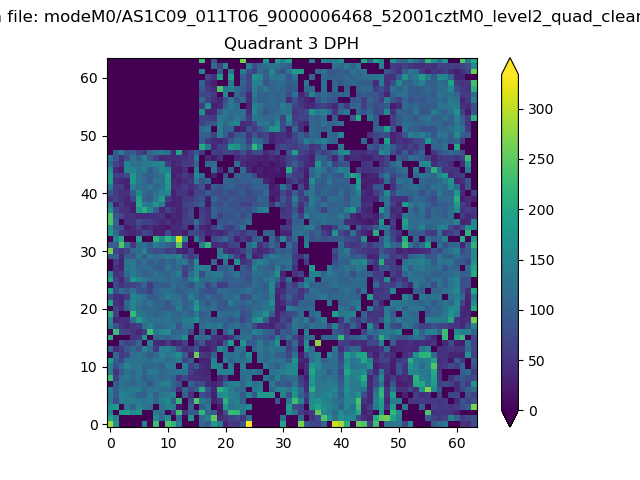 |
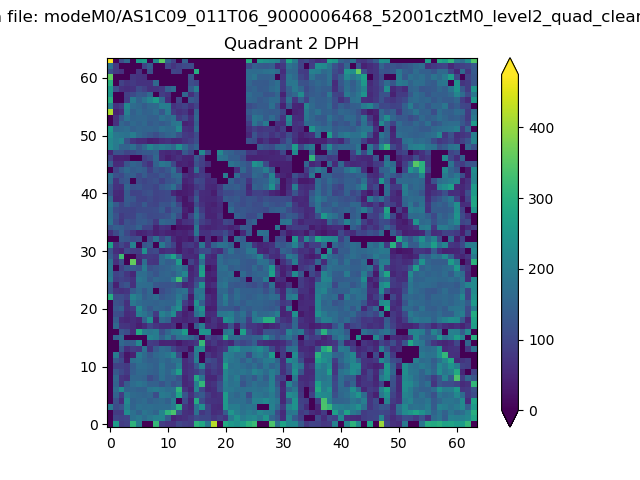 |
Quadrant C |
| Plot type | Count rate plots | Images |
|---|---|---|
| Comparison with Poisson distribution Blue bars denote a histogram of data divided into 1 sec bins. Red curve is a Poisson curve with rate = median count rate of data. |
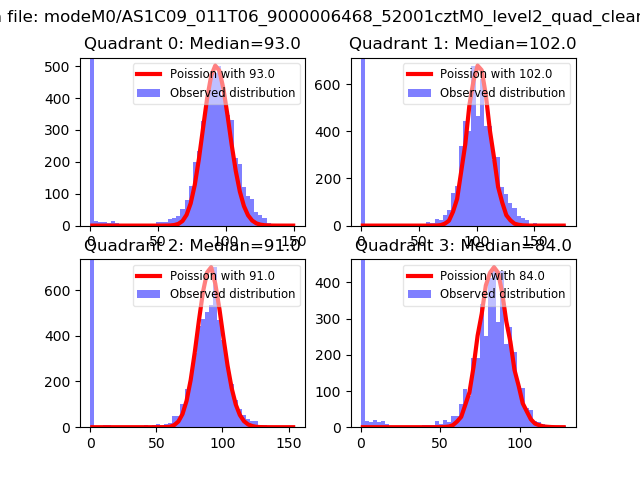 |
 |
| Quadrant-wise count rates Data is divided into 100 sec bins |
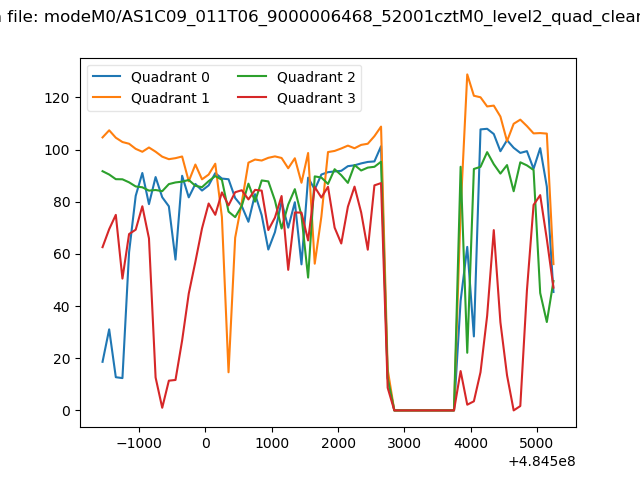 |
|
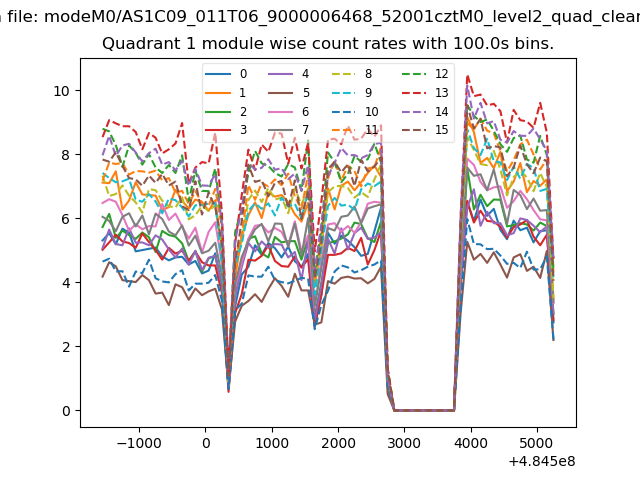
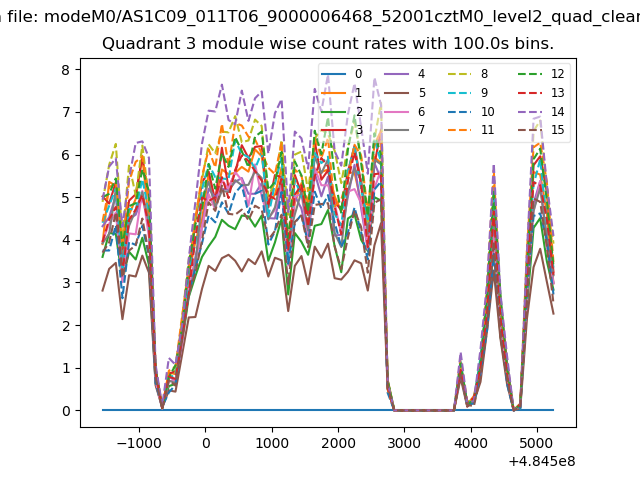
| Module-wise count rates for Quadrant A Data is divided into 100 sec bins |
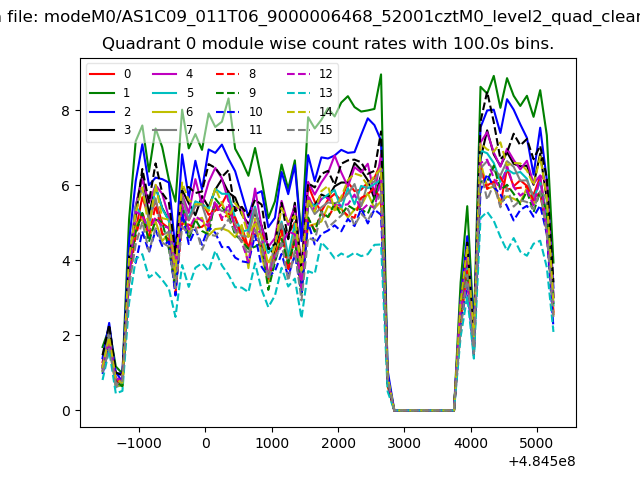 |
 |
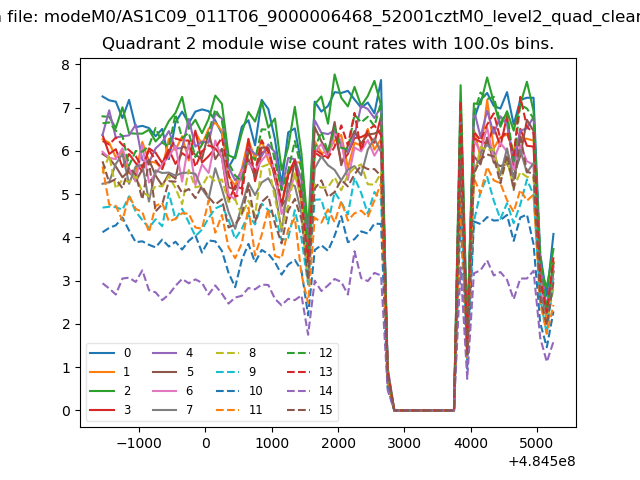
| Module-wise count rates for Quadrant B Data is divided into 100 sec bins |
 |
 |
| Module-wise count rates for Quadrant C Data is divided into 100 sec bins |
 |
 |
| Module-wise count rates for Quadrant D Data is divided into 100 sec bins |
 |
 |
| Parameter | Plot |
|---|---|
| CZT HV Monitor | 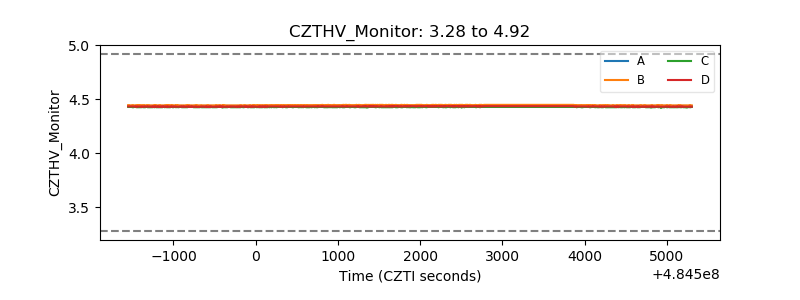 |
| D_VDD | 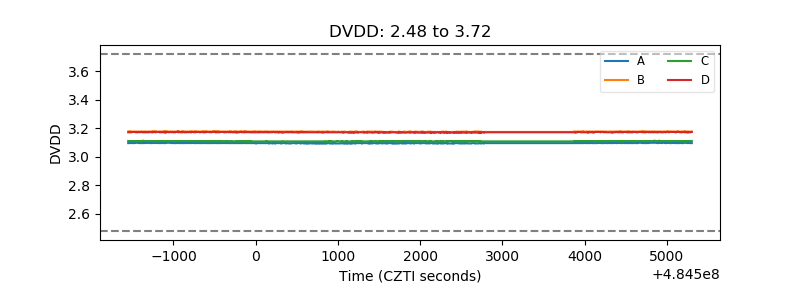 |
| Temperature 1 | 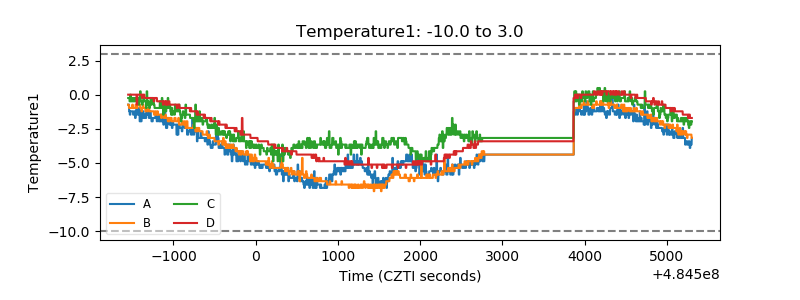 |
| Veto HV Monitor | 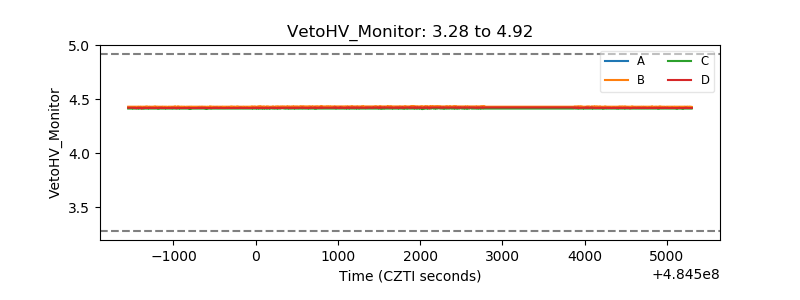 |
| Veto LLD | 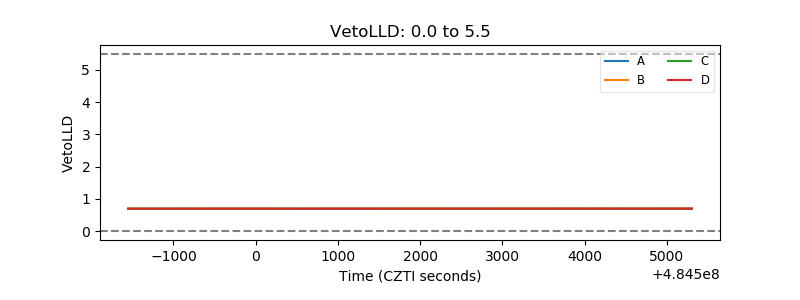 |
| Alpha Counter |  |
| _CPM_Rate | 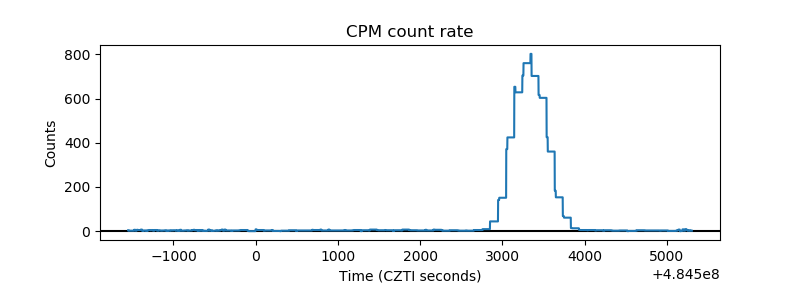 |
| CZT Counter | 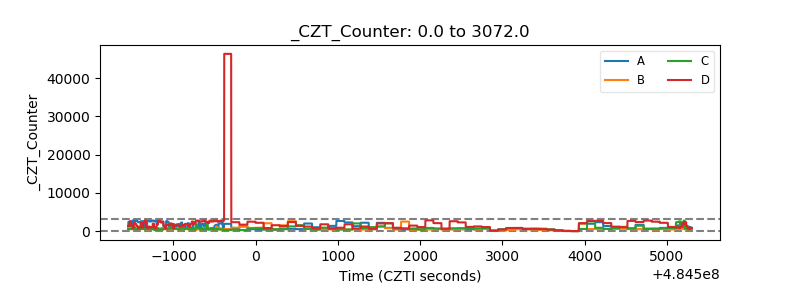 |
| +2.5 Volts monitor | 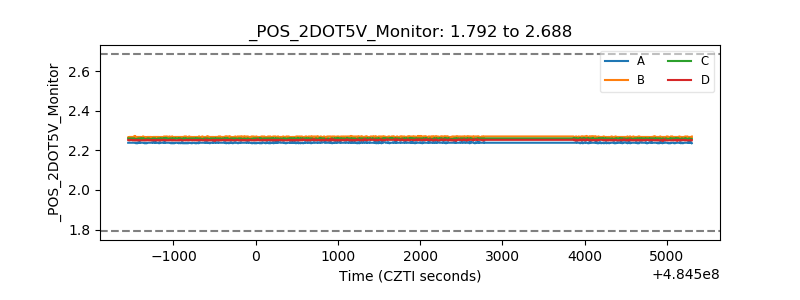 |
| +5 Volts monitor | 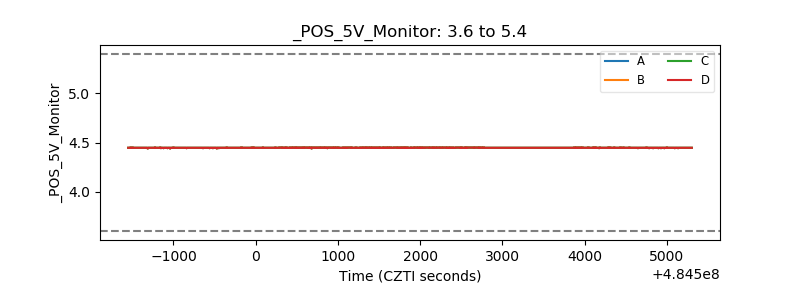 |
| _ROLL_ROT | 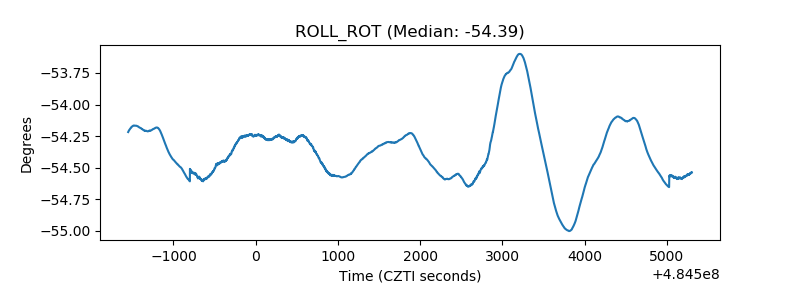 |
| _Roll_DEC | 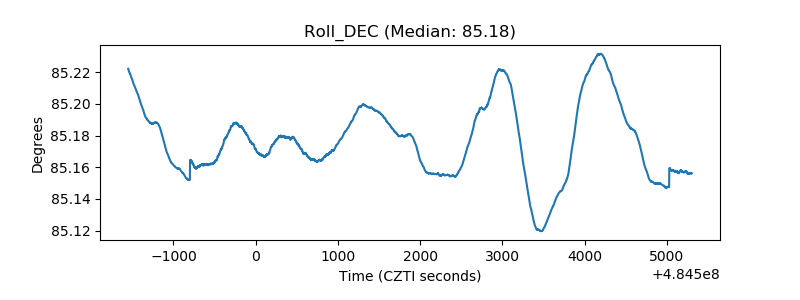 |
| _Roll_RA | 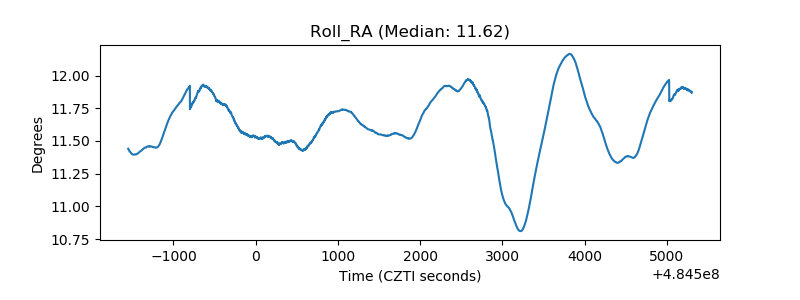 |
| Veto Counter | 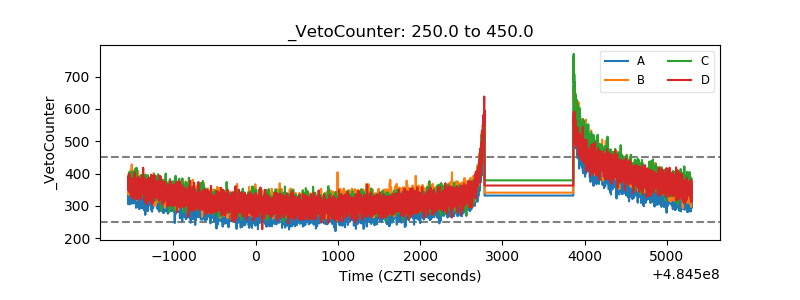 |