| Param | Original file | Final file |
|---|---|---|
| Filename | modeM0/AS1C09_011T06_9000006468_52002cztM0_level2.fits | modeM0/AS1C09_011T06_9000006468_52002cztM0_level2_quad_clean.evt |
| Size (bytes) | 809,841,600 | 80,847,360 |
| Size | 772.3 MB | 77.1 MB |
| Events in quadrant A | 8,816,401 | 447,441 |
| Events in quadrant B | 4,085,125 | 654,984 |
| Events in quadrant C | 6,425,916 | 526,397 |
| Events in quadrant D | 10,166,901 | 382,191 |
| Mode M0 | |||
|---|---|---|---|
| Quadrant | BADHDUFLAG | Total packets | Discarded packets |
| A | 0 | 30577 | 1 |
| B | 0 | 16444 | 1 |
| C | 0 | 23462 | 1 |
| D | 0 | 34563 | 1 |
| Mode M9 | |||
|---|---|---|---|
| Quadrant | BADHDUFLAG | Total packets | Discarded packets |
| A | 0 | 12 | 0 |
| B | 0 | 12 | 0 |
| C | 0 | 12 | 0 |
| D | 0 | 12 | 0 |
| Mode SS | |||
|---|---|---|---|
| Quadrant | BADHDUFLAG | Total packets | Discarded packets |
| A | 0 | 126 | 0 |
| B | 0 | 126 | 0 |
| C | 0 | 126 | 0 |
| D | 0 | 126 | 0 |
| Quadrant | Total seconds | Saturated seconds | Saturation percentage |
|---|---|---|---|
| A | 6258 | 1986 | 31.735379% |
| B | 6258 | 206 | 3.291787% |
| C | 6257 | 904 | 14.447818% |
| D | 6257 | 2232 | 35.672047% |
Noise dominated data is calculated using 1-second bins in cleaned event files. If a bin has >2000 counts, and if more than 50% of those come from <1% of pixels, then it is considered to be noise-dominated and hence unusable.
| Quadrant | # 1 sec bins | Bins with >0 counts | Bins with >2000 counts | High rate bins dominated by noise | Noise dominated (total time) | Noise dominated (detector-on time) | Marked lightcurve |
|---|---|---|---|---|---|---|---|
| A | 7413 | 6258 | 1729 | 1729 | 23.32% | 27.63% | 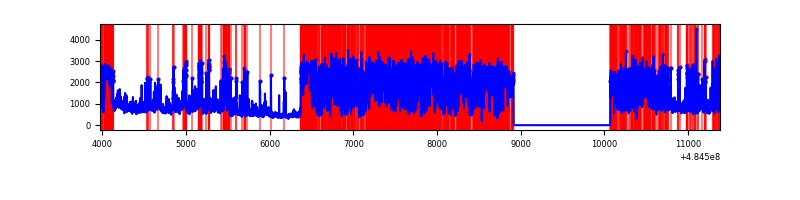 |
| B | 7413 | 6258 | 115 | 115 | 1.55% | 1.84% | 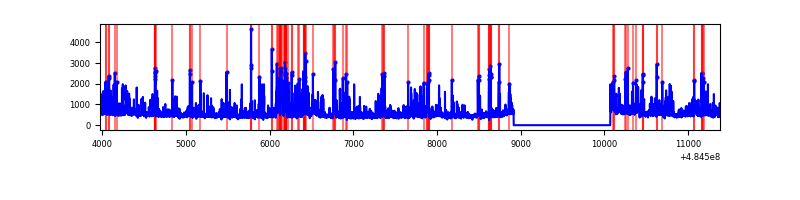 |
| C | 7412 | 6257 | 833 | 833 | 11.24% | 13.31% | 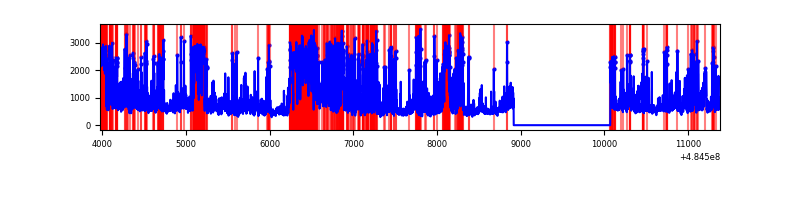 |
| D | 7412 | 6257 | 2113 | 2113 | 28.51% | 33.77% |  |
Top three noisy pixels from each quadrant. If the there are fewer than three noisy pixels in the level2.evt file, extra rows are filled as -1
| Pixel properties | Quadrant properties | ||||||
|---|---|---|---|---|---|---|---|
| Quadrant | DetID | PixID | Counts | Sigma | Mean | Median | Sigma |
| A | 7 | 64 | 2573824 | 17900.88 | 573 | 559 | 143.8 |
| A | 2 | 48 | 1799909 | 12517.15 | 573 | 559 | 143.8 |
| A | 3 | 14 | 556670 | 3868.57 | 573 | 559 | 143.8 |
| B | 4 | 206 | 264710 | 1905.62 | 664 | 642 | 138.6 |
| B | 12 | 32 | 146959 | 1055.88 | 664 | 642 | 138.6 |
| B | 10 | 247 | 132871 | 954.22 | 664 | 642 | 138.6 |
| C | 15 | 224 | 2211736 | 12859.86 | 621 | 619 | 171.9 |
| C | 9 | 38 | 743751 | 4322.06 | 621 | 619 | 171.9 |
| C | 4 | 5 | 354598 | 2058.74 | 621 | 619 | 171.9 |
| D | 6 | 42 | 2702428 | 17212.28 | 548 | 523 | 157.0 |
| D | 12 | 17 | 1532513 | 9759.42 | 548 | 523 | 157.0 |
| D | 8 | 176 | 1231129 | 7839.48 | 548 | 523 | 157.0 |
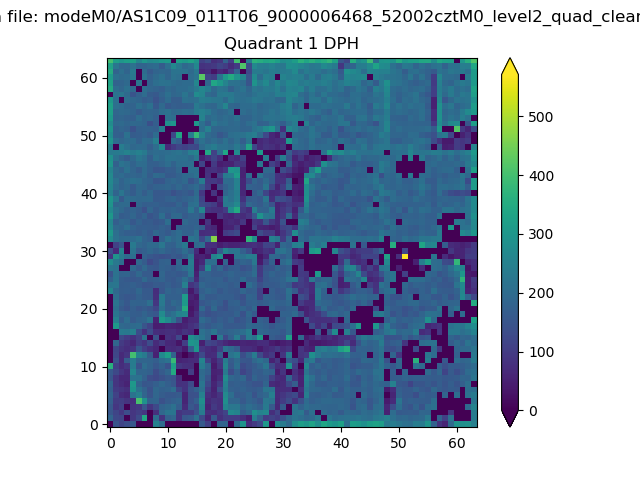
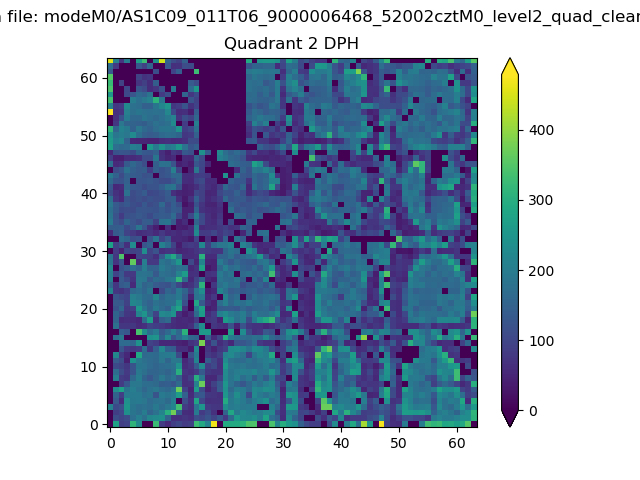
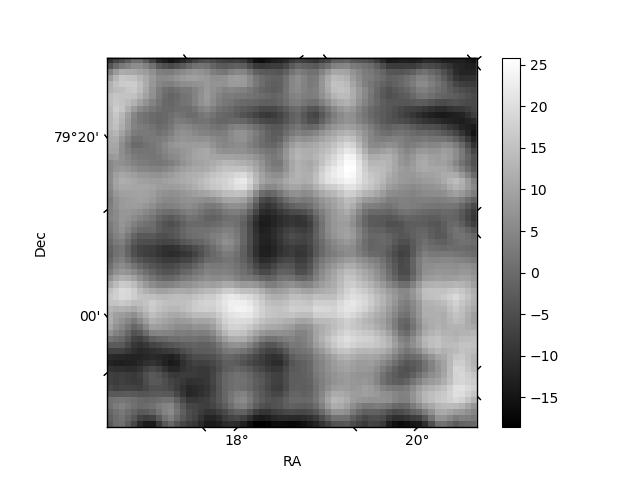
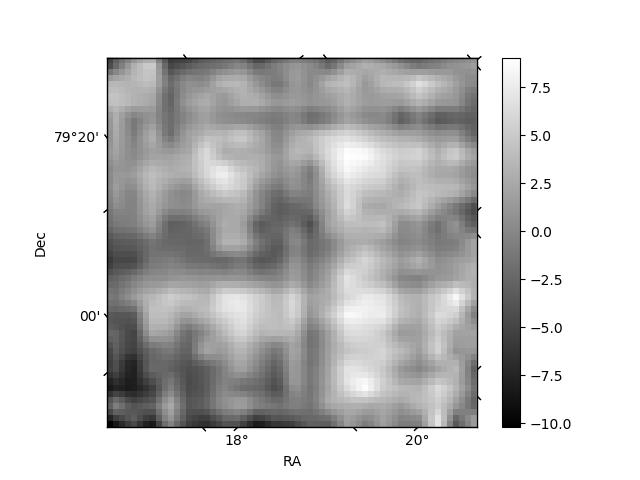
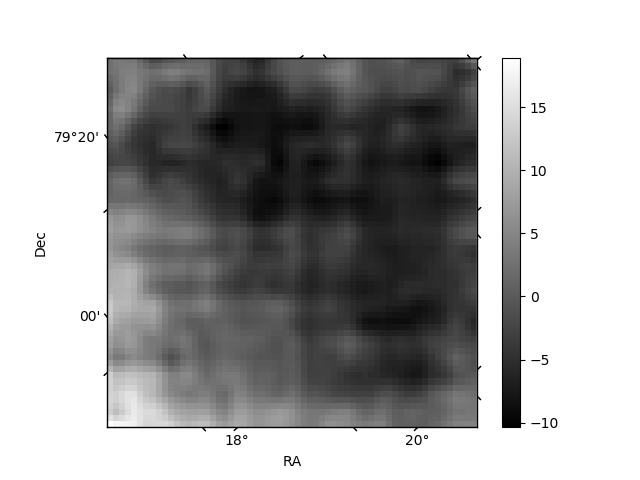
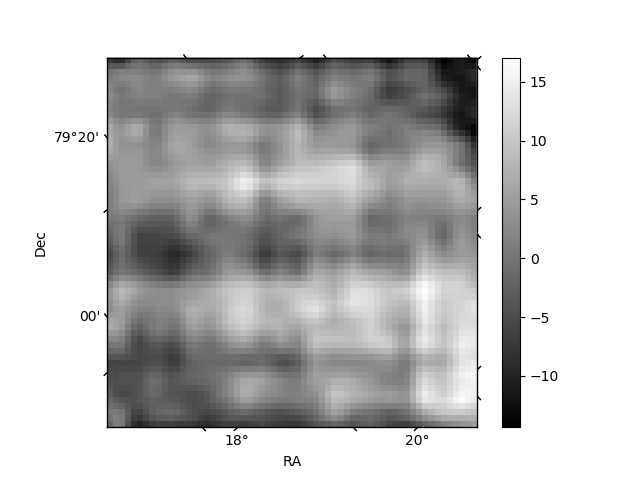
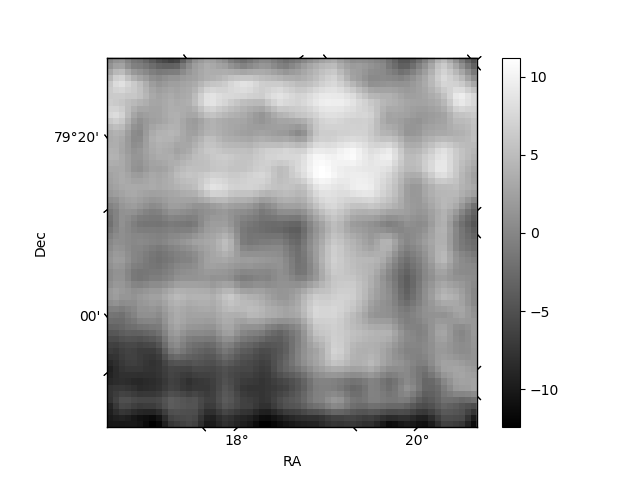
Histogram calculated using DETX and DETY for each event in the final _common_clean file
| Quadrant A | 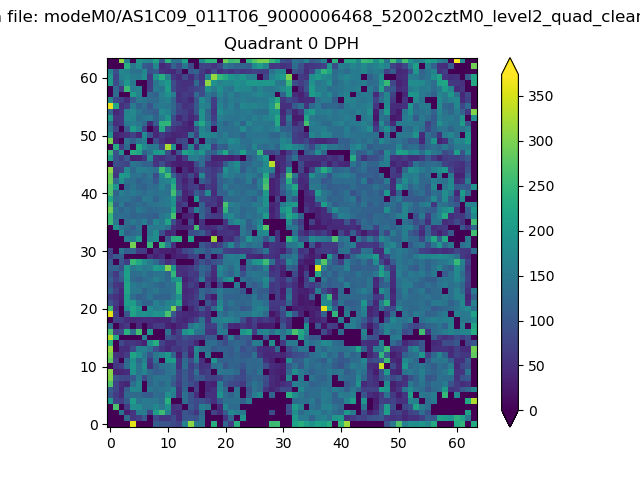 |
 |
Quadrant B |
|---|---|---|---|
| Quadrant D | 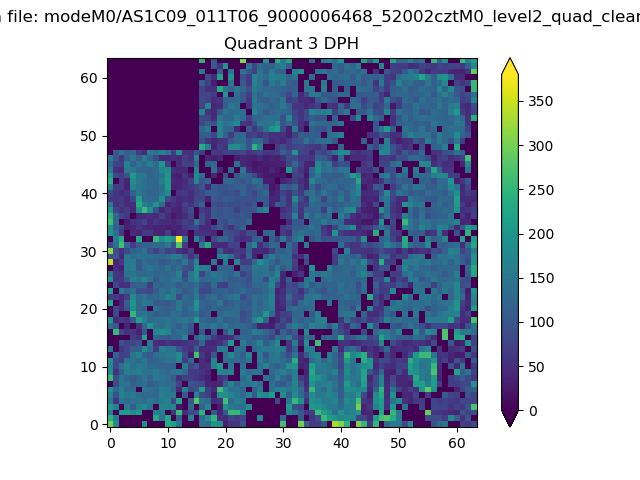 |
 |
Quadrant C |
| Plot type | Count rate plots | Images |
|---|---|---|
| Comparison with Poisson distribution Blue bars denote a histogram of data divided into 1 sec bins. Red curve is a Poisson curve with rate = median count rate of data. |
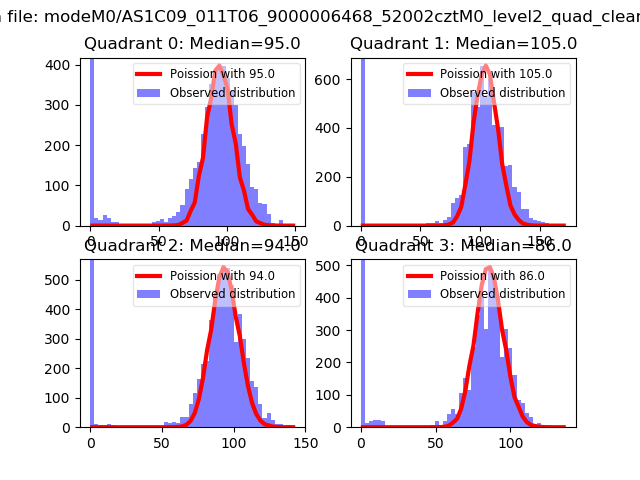 |
 |
| Quadrant-wise count rates Data is divided into 100 sec bins |
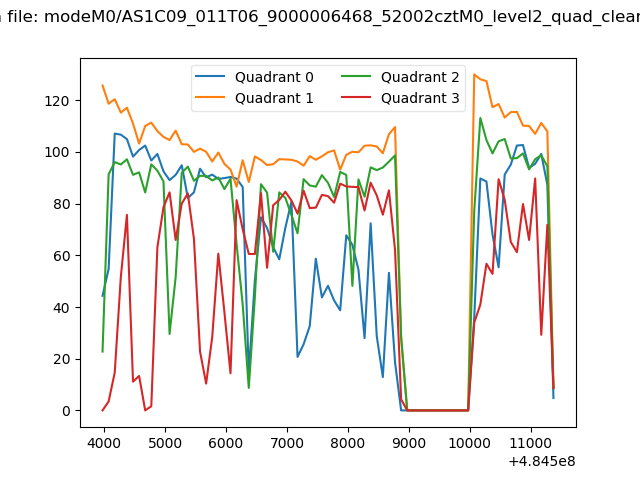 |
|
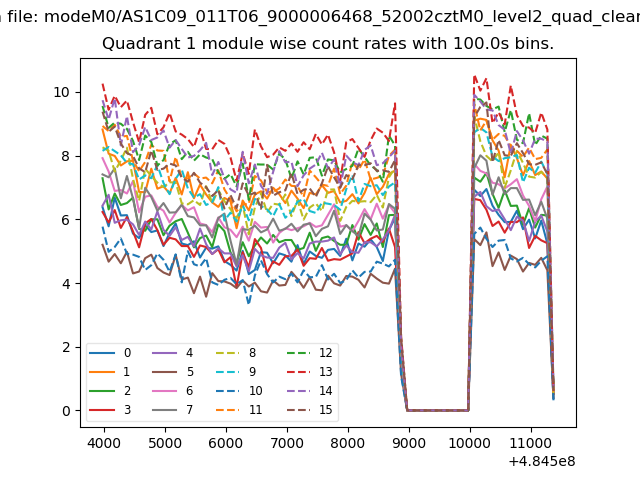
| Module-wise count rates for Quadrant A Data is divided into 100 sec bins |
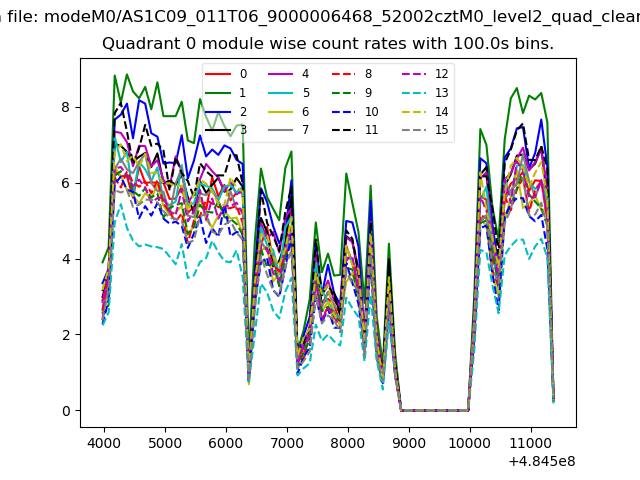 |
 |
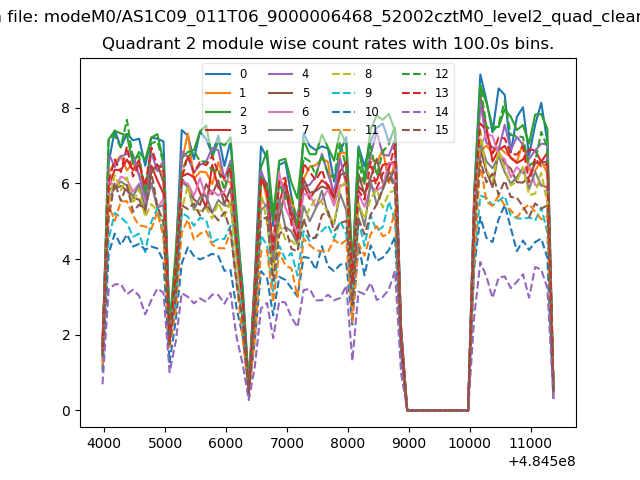
| Module-wise count rates for Quadrant B Data is divided into 100 sec bins |
 |
 |
| Module-wise count rates for Quadrant C Data is divided into 100 sec bins |
 |
 |
| Module-wise count rates for Quadrant D Data is divided into 100 sec bins |
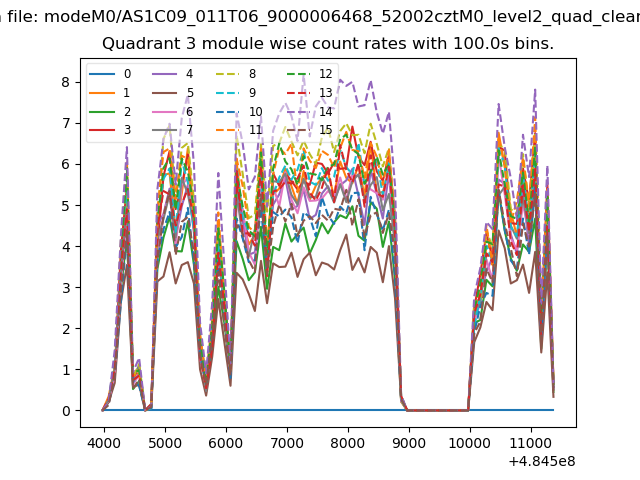 |
 |
| Parameter | Plot |
|---|---|
| CZT HV Monitor | 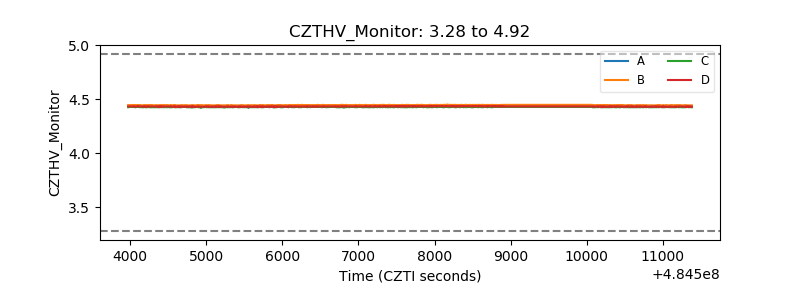 |
| D_VDD | 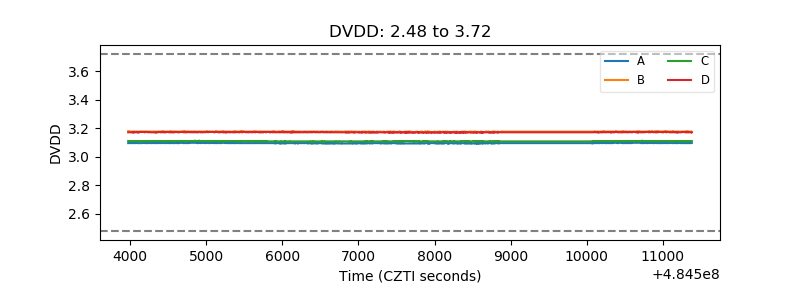 |
| Temperature 1 | 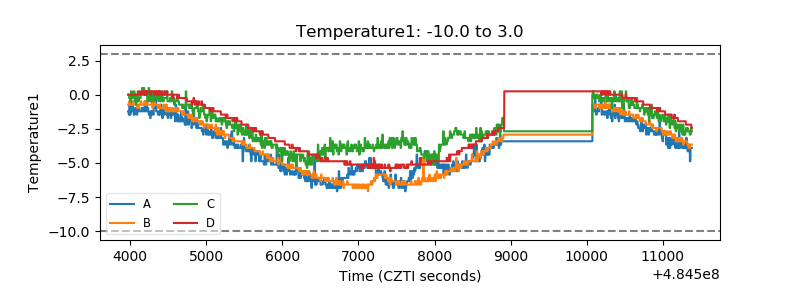 |
| Veto HV Monitor | 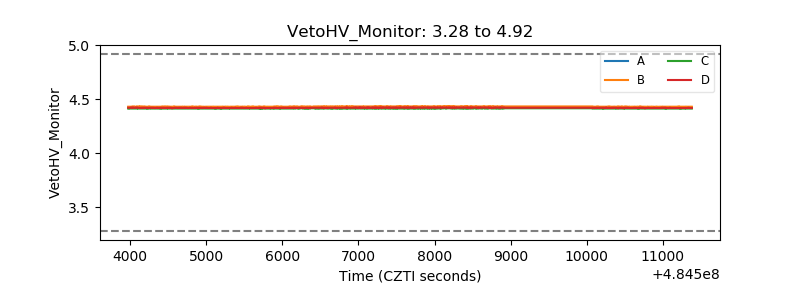 |
| Veto LLD | 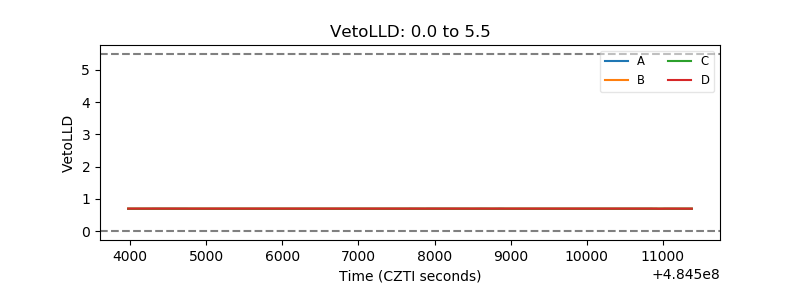 |
| Alpha Counter | 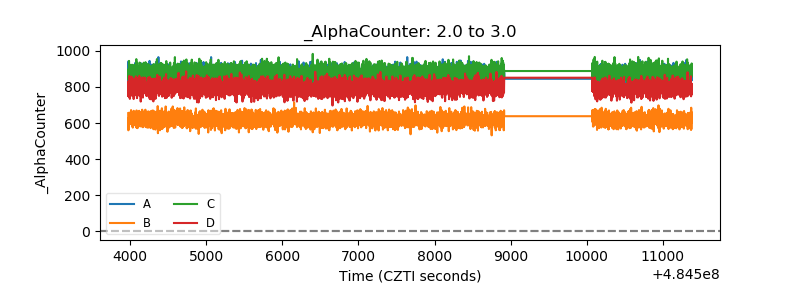 |
| _CPM_Rate | 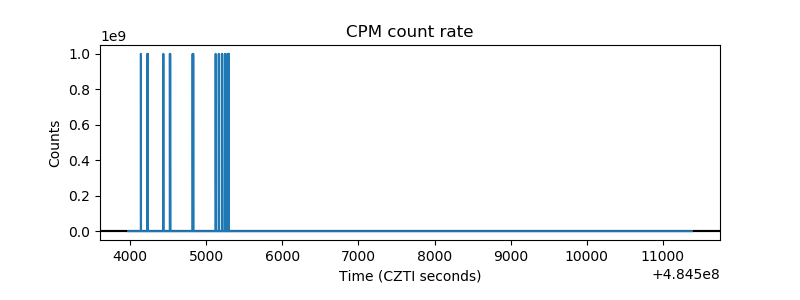 |
| CZT Counter | 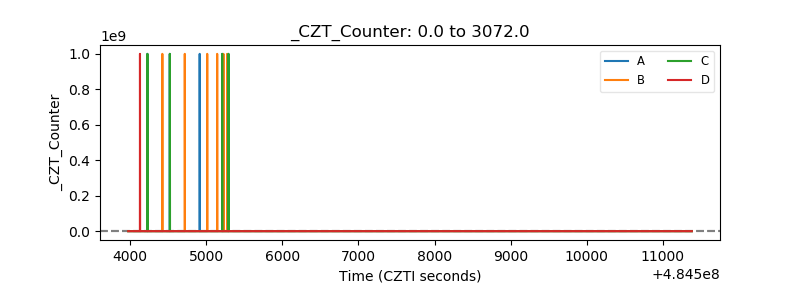 |
| +2.5 Volts monitor | 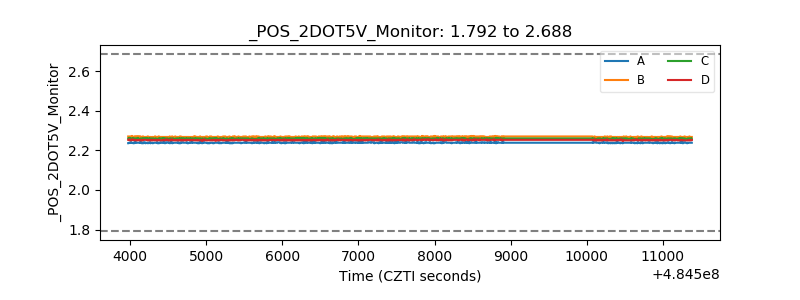 |
| +5 Volts monitor | 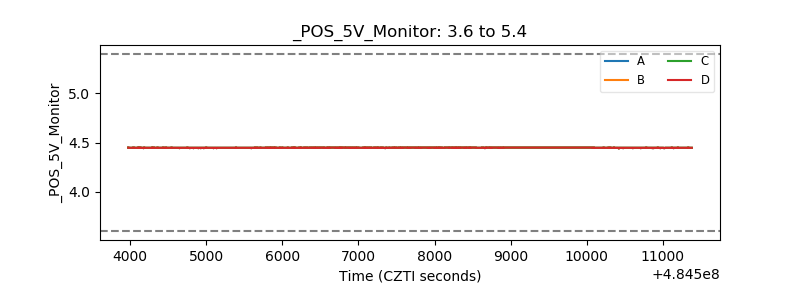 |
| _ROLL_ROT | 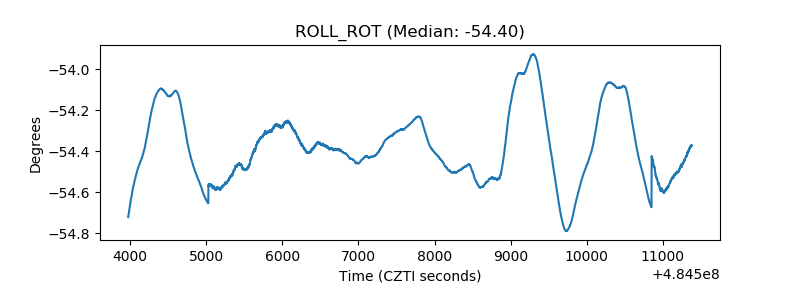 |
| _Roll_DEC | 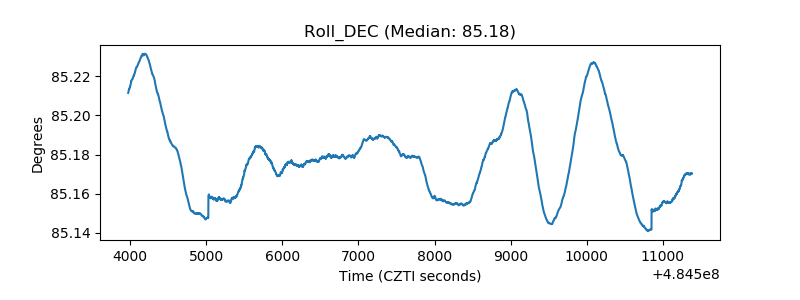 |
| _Roll_RA | 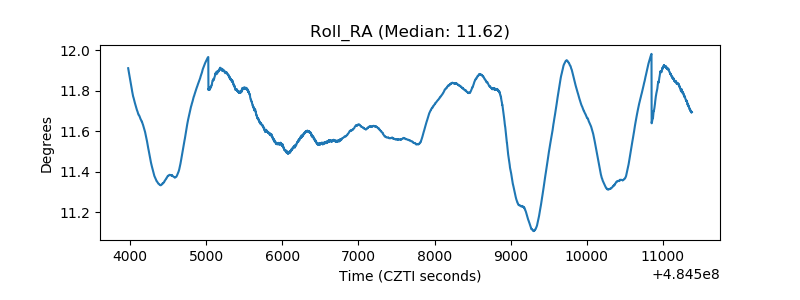 |
| Veto Counter | 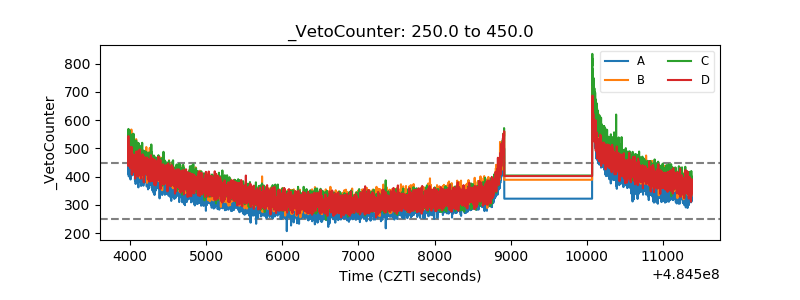 |