| Param | Original file | Final file |
|---|---|---|
| Filename | modeM0/AS1C09_011T06_9000006468_52003cztM0_level2.fits | modeM0/AS1C09_011T06_9000006468_52003cztM0_level2_quad_clean.evt |
| Size (bytes) | 814,006,080 | 83,180,160 |
| Size | 776.3 MB | 79.3 MB |
| Events in quadrant A | 6,528,086 | 534,901 |
| Events in quadrant B | 5,020,394 | 650,692 |
| Events in quadrant C | 5,945,583 | 561,508 |
| Events in quadrant D | 12,148,925 | 329,056 |
| Mode M0 | |||
|---|---|---|---|
| Quadrant | BADHDUFLAG | Total packets | Discarded packets |
| A | 0 | 23841 | 2 |
| B | 0 | 19371 | 2 |
| C | 0 | 22044 | 7 |
| D | 0 | 40446 | 2 |
| Mode M9 | |||
|---|---|---|---|
| Quadrant | BADHDUFLAG | Total packets | Discarded packets |
| A | 0 | 12 | 0 |
| B | 0 | 12 | 0 |
| C | 0 | 12 | 0 |
| D | 0 | 12 | 0 |
| Mode SS | |||
|---|---|---|---|
| Quadrant | BADHDUFLAG | Total packets | Discarded packets |
| A | 0 | 130 | 0 |
| B | 0 | 130 | 0 |
| C | 0 | 130 | 0 |
| D | 0 | 130 | 0 |
| Quadrant | Total seconds | Saturated seconds | Saturation percentage |
|---|---|---|---|
| A | 6328 | 1117 | 17.651707% |
| B | 6329 | 471 | 7.441934% |
| C | 6328 | 777 | 12.278761% |
| D | 6328 | 3044 | 48.103666% |
Noise dominated data is calculated using 1-second bins in cleaned event files. If a bin has >2000 counts, and if more than 50% of those come from <1% of pixels, then it is considered to be noise-dominated and hence unusable.
| Quadrant | # 1 sec bins | Bins with >0 counts | Bins with >2000 counts | High rate bins dominated by noise | Noise dominated (total time) | Noise dominated (detector-on time) | Marked lightcurve |
|---|---|---|---|---|---|---|---|
| A | 7558 | 6328 | 929 | 929 | 12.29% | 14.68% | 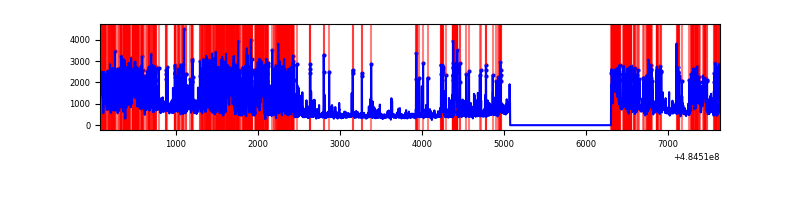 |
| B | 7559 | 6330 | 313 | 313 | 4.14% | 4.94% | 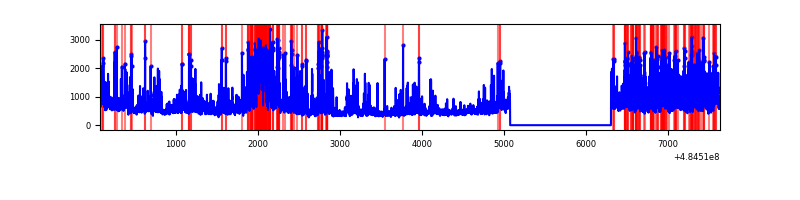 |
| C | 7558 | 6329 | 671 | 671 | 8.88% | 10.60% | 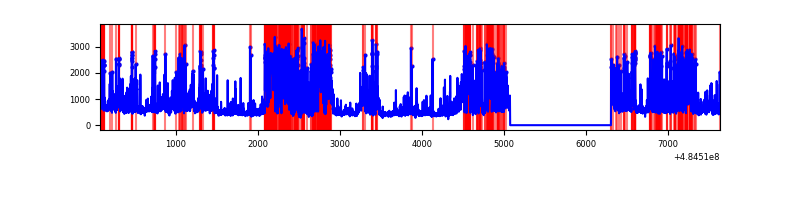 |
| D | 7557 | 6327 | 3159 | 3159 | 41.80% | 49.93% | 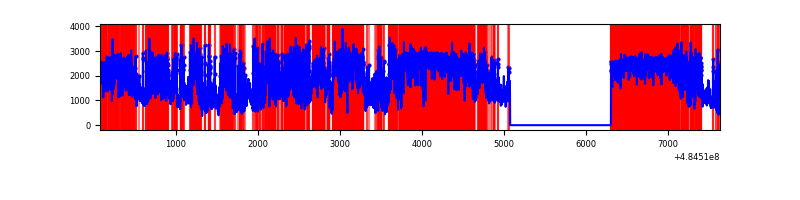 |
Top three noisy pixels from each quadrant. If the there are fewer than three noisy pixels in the level2.evt file, extra rows are filled as -1
| Pixel properties | Quadrant properties | ||||||
|---|---|---|---|---|---|---|---|
| Quadrant | DetID | PixID | Counts | Sigma | Mean | Median | Sigma |
| A | 2 | 48 | 1664446 | 10685.5 | 619 | 605 | 155.7 |
| A | 7 | 64 | 604016 | 3875.22 | 619 | 605 | 155.7 |
| A | 3 | 14 | 537513 | 3448.12 | 619 | 605 | 155.7 |
| B | 7 | 0 | 534776 | 3839.61 | 665 | 643 | 139.1 |
| B | 4 | 206 | 385105 | 2763.7 | 665 | 643 | 139.1 |
| B | 4 | 171 | 299820 | 2150.63 | 665 | 643 | 139.1 |
| C | 15 | 224 | 2404322 | 13563.67 | 642 | 640 | 177.2 |
| C | 9 | 38 | 283034 | 1593.51 | 642 | 640 | 177.2 |
| C | 12 | 252 | 146307 | 821.98 | 642 | 640 | 177.2 |
| D | 6 | 42 | 4199545 | 27394.14 | 535 | 512 | 153.3 |
| D | 12 | 17 | 2373990 | 15484.37 | 535 | 512 | 153.3 |
| D | 8 | 176 | 1520843 | 9918.51 | 535 | 512 | 153.3 |
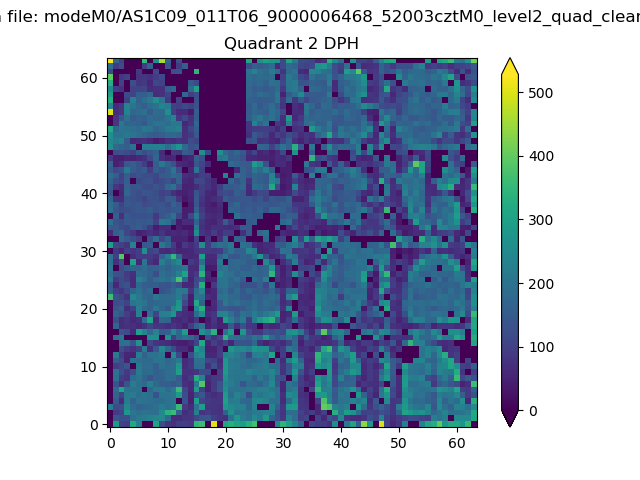
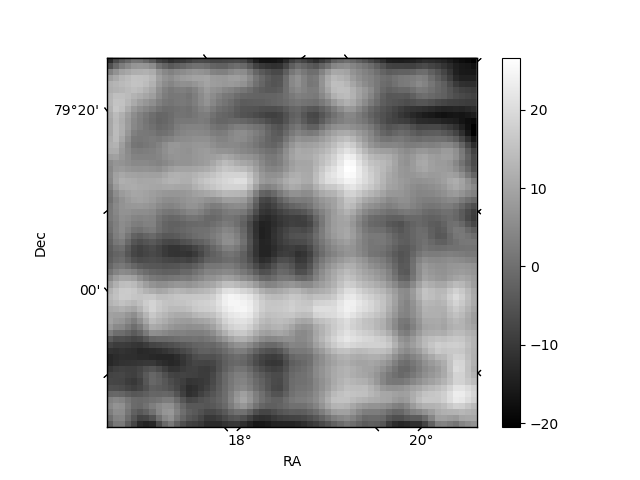
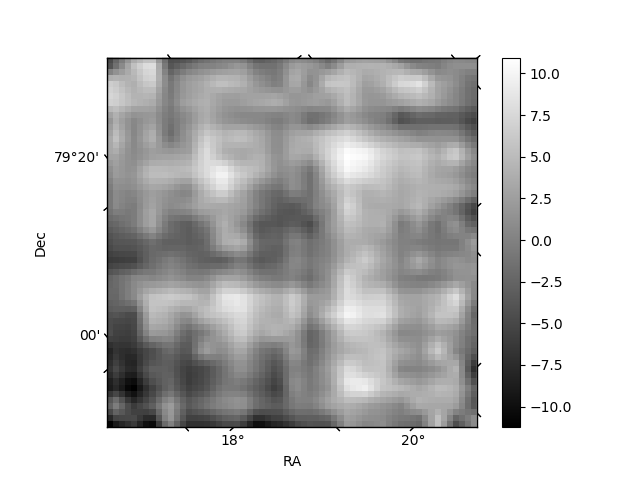
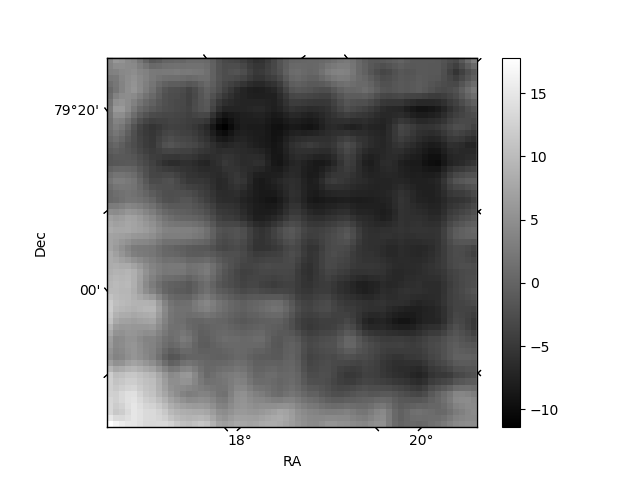
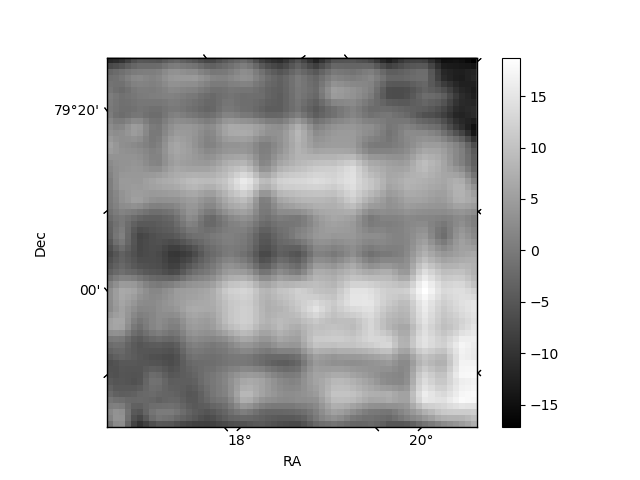
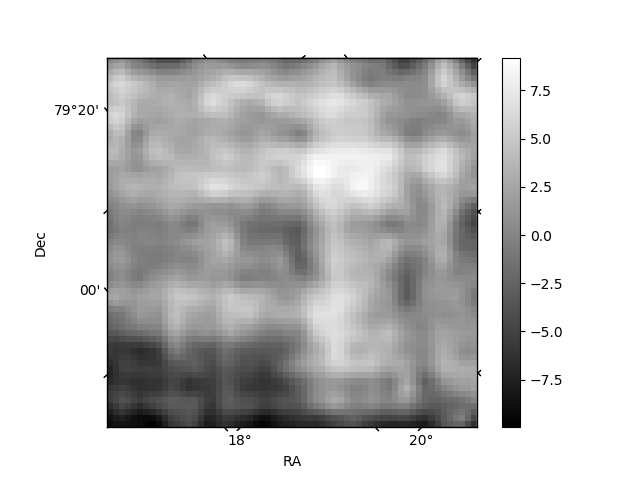
Histogram calculated using DETX and DETY for each event in the final _common_clean file
| Quadrant A | 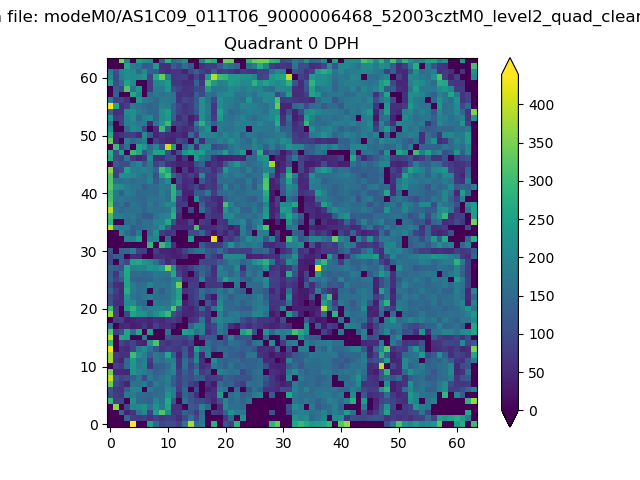 |
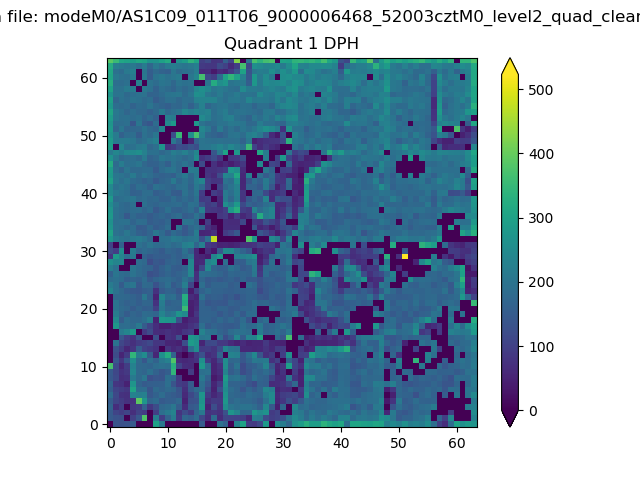 |
Quadrant B |
|---|---|---|---|
| Quadrant D | 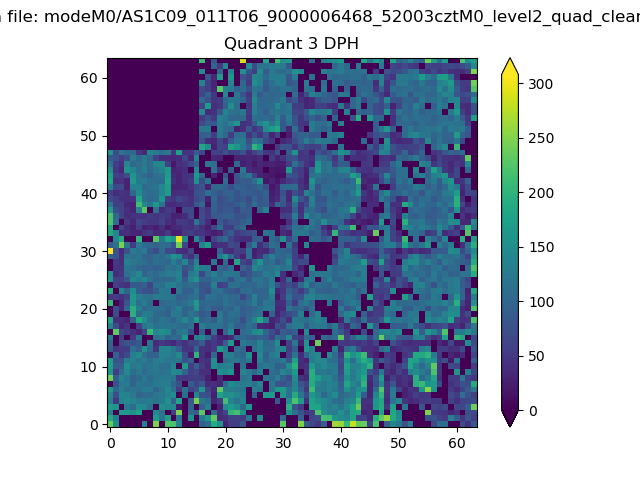 |
 |
Quadrant C |
| Plot type | Count rate plots | Images |
|---|---|---|
| Comparison with Poisson distribution Blue bars denote a histogram of data divided into 1 sec bins. Red curve is a Poisson curve with rate = median count rate of data. |
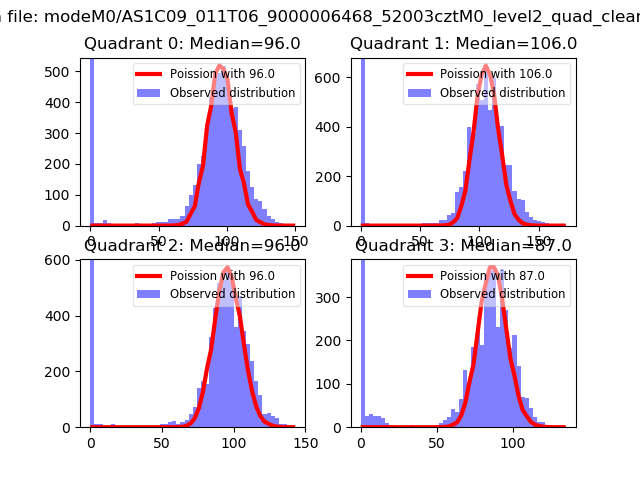 |
 |
| Quadrant-wise count rates Data is divided into 100 sec bins |
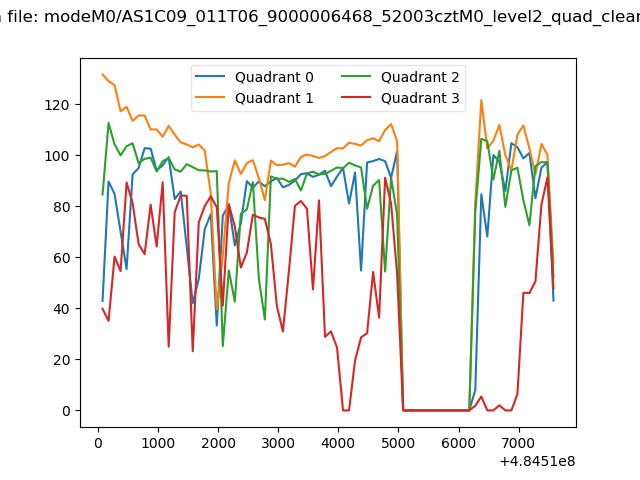 |
|
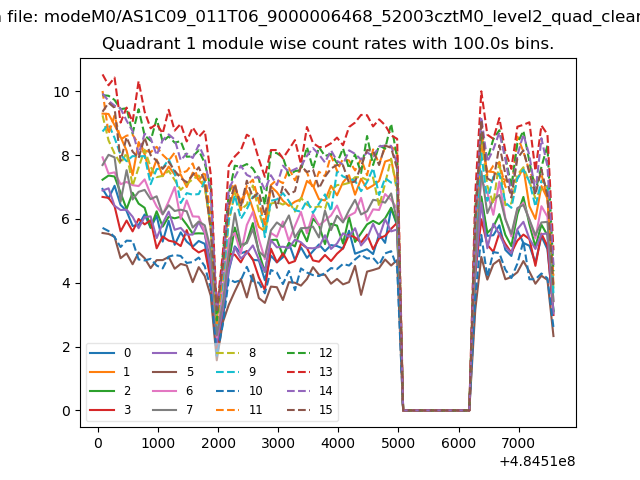
| Module-wise count rates for Quadrant A Data is divided into 100 sec bins |
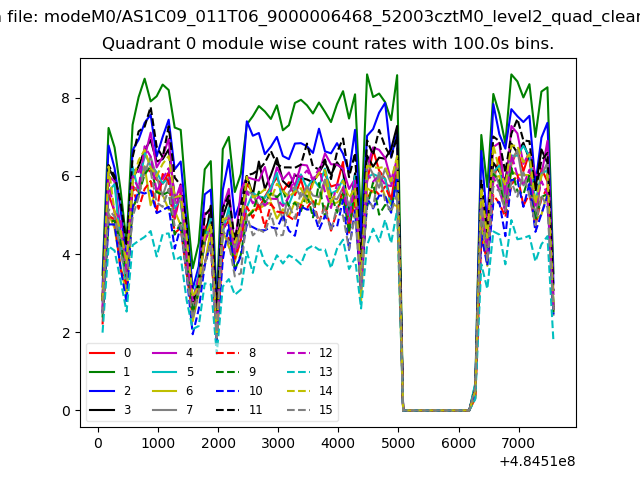 |
 |
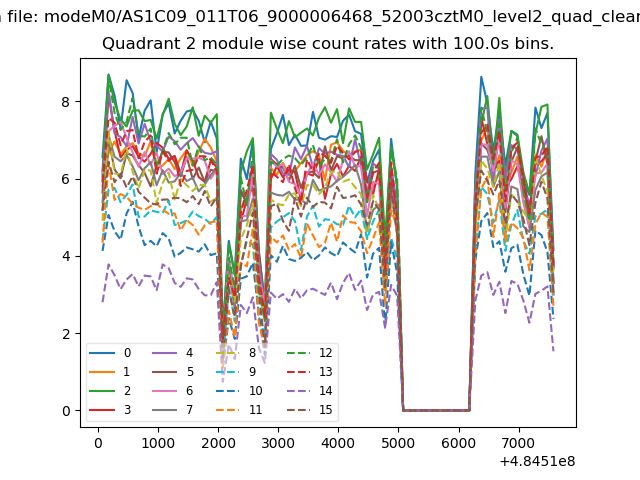
| Module-wise count rates for Quadrant B Data is divided into 100 sec bins |
 |
 |
| Module-wise count rates for Quadrant C Data is divided into 100 sec bins |
 |
 |
| Module-wise count rates for Quadrant D Data is divided into 100 sec bins |
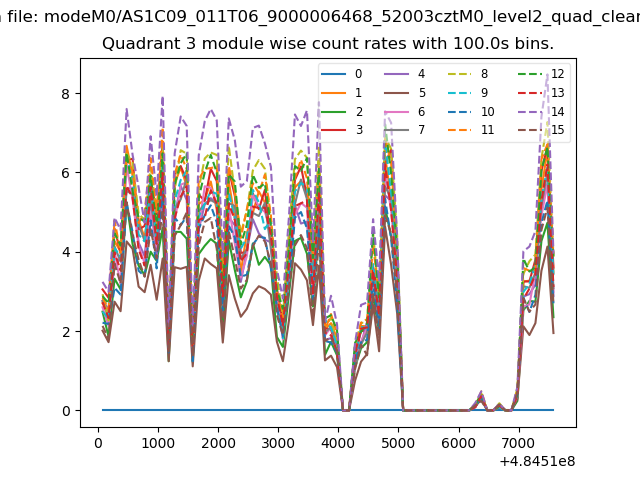 |
 |
| Parameter | Plot |
|---|---|
| CZT HV Monitor | 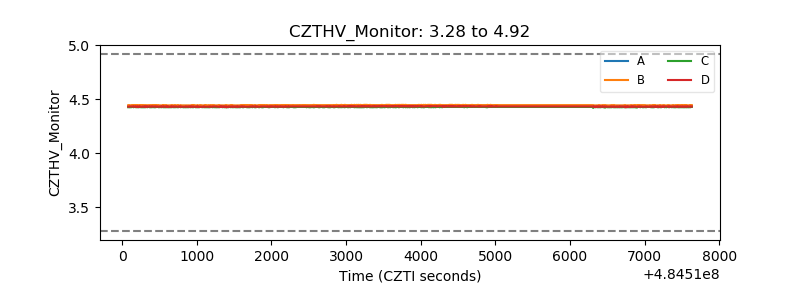 |
| D_VDD | 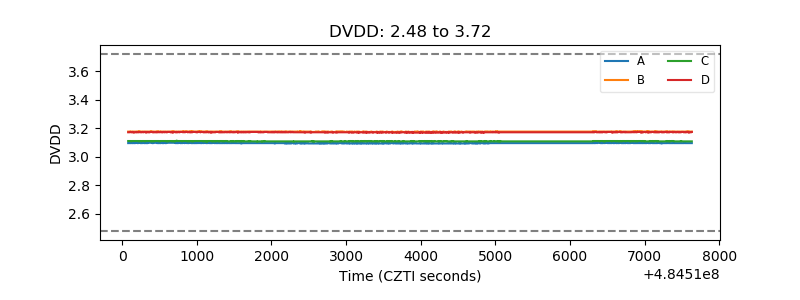 |
| Temperature 1 | 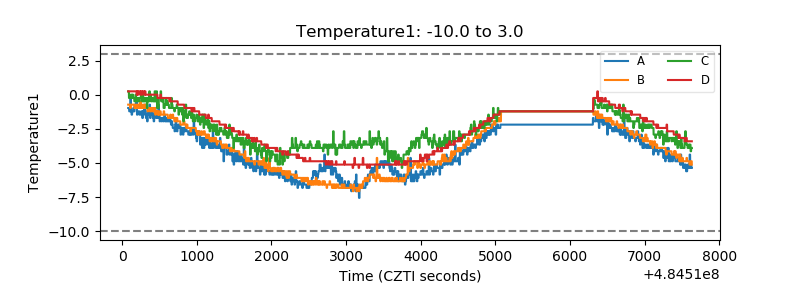 |
| Veto HV Monitor | 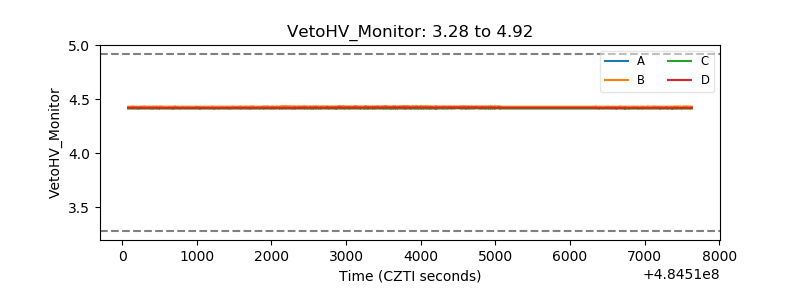 |
| Veto LLD | 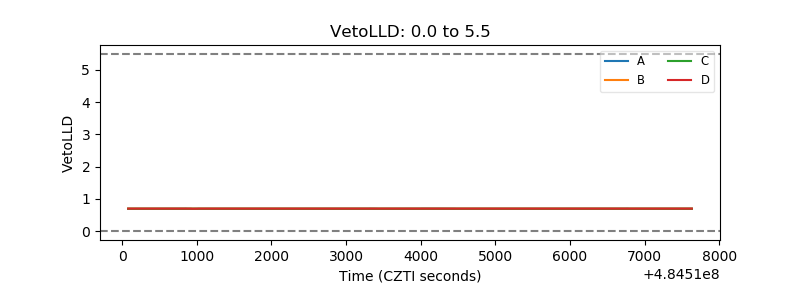 |
| Alpha Counter | 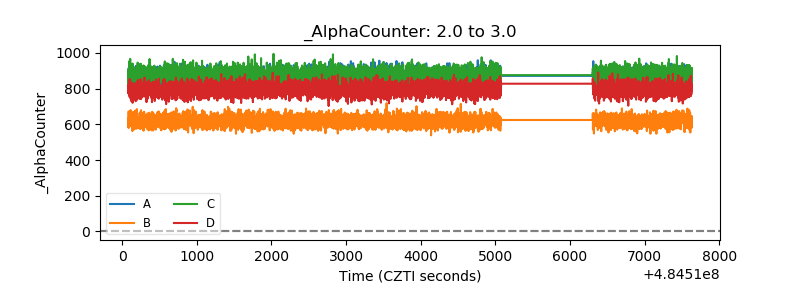 |
| _CPM_Rate | 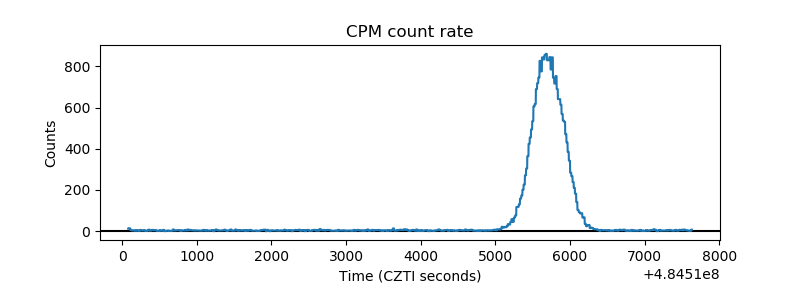 |
| CZT Counter | 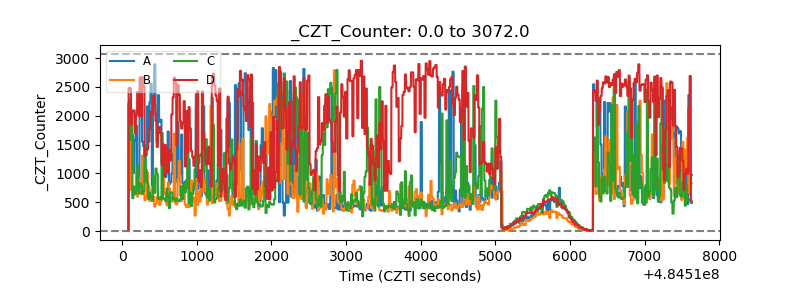 |
| +2.5 Volts monitor | 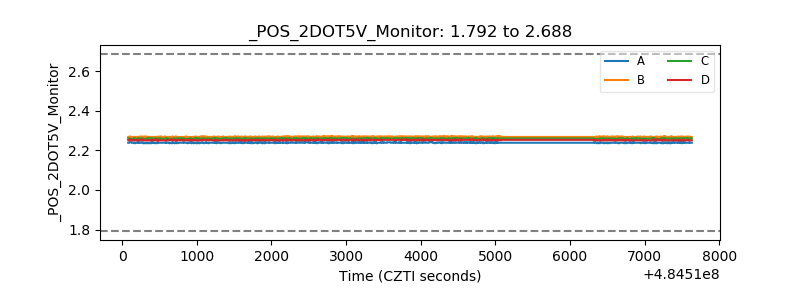 |
| +5 Volts monitor | 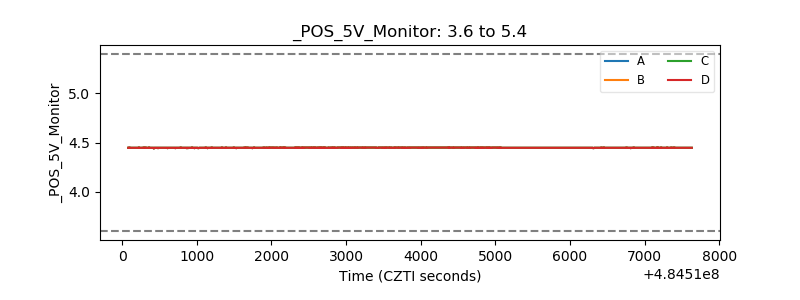 |
| _ROLL_ROT | 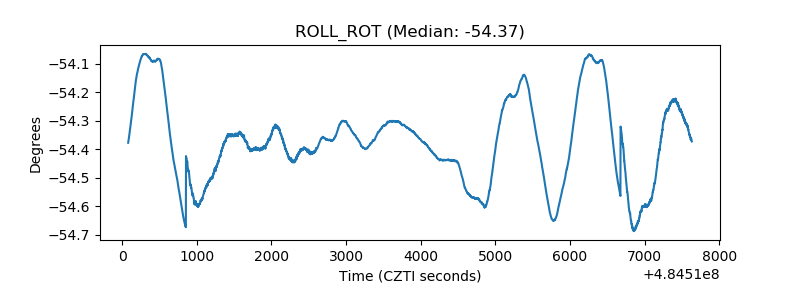 |
| _Roll_DEC | 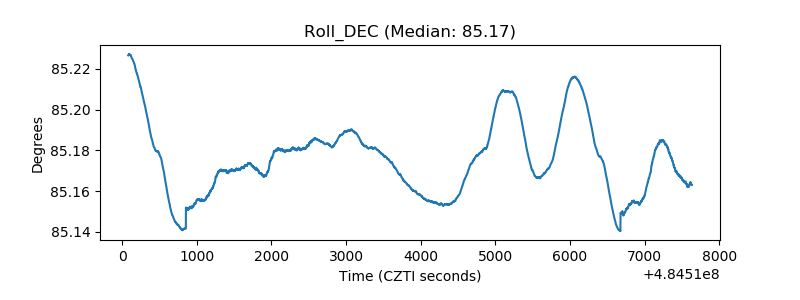 |
| _Roll_RA |  |
| Veto Counter | 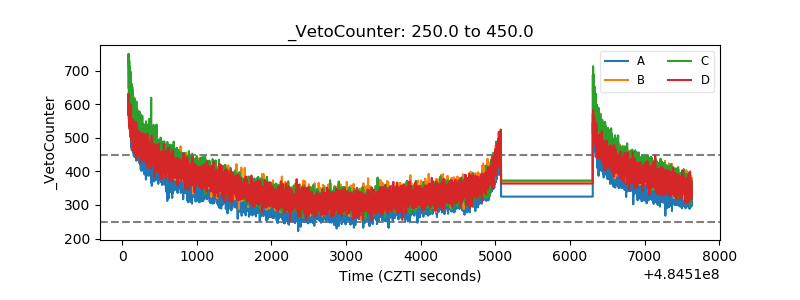 |