| Param | Original file | Final file |
|---|---|---|
| Filename | modeM0/AS1C09_011T06_9000006468_52004cztM0_level2.fits | modeM0/AS1C09_011T06_9000006468_52004cztM0_level2_quad_clean.evt |
| Size (bytes) | 799,519,680 | 86,745,600 |
| Size | 762.5 MB | 82.7 MB |
| Events in quadrant A | 6,591,949 | 550,283 |
| Events in quadrant B | 7,014,840 | 605,874 |
| Events in quadrant C | 6,728,773 | 561,423 |
| Events in quadrant D | 8,758,190 | 454,665 |
| Mode M0 | |||
|---|---|---|---|
| Quadrant | BADHDUFLAG | Total packets | Discarded packets |
| A | 0 | 24203 | 2 |
| B | 0 | 25420 | 2 |
| C | 0 | 24461 | 3 |
| D | 0 | 30607 | 2 |
| Mode M9 | |||
|---|---|---|---|
| Quadrant | BADHDUFLAG | Total packets | Discarded packets |
| A | 0 | 11 | 0 |
| B | 0 | 11 | 0 |
| C | 0 | 11 | 0 |
| D | 0 | 11 | 0 |
| Mode SS | |||
|---|---|---|---|
| Quadrant | BADHDUFLAG | Total packets | Discarded packets |
| A | 0 | 134 | 0 |
| B | 0 | 134 | 0 |
| C | 0 | 134 | 0 |
| D | 0 | 134 | 0 |
| Quadrant | Total seconds | Saturated seconds | Saturation percentage |
|---|---|---|---|
| A | 6499 | 1023 | 15.740883% |
| B | 6500 | 1067 | 16.415385% |
| C | 6499 | 942 | 14.494538% |
| D | 6499 | 1590 | 24.465302% |
Noise dominated data is calculated using 1-second bins in cleaned event files. If a bin has >2000 counts, and if more than 50% of those come from <1% of pixels, then it is considered to be noise-dominated and hence unusable.
| Quadrant | # 1 sec bins | Bins with >0 counts | Bins with >2000 counts | High rate bins dominated by noise | Noise dominated (total time) | Noise dominated (detector-on time) | Marked lightcurve |
|---|---|---|---|---|---|---|---|
| A | 7633 | 6499 | 799 | 799 | 10.47% | 12.29% | 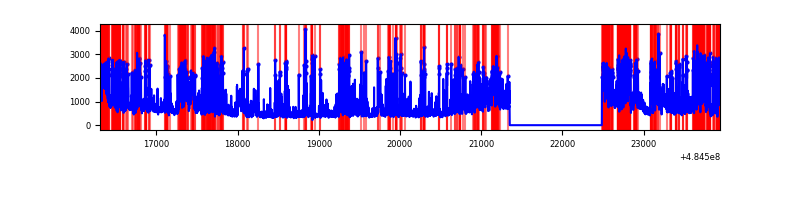 |
| B | 7634 | 6499 | 635 | 635 | 8.32% | 9.77% | 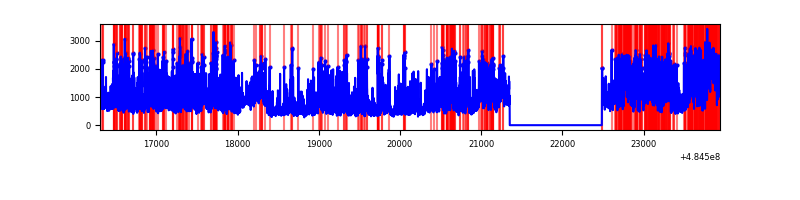 |
| C | 7634 | 6499 | 860 | 860 | 11.27% | 13.23% | 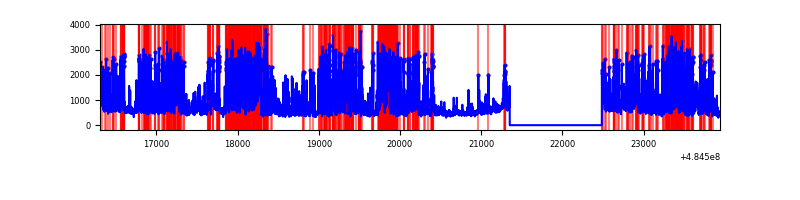 |
| D | 7634 | 6500 | 1525 | 1525 | 19.98% | 23.46% | 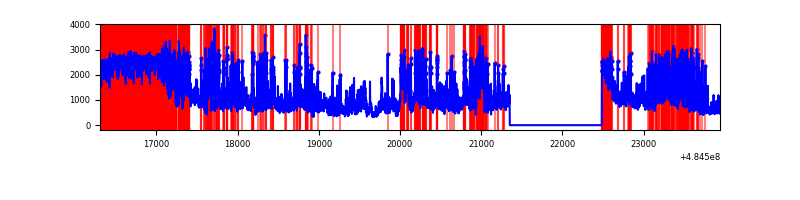 |
Top three noisy pixels from each quadrant. If the there are fewer than three noisy pixels in the level2.evt file, extra rows are filled as -1
| Pixel properties | Quadrant properties | ||||||
|---|---|---|---|---|---|---|---|
| Quadrant | DetID | PixID | Counts | Sigma | Mean | Median | Sigma |
| A | 7 | 64 | 1810785 | 11189.16 | 639 | 623 | 161.8 |
| A | 2 | 48 | 595743 | 3678.62 | 639 | 623 | 161.8 |
| A | 3 | 14 | 583793 | 3604.75 | 639 | 623 | 161.8 |
| B | 7 | 0 | 2438169 | 17774.88 | 655 | 634 | 137.1 |
| B | 4 | 206 | 400969 | 2919.3 | 655 | 634 | 137.1 |
| B | 4 | 171 | 318754 | 2319.78 | 655 | 634 | 137.1 |
| C | 15 | 224 | 3251084 | 18064.68 | 649 | 643 | 179.9 |
| C | 9 | 38 | 265276 | 1470.73 | 649 | 643 | 179.9 |
| C | 12 | 252 | 192487 | 1066.19 | 649 | 643 | 179.9 |
| D | 6 | 42 | 1661131 | 9541.01 | 598 | 567 | 174.0 |
| D | 13 | 170 | 1322984 | 7598.14 | 598 | 567 | 174.0 |
| D | 8 | 176 | 1319626 | 7578.84 | 598 | 567 | 174.0 |
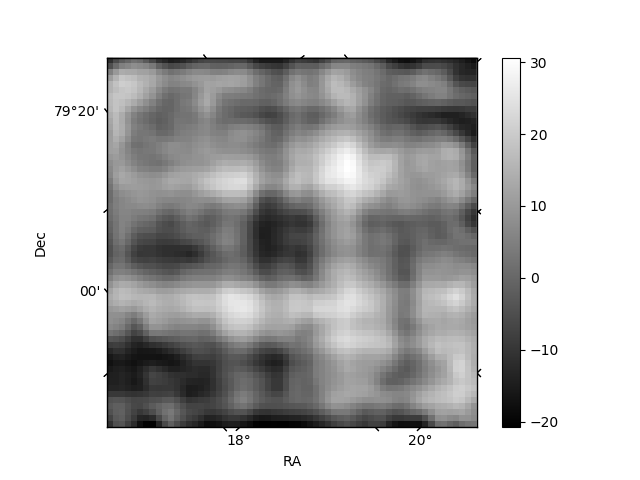
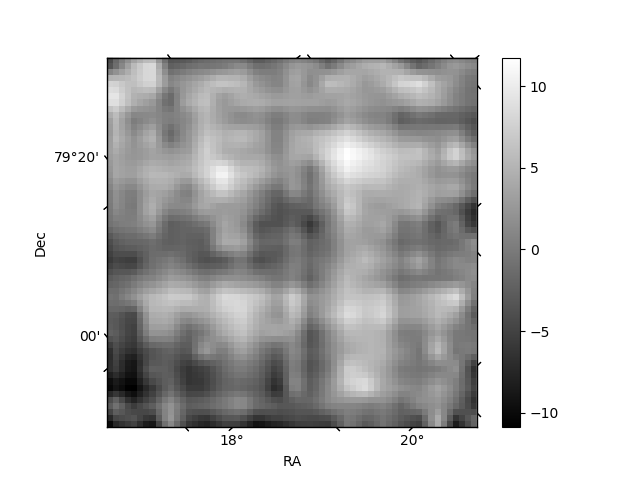
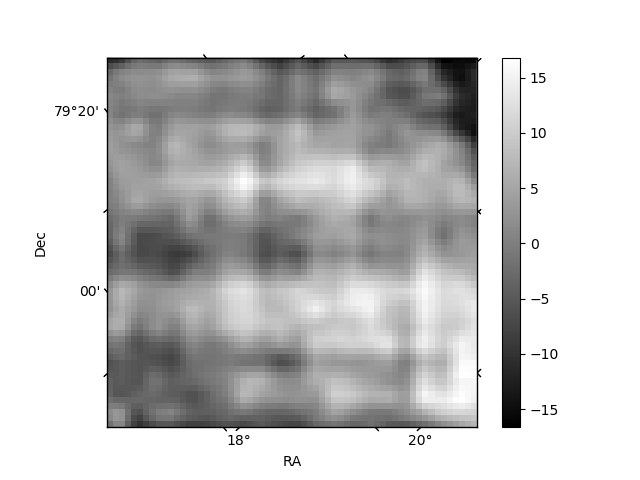
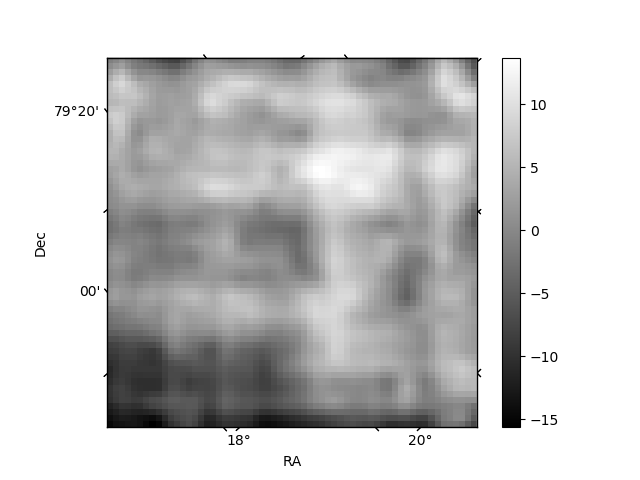
Histogram calculated using DETX and DETY for each event in the final _common_clean file
| Quadrant A | 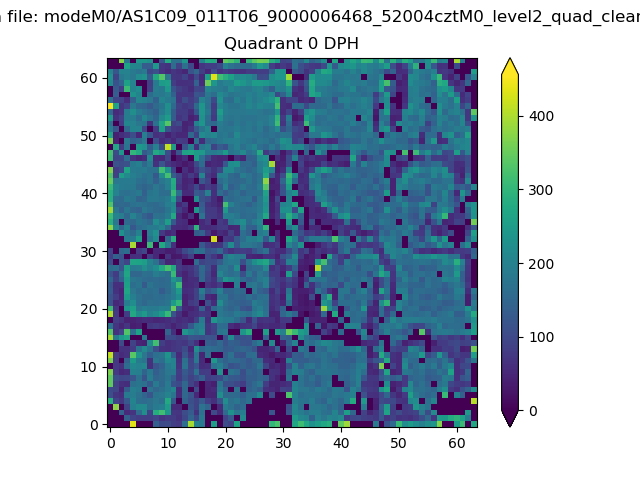 |
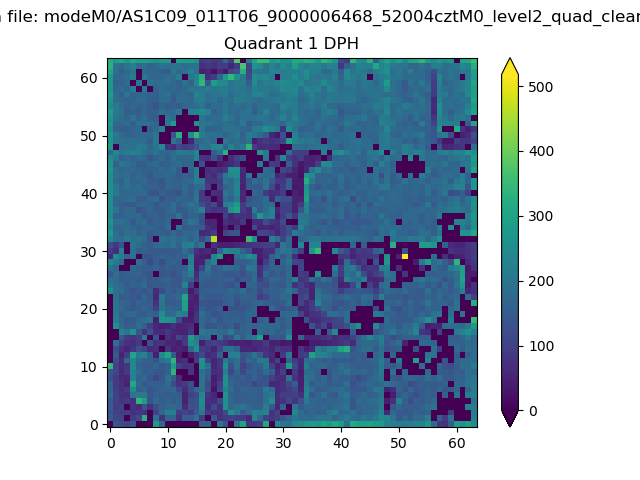 |
Quadrant B |
|---|---|---|---|
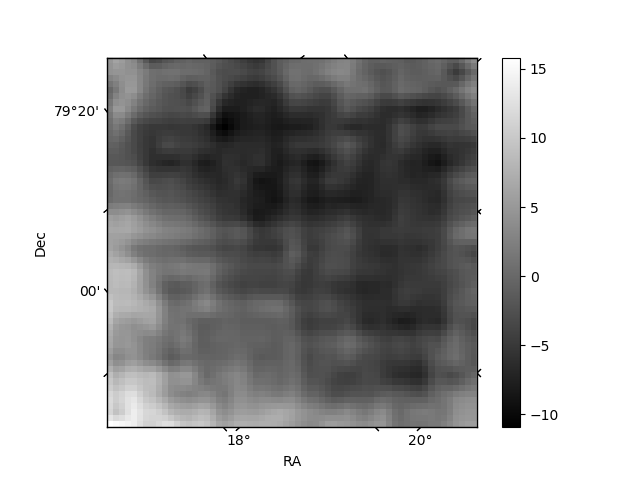
| Quadrant D | 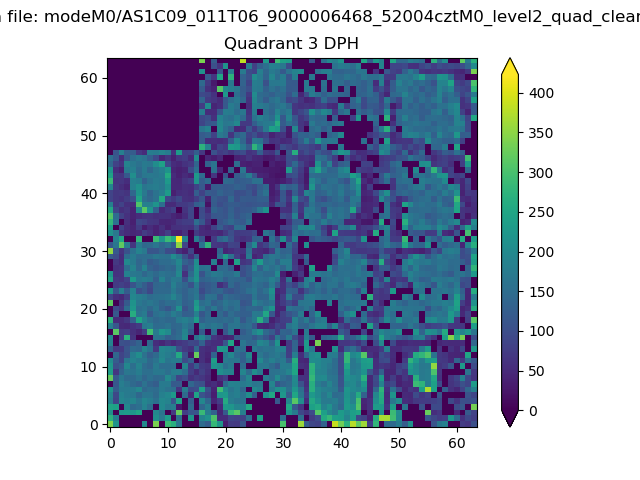 |
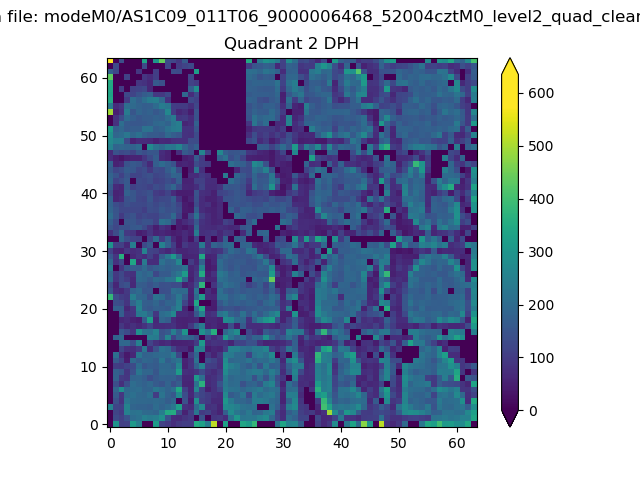 |
Quadrant C |
| Plot type | Count rate plots | Images |
|---|---|---|
| Comparison with Poisson distribution Blue bars denote a histogram of data divided into 1 sec bins. Red curve is a Poisson curve with rate = median count rate of data. |
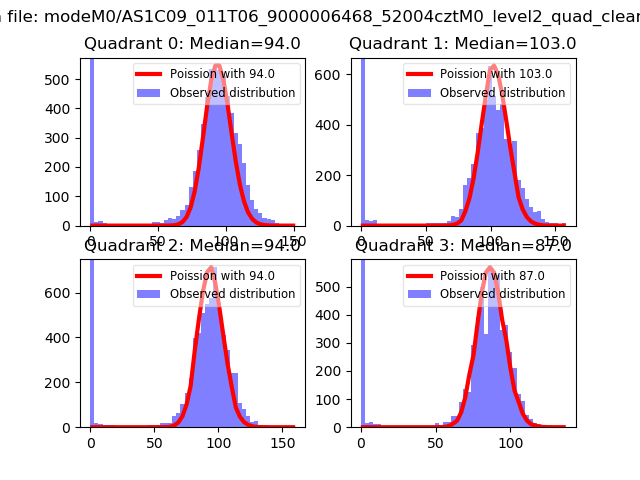 |
 |
| Quadrant-wise count rates Data is divided into 100 sec bins |
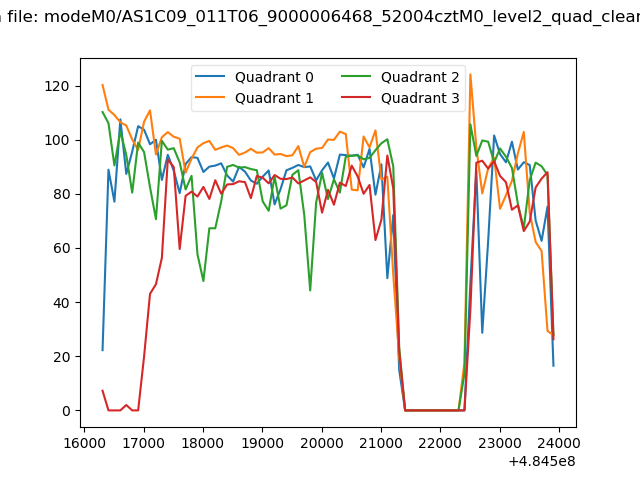 |
|
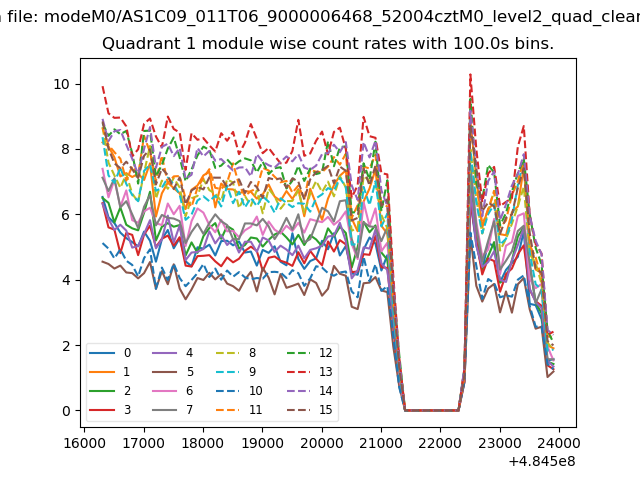
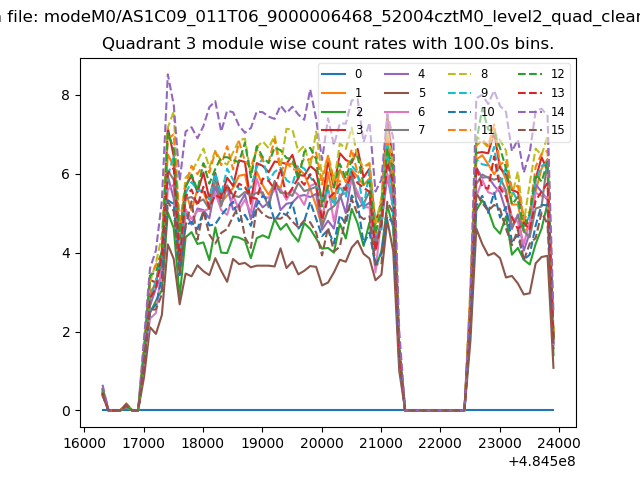
| Module-wise count rates for Quadrant A Data is divided into 100 sec bins |
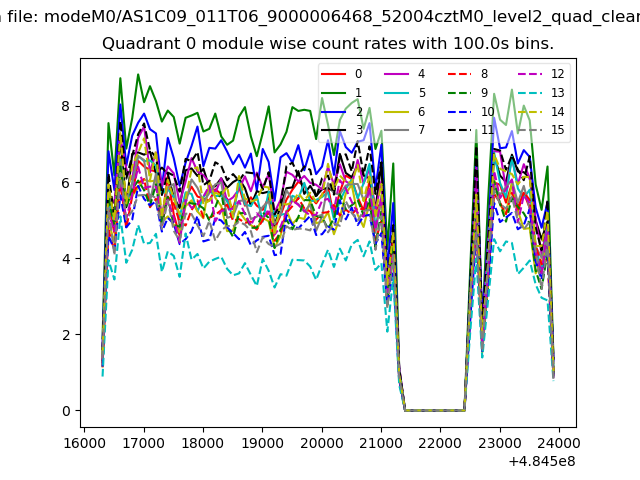 |
 |
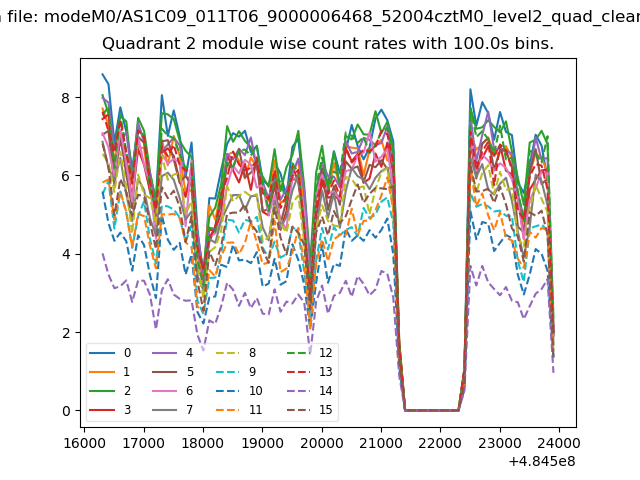
| Module-wise count rates for Quadrant B Data is divided into 100 sec bins |
 |
 |
| Module-wise count rates for Quadrant C Data is divided into 100 sec bins |
 |
 |
| Module-wise count rates for Quadrant D Data is divided into 100 sec bins |
 |
 |
| Parameter | Plot |
|---|---|
| CZT HV Monitor | 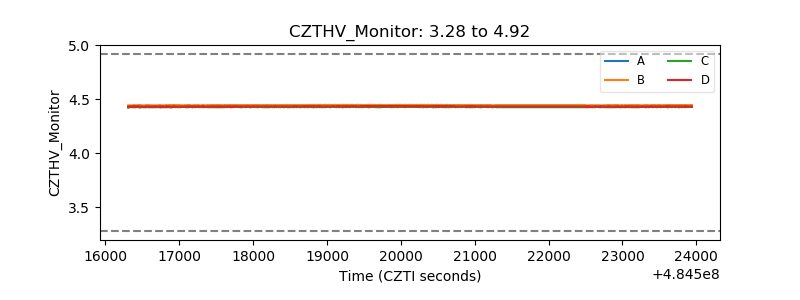 |
| D_VDD | 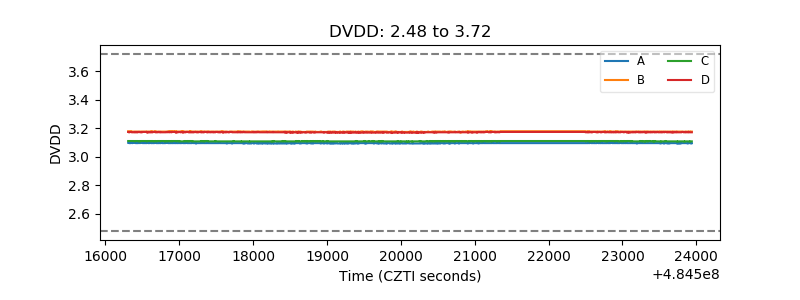 |
| Temperature 1 | 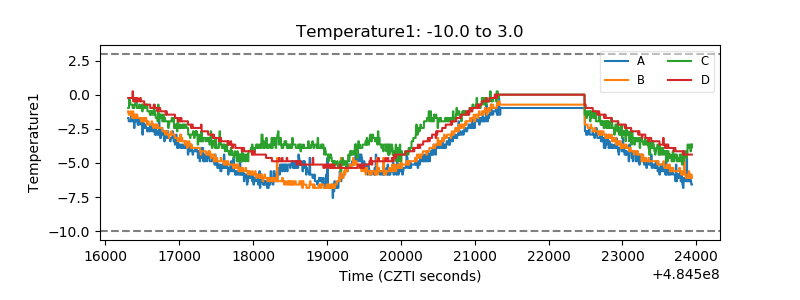 |
| Veto HV Monitor | 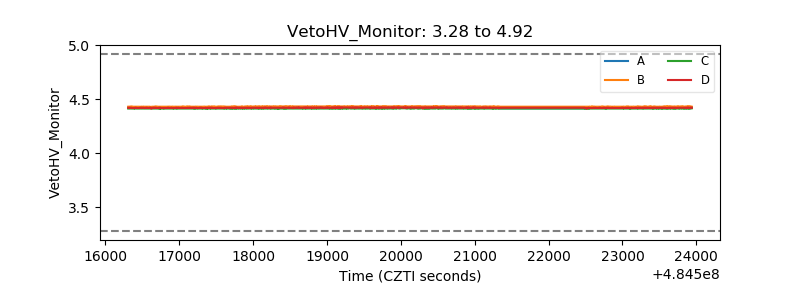 |
| Veto LLD | 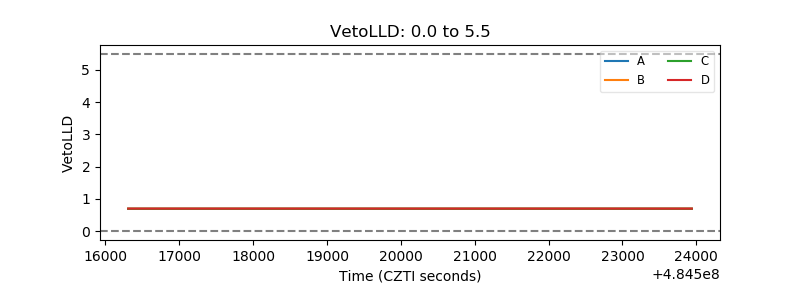 |
| Alpha Counter | 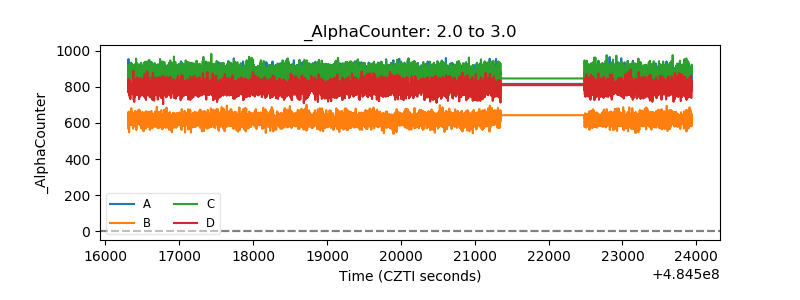 |
| _CPM_Rate | 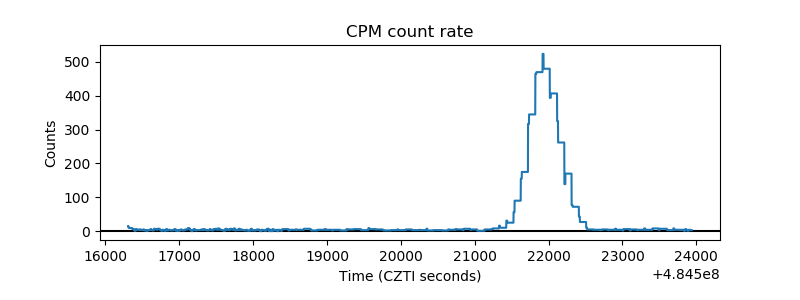 |
| CZT Counter | 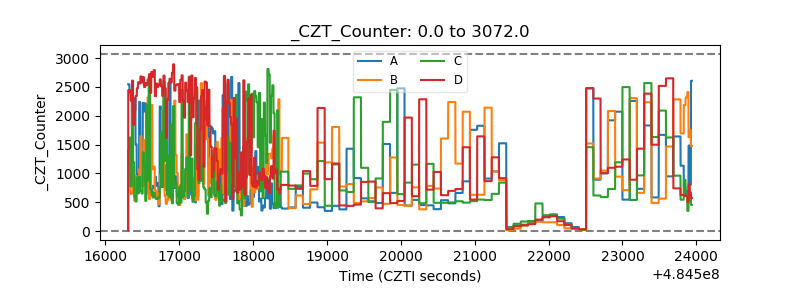 |
| +2.5 Volts monitor | 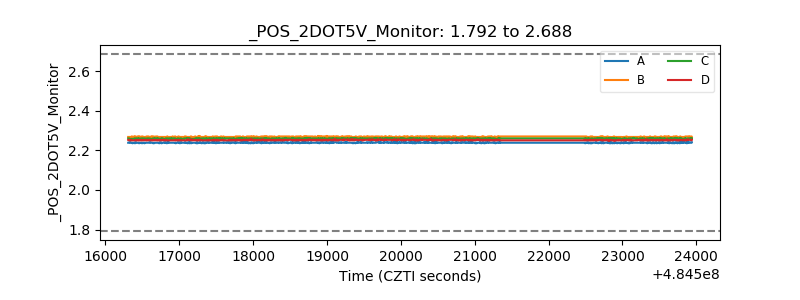 |
| +5 Volts monitor | 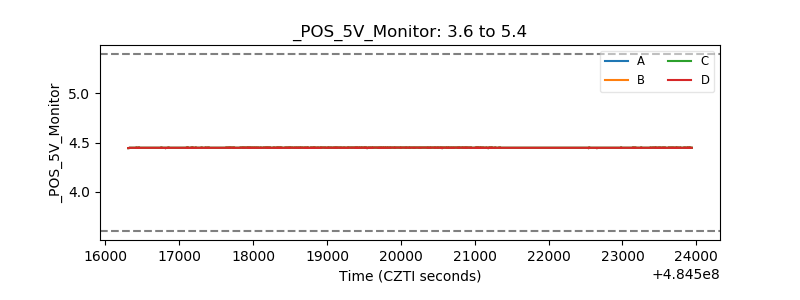 |
| _ROLL_ROT | 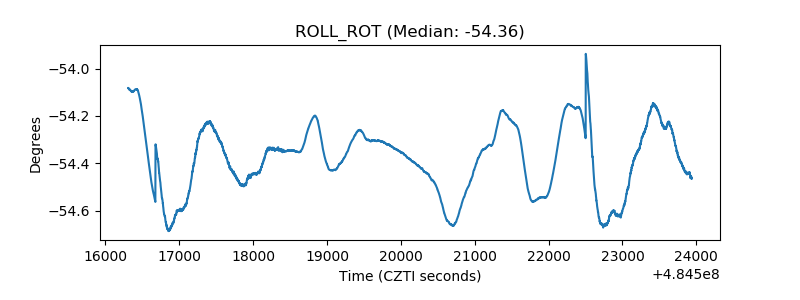 |
| _Roll_DEC | 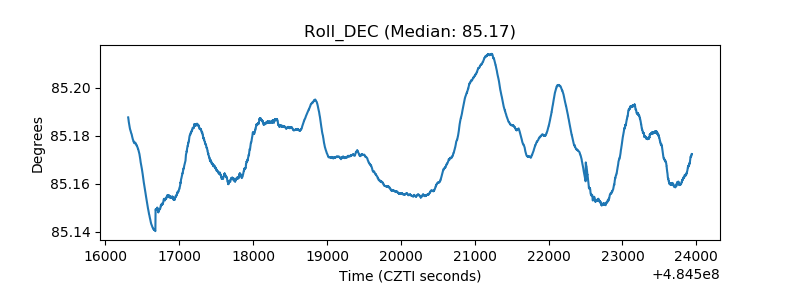 |
| _Roll_RA | 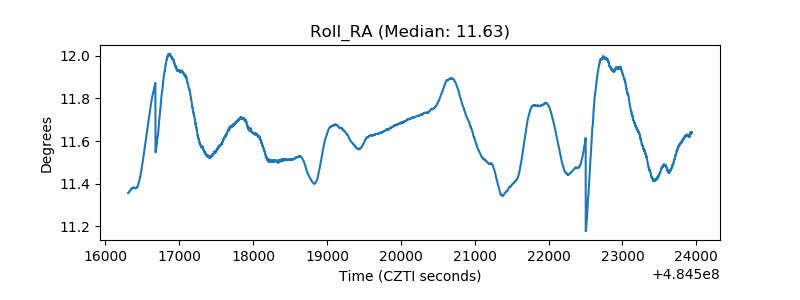 |
| Veto Counter | 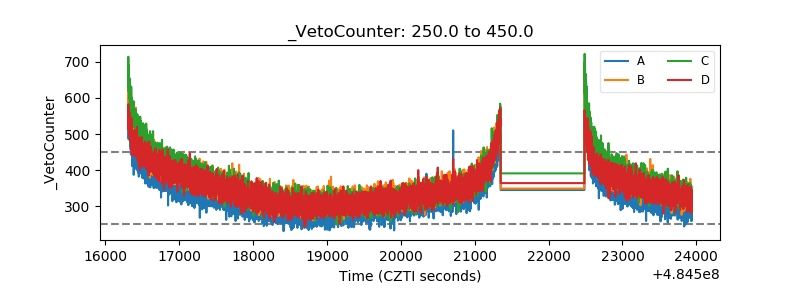 |