| Param | Original file | Final file |
|---|---|---|
| Filename | modeM0/AS1C09_011T06_9000006468_52005cztM0_level2.fits | modeM0/AS1C09_011T06_9000006468_52005cztM0_level2_quad_clean.evt |
| Size (bytes) | 876,058,560 | 79,116,480 |
| Size | 835.5 MB | 75.5 MB |
| Events in quadrant A | 9,914,008 | 389,284 |
| Events in quadrant B | 7,886,416 | 535,761 |
| Events in quadrant C | 6,588,437 | 541,836 |
| Events in quadrant D | 7,546,817 | 481,838 |
| Mode M0 | |||
|---|---|---|---|
| Quadrant | BADHDUFLAG | Total packets | Discarded packets |
| A | 0 | 33933 | 1 |
| B | 0 | 27872 | 1 |
| C | 0 | 24041 | 1 |
| D | 0 | 26951 | 1 |
| Mode M9 | |||
|---|---|---|---|
| Quadrant | BADHDUFLAG | Total packets | Discarded packets |
| A | 0 | 10 | 0 |
| B | 0 | 10 | 0 |
| C | 0 | 10 | 0 |
| D | 0 | 10 | 0 |
| Mode SS | |||
|---|---|---|---|
| Quadrant | BADHDUFLAG | Total packets | Discarded packets |
| A | 0 | 130 | 0 |
| B | 0 | 130 | 0 |
| C | 0 | 130 | 0 |
| D | 0 | 130 | 0 |
| Quadrant | Total seconds | Saturated seconds | Saturation percentage |
|---|---|---|---|
| A | 6395 | 2581 | 40.359656% |
| B | 6394 | 1490 | 23.303097% |
| C | 6394 | 882 | 13.794182% |
| D | 6394 | 1060 | 16.578042% |
Noise dominated data is calculated using 1-second bins in cleaned event files. If a bin has >2000 counts, and if more than 50% of those come from <1% of pixels, then it is considered to be noise-dominated and hence unusable.
| Quadrant | # 1 sec bins | Bins with >0 counts | Bins with >2000 counts | High rate bins dominated by noise | Noise dominated (total time) | Noise dominated (detector-on time) | Marked lightcurve |
|---|---|---|---|---|---|---|---|
| A | 7435 | 6396 | 2314 | 2314 | 31.12% | 36.18% | 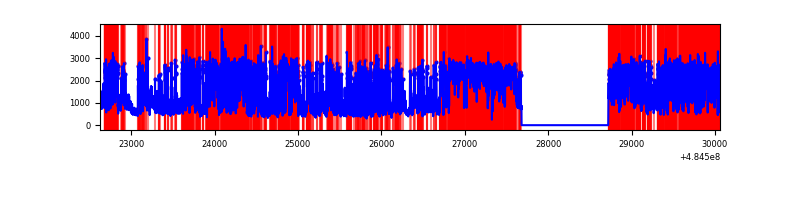 |
| B | 7434 | 6395 | 874 | 874 | 11.76% | 13.67% | 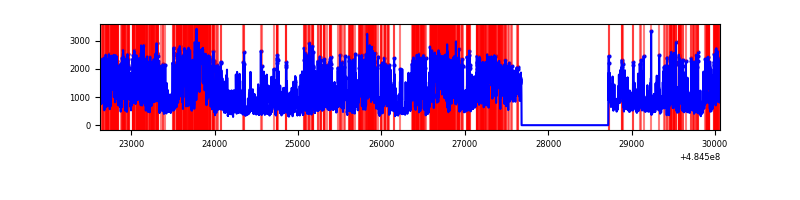 |
| C | 7434 | 6395 | 829 | 829 | 11.15% | 12.96% | 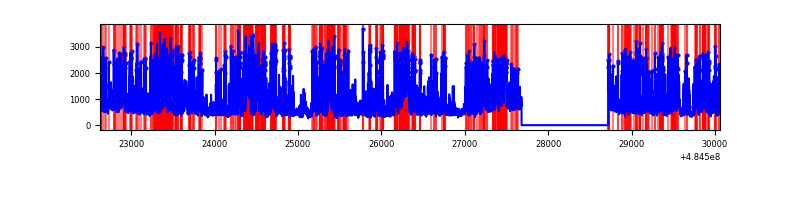 |
| D | 7433 | 6394 | 956 | 956 | 12.86% | 14.95% | 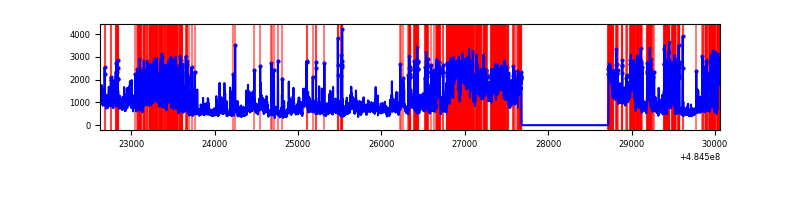 |
Top three noisy pixels from each quadrant. If the there are fewer than three noisy pixels in the level2.evt file, extra rows are filled as -1
| Pixel properties | Quadrant properties | ||||||
|---|---|---|---|---|---|---|---|
| Quadrant | DetID | PixID | Counts | Sigma | Mean | Median | Sigma |
| A | 7 | 64 | 4759326 | 35438.35 | 532 | 520 | 134.3 |
| A | 2 | 48 | 1700510 | 12659.66 | 532 | 520 | 134.3 |
| A | 3 | 14 | 453540 | 3373.59 | 532 | 520 | 134.3 |
| B | 7 | 0 | 3810002 | 29165.22 | 615 | 595 | 130.6 |
| B | 4 | 206 | 428485 | 3275.97 | 615 | 595 | 130.6 |
| B | 4 | 171 | 192187 | 1466.85 | 615 | 595 | 130.6 |
| C | 15 | 224 | 2728728 | 15918.76 | 617 | 611 | 171.4 |
| C | 13 | 3 | 446630 | 2602.55 | 617 | 611 | 171.4 |
| C | 7 | 190 | 381276 | 2221.21 | 617 | 611 | 171.4 |
| D | 6 | 42 | 1736347 | 10029.7 | 601 | 573 | 173.1 |
| D | 8 | 176 | 901296 | 5204.58 | 601 | 573 | 173.1 |
| D | 13 | 170 | 654869 | 3780.67 | 601 | 573 | 173.1 |
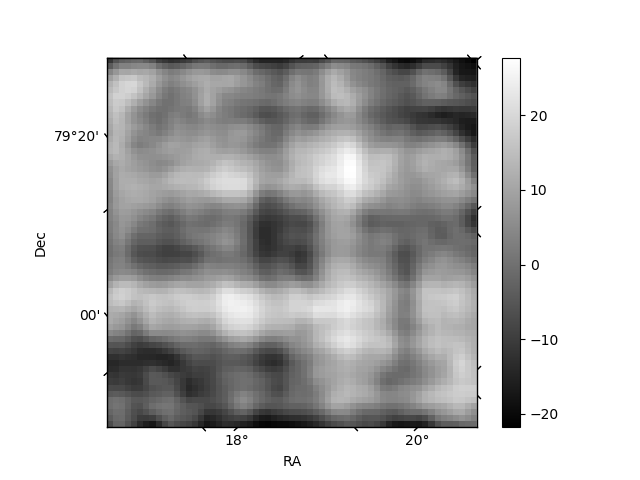
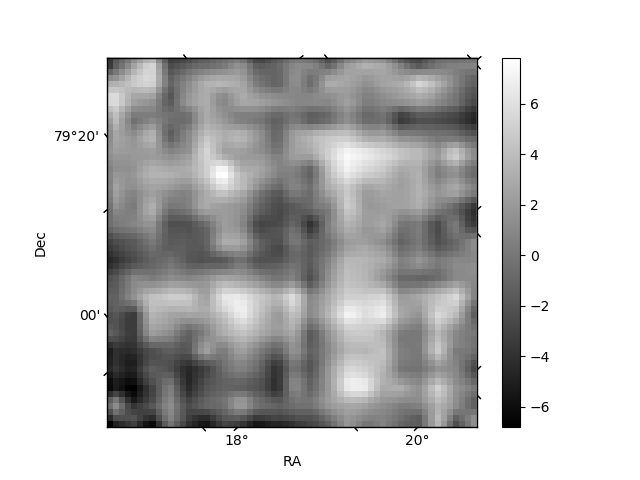
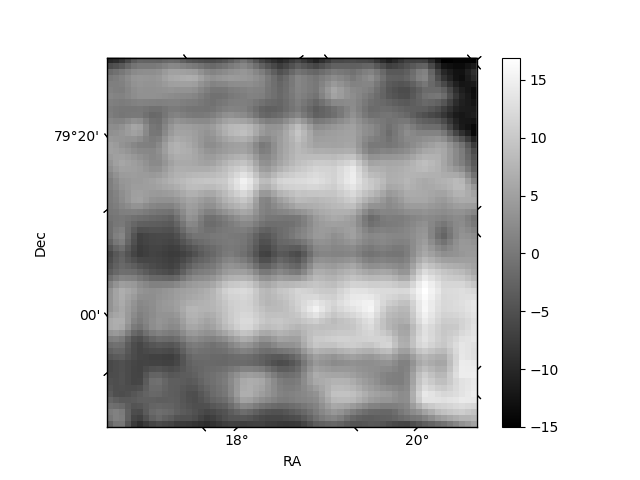
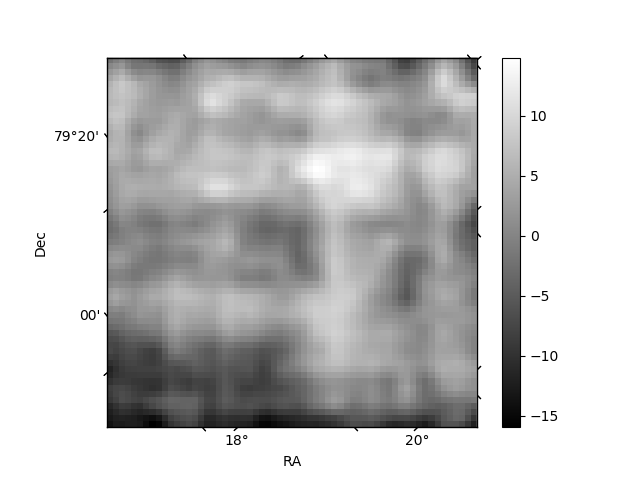
Histogram calculated using DETX and DETY for each event in the final _common_clean file
| Quadrant A | 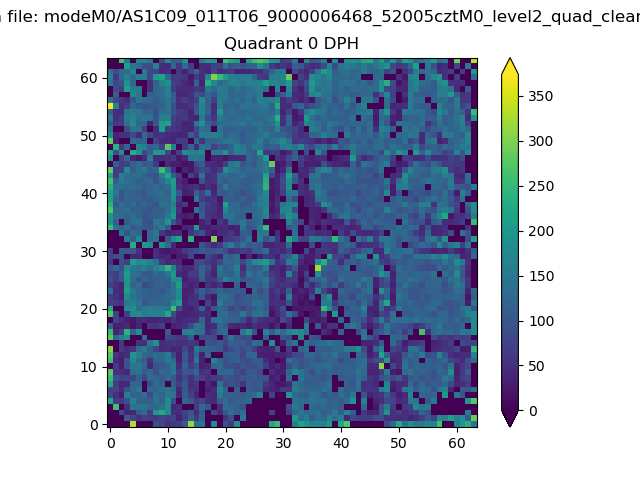 |
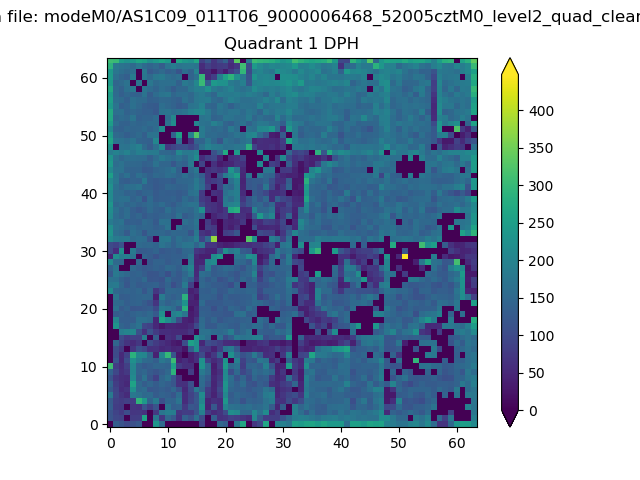 |
Quadrant B |
|---|---|---|---|
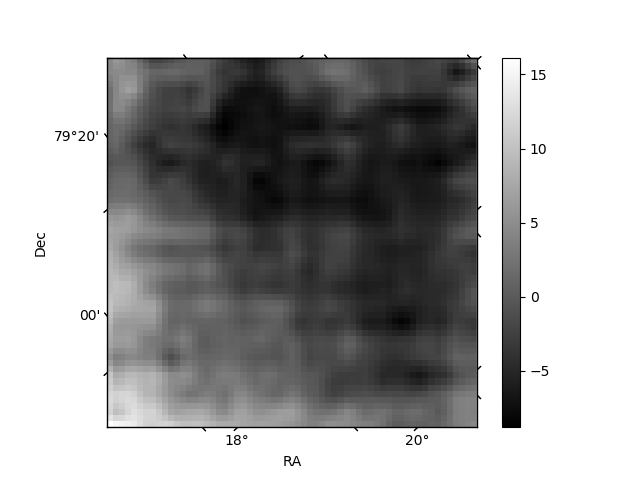
| Quadrant D | 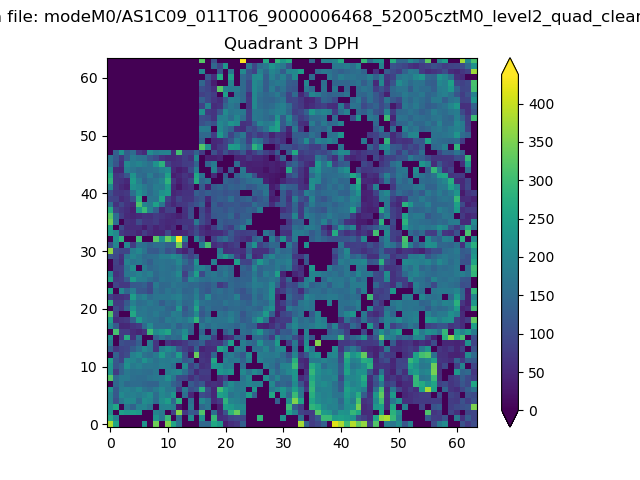 |
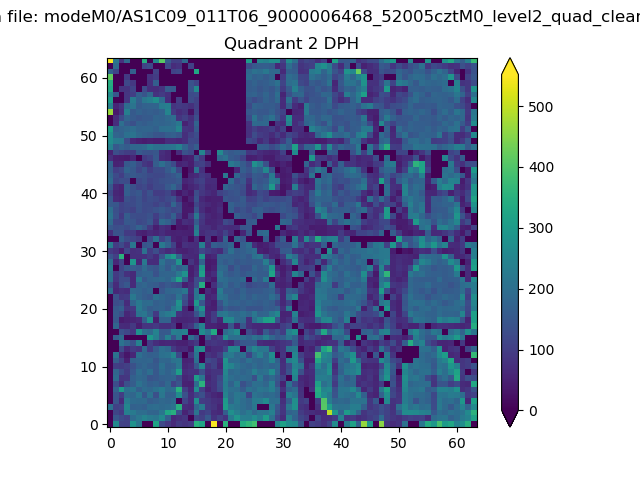 |
Quadrant C |
| Plot type | Count rate plots | Images |
|---|---|---|
| Comparison with Poisson distribution Blue bars denote a histogram of data divided into 1 sec bins. Red curve is a Poisson curve with rate = median count rate of data. |
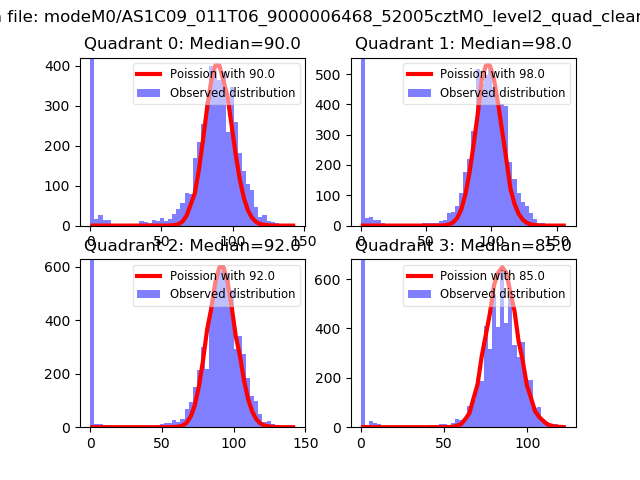 |
 |
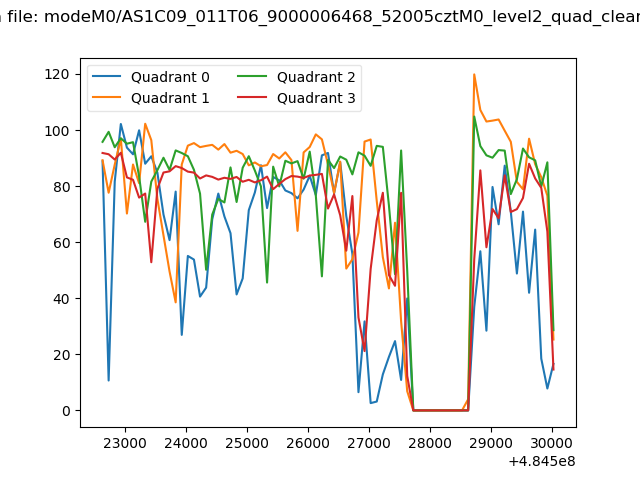
| Quadrant-wise count rates Data is divided into 100 sec bins |
 |
|
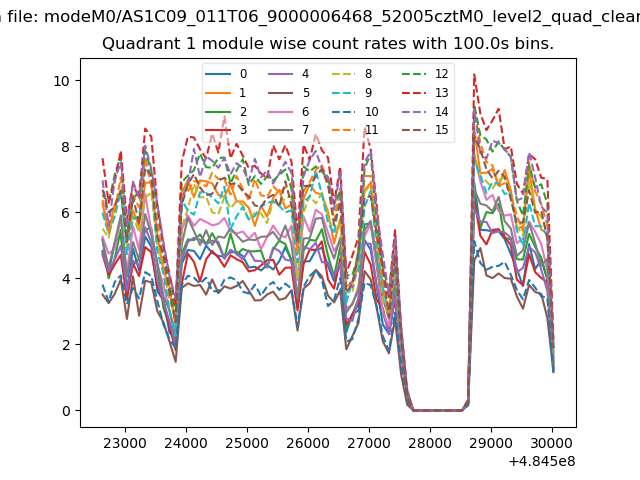
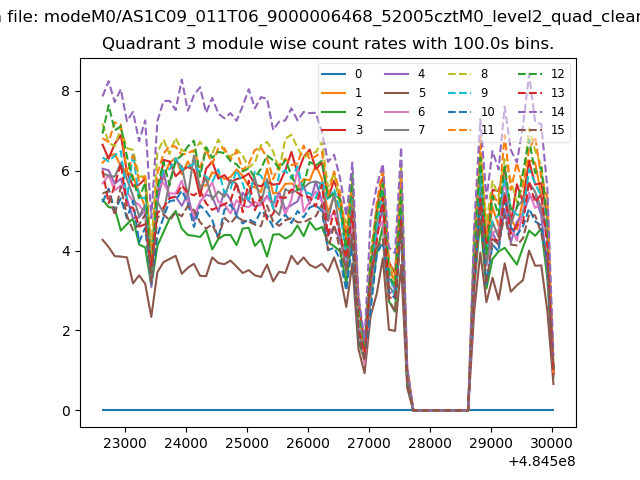
| Module-wise count rates for Quadrant A Data is divided into 100 sec bins |
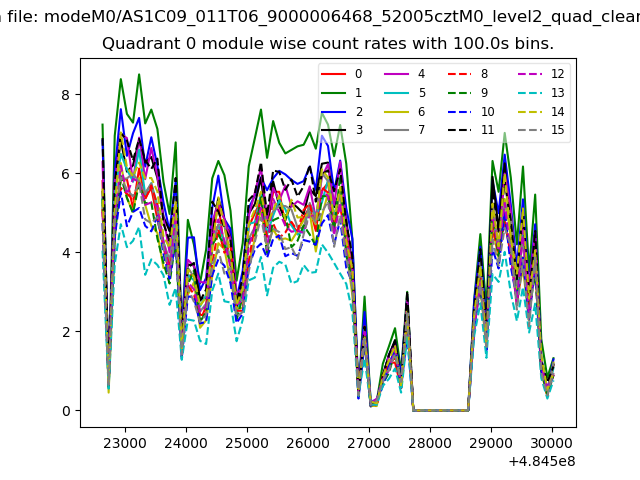 |
 |
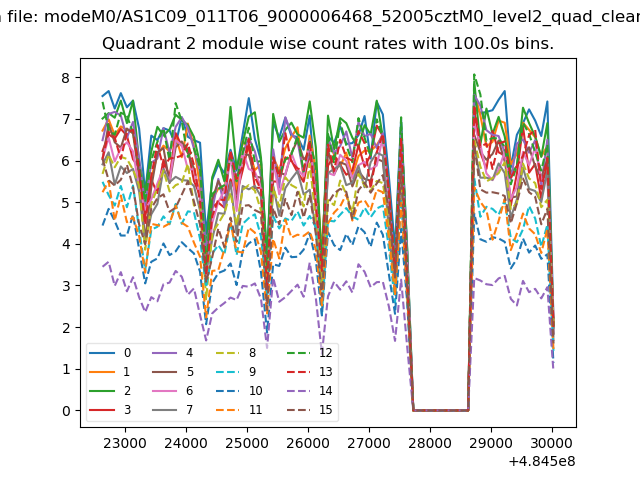
| Module-wise count rates for Quadrant B Data is divided into 100 sec bins |
 |
 |
| Module-wise count rates for Quadrant C Data is divided into 100 sec bins |
 |
 |
| Module-wise count rates for Quadrant D Data is divided into 100 sec bins |
 |
 |
| Parameter | Plot |
|---|---|
| CZT HV Monitor | 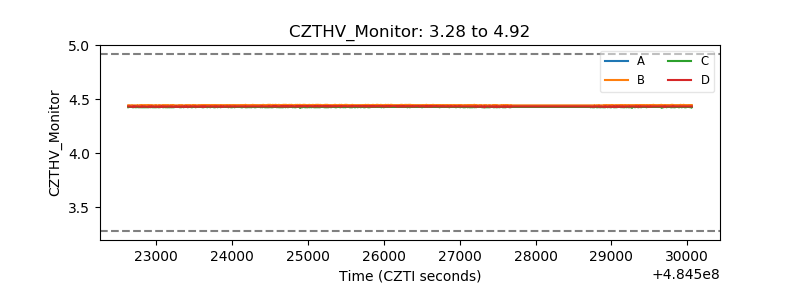 |
| D_VDD | 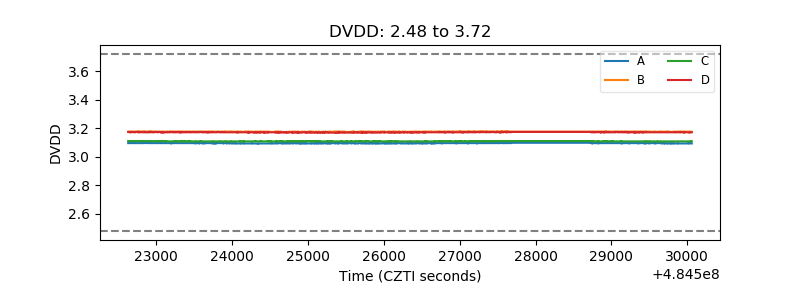 |
| Temperature 1 | 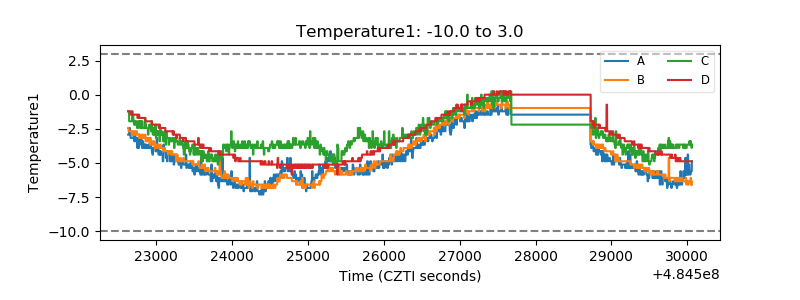 |
| Veto HV Monitor |  |
| Veto LLD | 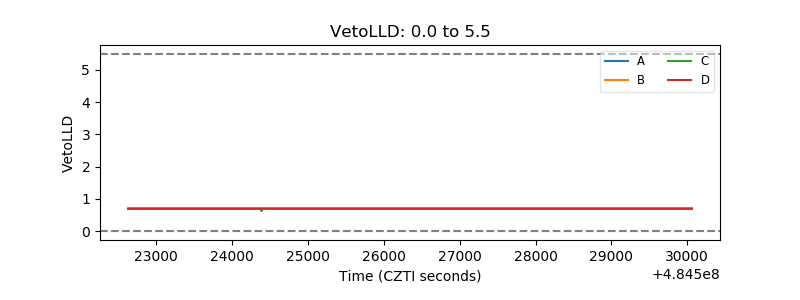 |
| Alpha Counter | 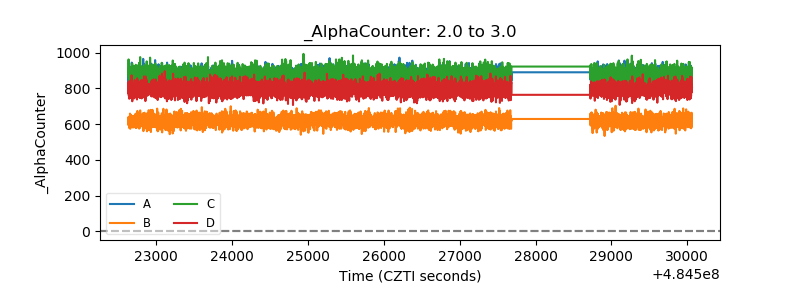 |
| _CPM_Rate | 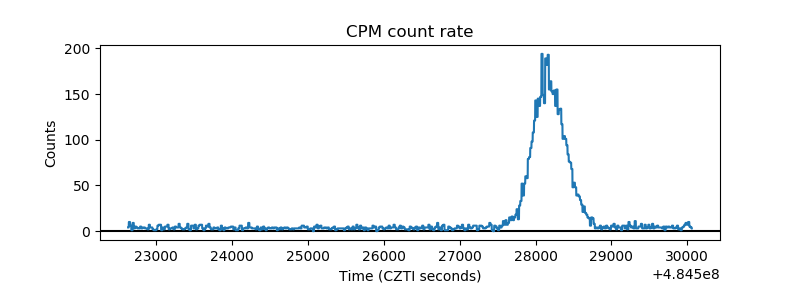 |
| CZT Counter | 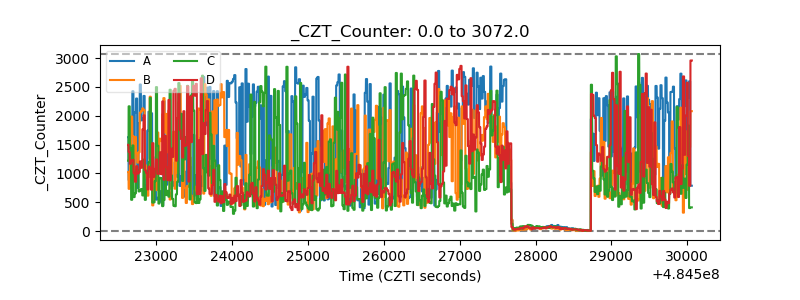 |
| +2.5 Volts monitor | 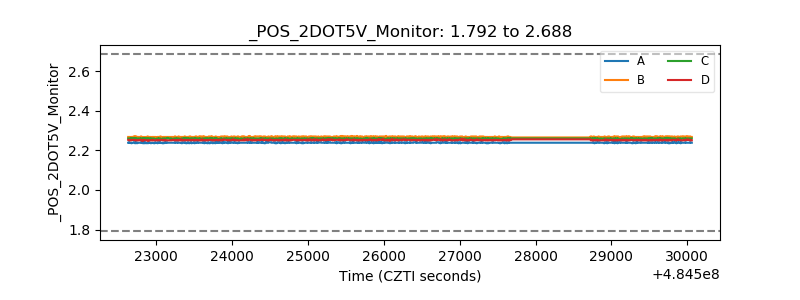 |
| +5 Volts monitor | 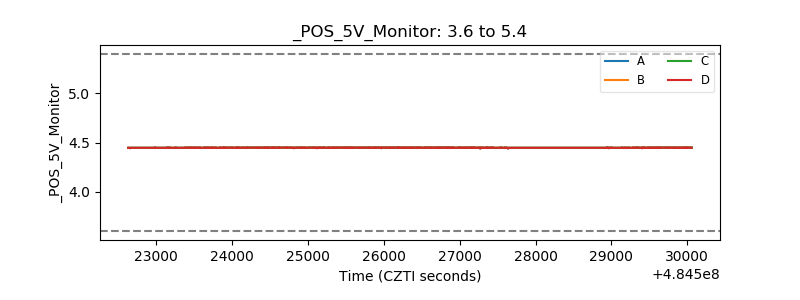 |
| _ROLL_ROT | 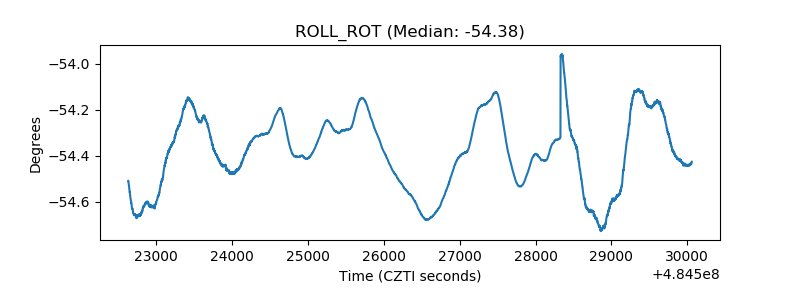 |
| _Roll_DEC | 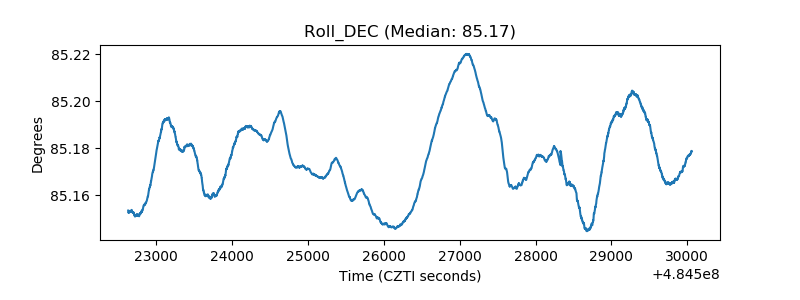 |
| _Roll_RA | 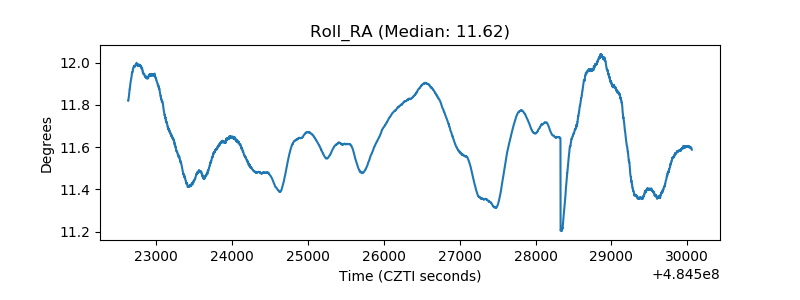 |
| Veto Counter | 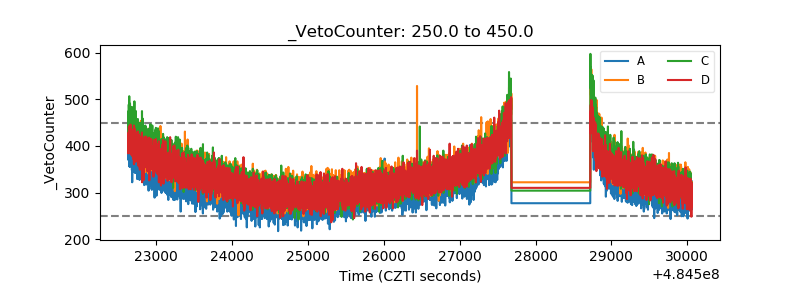 |