| Param | Original file | Final file |
|---|---|---|
| Filename | modeM0/AS1C09_011T06_9000006468_52006cztM0_level2.fits | modeM0/AS1C09_011T06_9000006468_52006cztM0_level2_quad_clean.evt |
| Size (bytes) | 992,923,200 | 88,225,920 |
| Size | 946.9 MB | 84.1 MB |
| Events in quadrant A | 10,406,542 | 461,140 |
| Events in quadrant B | 8,369,521 | 611,519 |
| Events in quadrant C | 9,352,766 | 523,799 |
| Events in quadrant D | 8,061,232 | 564,948 |
| Mode M0 | |||
|---|---|---|---|
| Quadrant | BADHDUFLAG | Total packets | Discarded packets |
| A | 0 | 35977 | 1 |
| B | 0 | 30060 | 1 |
| C | 0 | 32867 | 1 |
| D | 0 | 29060 | 1 |
| Mode M9 | |||
|---|---|---|---|
| Quadrant | BADHDUFLAG | Total packets | Discarded packets |
| A | 0 | 7 | 0 |
| B | 0 | 7 | 0 |
| C | 0 | 7 | 0 |
| D | 0 | 7 | 0 |
| Mode SS | |||
|---|---|---|---|
| Quadrant | BADHDUFLAG | Total packets | Discarded packets |
| A | 0 | 146 | 0 |
| B | 0 | 146 | 0 |
| C | 0 | 146 | 0 |
| D | 0 | 146 | 0 |
| Quadrant | Total seconds | Saturated seconds | Saturation percentage |
|---|---|---|---|
| A | 7322 | 2624 | 35.837203% |
| B | 7323 | 1570 | 21.439301% |
| C | 7323 | 1889 | 25.795439% |
| D | 7323 | 936 | 12.781647% |
Noise dominated data is calculated using 1-second bins in cleaned event files. If a bin has >2000 counts, and if more than 50% of those come from <1% of pixels, then it is considered to be noise-dominated and hence unusable.
| Quadrant | # 1 sec bins | Bins with >0 counts | Bins with >2000 counts | High rate bins dominated by noise | Noise dominated (total time) | Noise dominated (detector-on time) | Marked lightcurve |
|---|---|---|---|---|---|---|---|
| A | 7927 | 7322 | 2232 | 2232 | 28.16% | 30.48% | 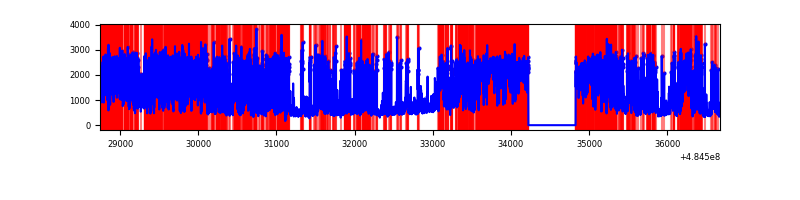 |
| B | 7928 | 7323 | 859 | 859 | 10.84% | 11.73% | 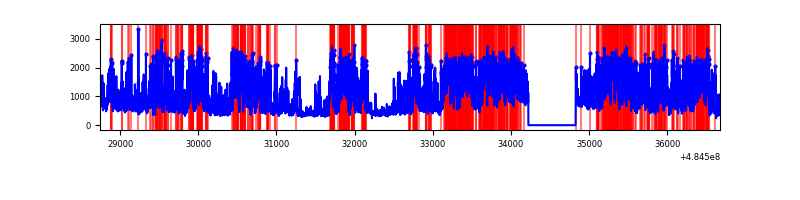 |
| C | 7928 | 7324 | 1861 | 1861 | 23.47% | 25.41% | 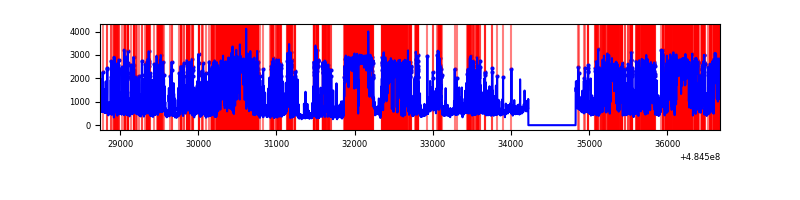 |
| D | 7928 | 7324 | 870 | 870 | 10.97% | 11.88% | 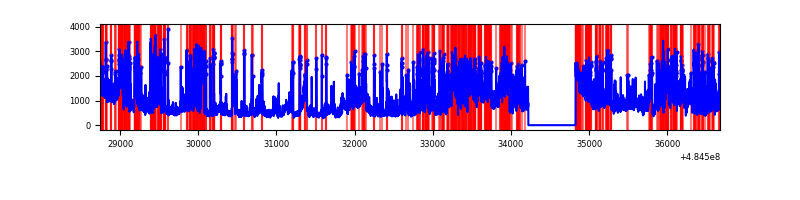 |
Top three noisy pixels from each quadrant. If the there are fewer than three noisy pixels in the level2.evt file, extra rows are filled as -1
| Pixel properties | Quadrant properties | ||||||
|---|---|---|---|---|---|---|---|
| Quadrant | DetID | PixID | Counts | Sigma | Mean | Median | Sigma |
| A | 7 | 64 | 4110334 | 26240.22 | 620 | 604 | 156.6 |
| A | 2 | 48 | 2507393 | 16005.6 | 620 | 604 | 156.6 |
| A | 8 | 246 | 323371 | 2060.84 | 620 | 604 | 156.6 |
| B | 7 | 0 | 4252602 | 28473.05 | 708 | 683 | 149.3 |
| B | 4 | 171 | 327679 | 2189.73 | 708 | 683 | 149.3 |
| B | 4 | 206 | 312001 | 2084.74 | 708 | 683 | 149.3 |
| C | 15 | 224 | 3767128 | 20580.18 | 659 | 653 | 183.0 |
| C | 13 | 3 | 890052 | 4859.71 | 659 | 653 | 183.0 |
| C | 7 | 190 | 682894 | 3727.79 | 659 | 653 | 183.0 |
| D | 6 | 42 | 1024588 | 5161.75 | 693 | 662 | 198.4 |
| D | 2 | 172 | 835184 | 4206.94 | 693 | 662 | 198.4 |
| D | 8 | 176 | 634731 | 3196.43 | 693 | 662 | 198.4 |
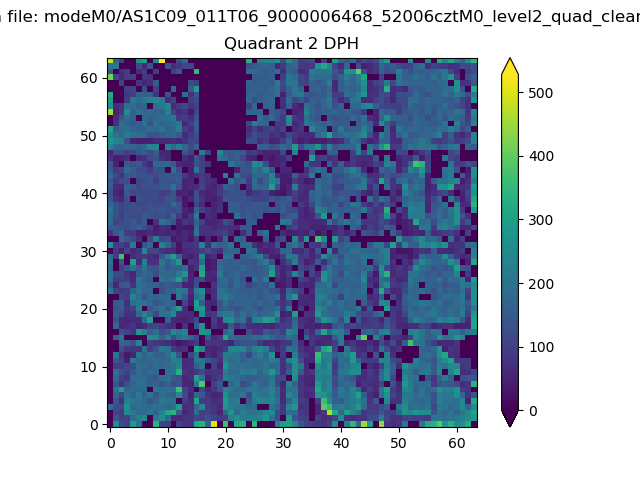
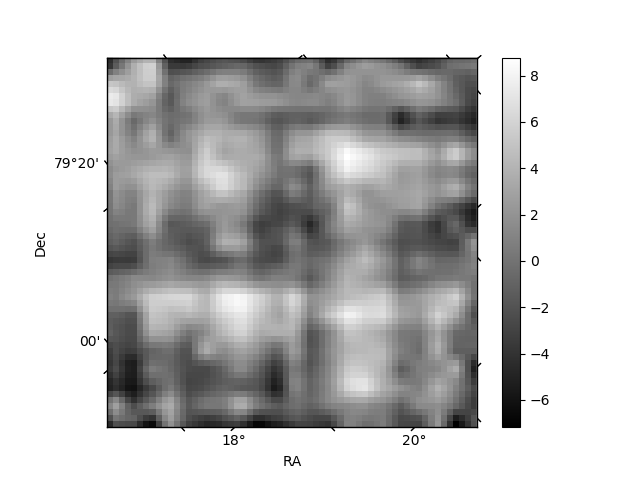
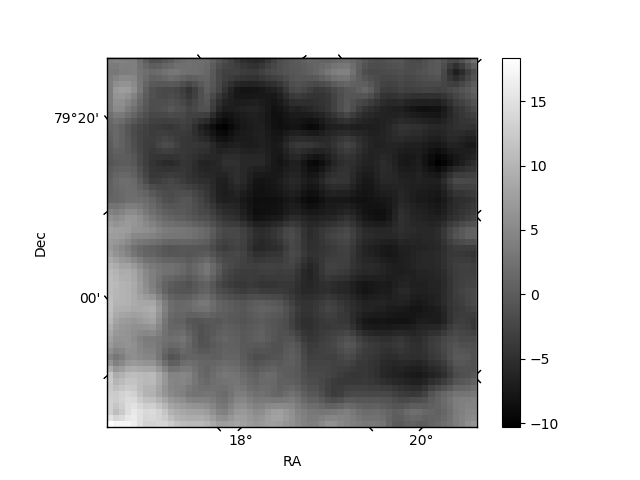
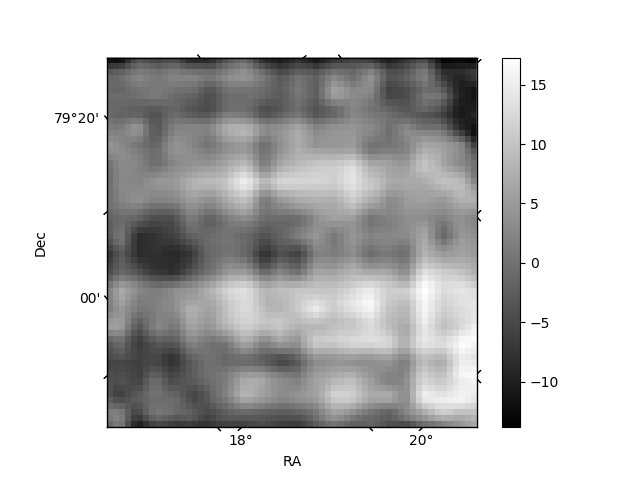
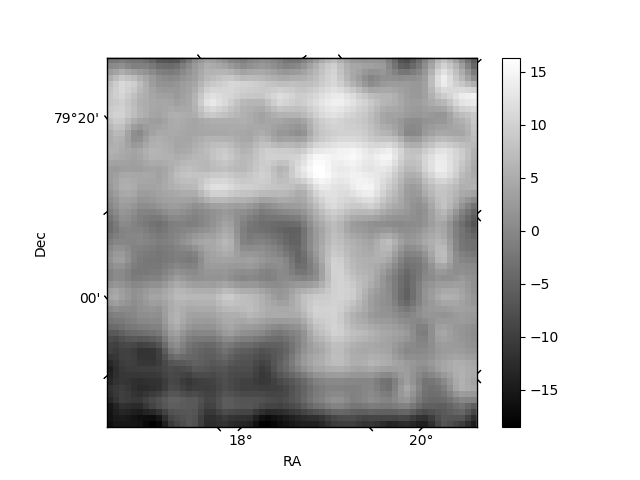
Histogram calculated using DETX and DETY for each event in the final _common_clean file
| Quadrant A | 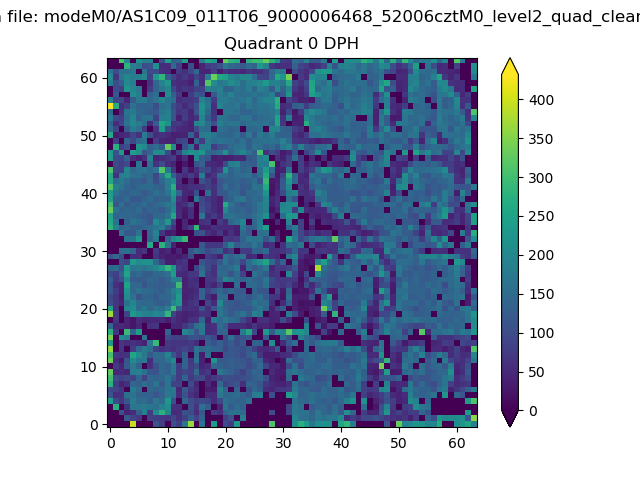 |
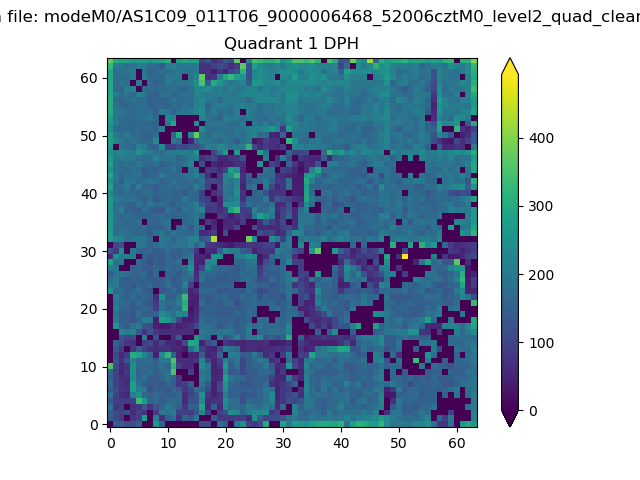 |
Quadrant B |
|---|---|---|---|
| Quadrant D | 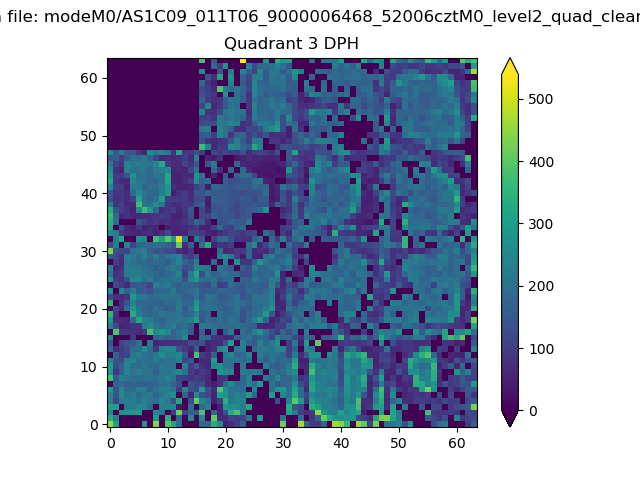 |
 |
Quadrant C |
| Plot type | Count rate plots | Images |
|---|---|---|
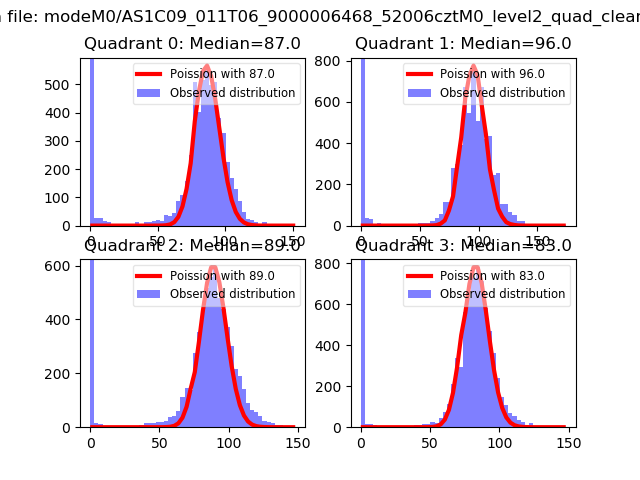
| Comparison with Poisson distribution Blue bars denote a histogram of data divided into 1 sec bins. Red curve is a Poisson curve with rate = median count rate of data. |
 |
 |
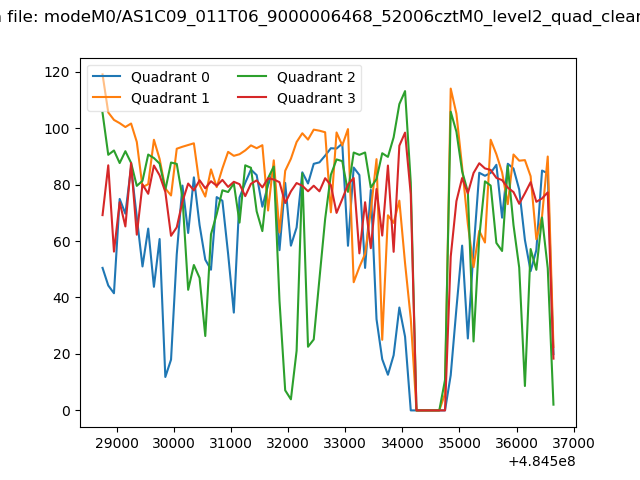
| Quadrant-wise count rates Data is divided into 100 sec bins |
 |
|
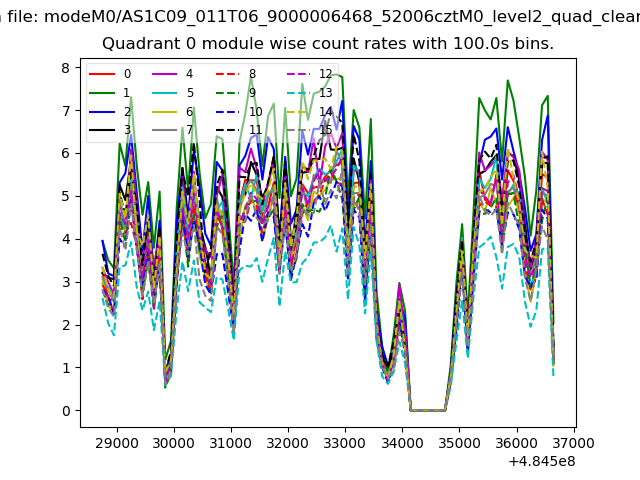
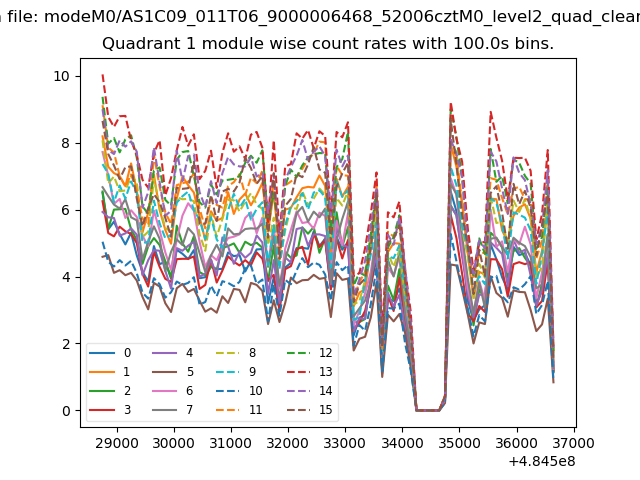
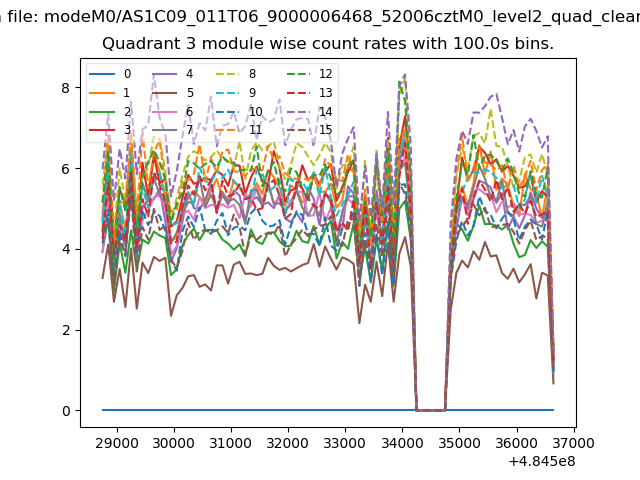
| Module-wise count rates for Quadrant A Data is divided into 100 sec bins |
 |
 |
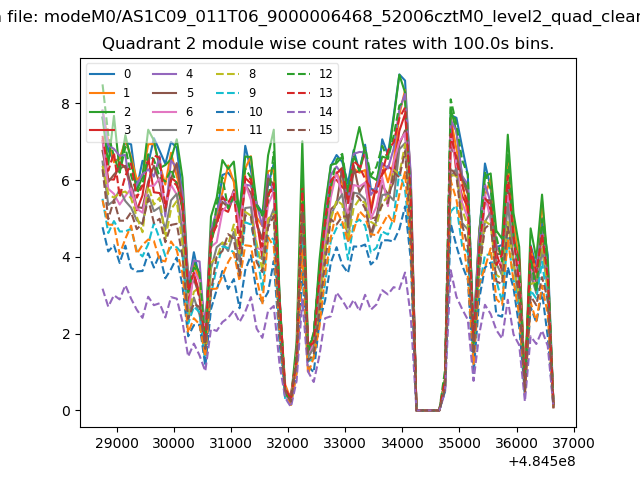
| Module-wise count rates for Quadrant B Data is divided into 100 sec bins |
 |
 |
| Module-wise count rates for Quadrant C Data is divided into 100 sec bins |
 |
 |
| Module-wise count rates for Quadrant D Data is divided into 100 sec bins |
 |
 |
| Parameter | Plot |
|---|---|
| CZT HV Monitor | 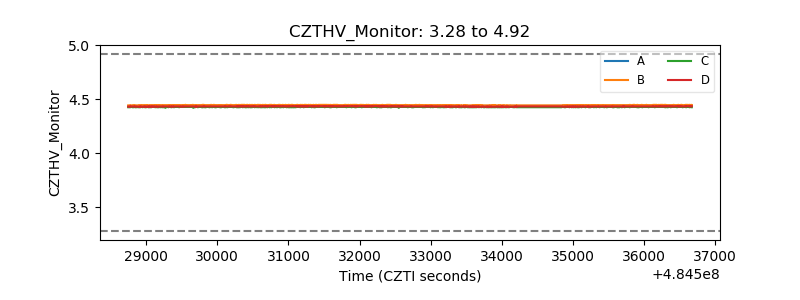 |
| D_VDD | 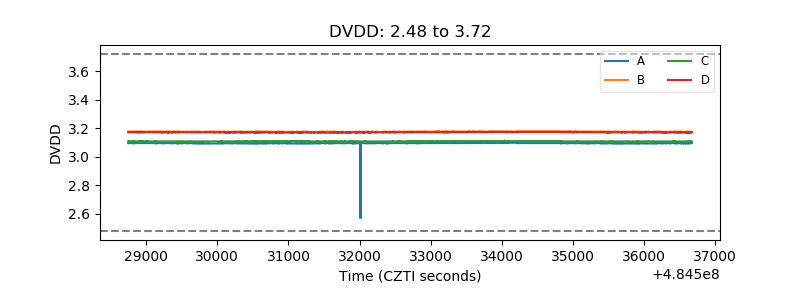 |
| Temperature 1 |  |
| Veto HV Monitor | 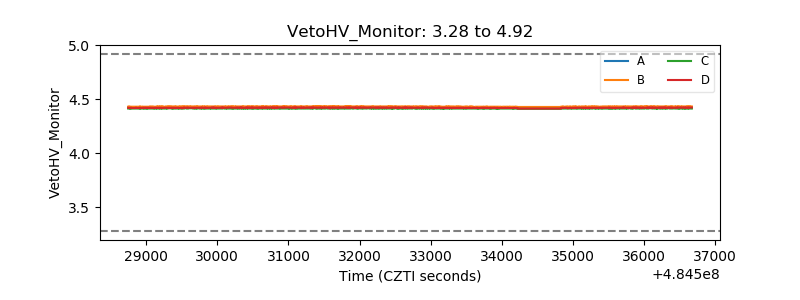 |
| Veto LLD | 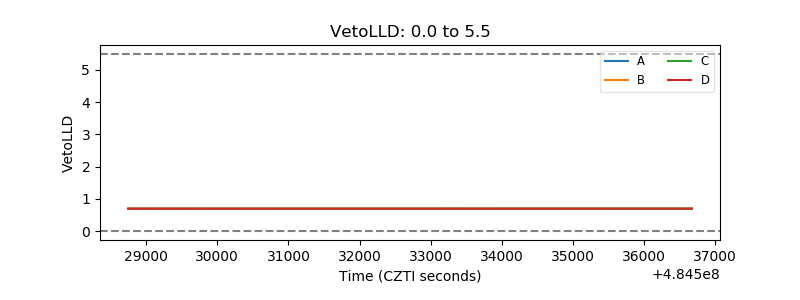 |
| Alpha Counter | 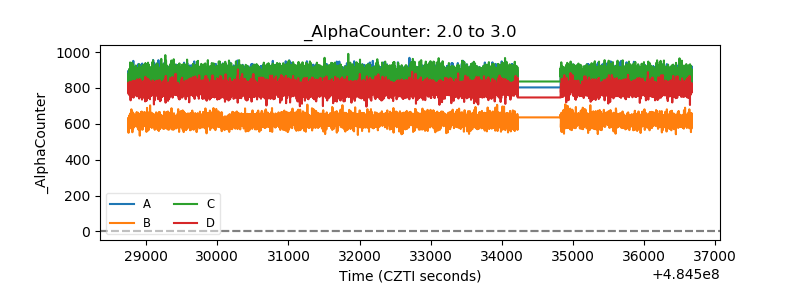 |
| _CPM_Rate | 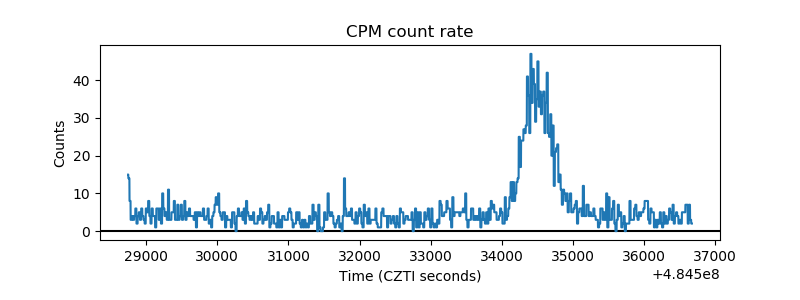 |
| CZT Counter | 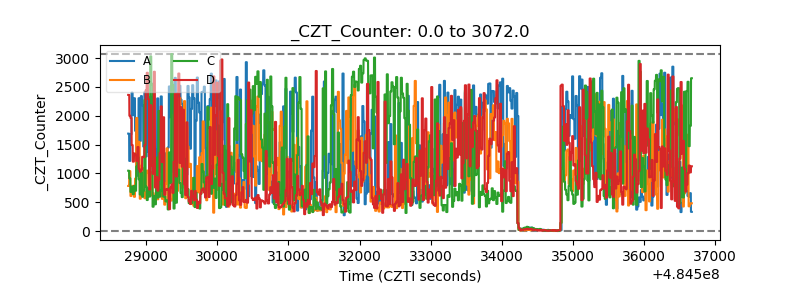 |
| +2.5 Volts monitor | 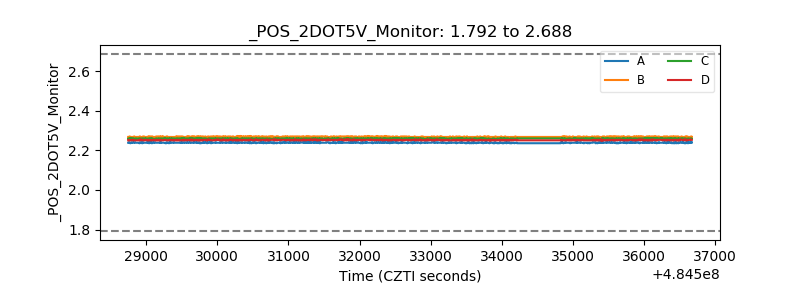 |
| +5 Volts monitor | 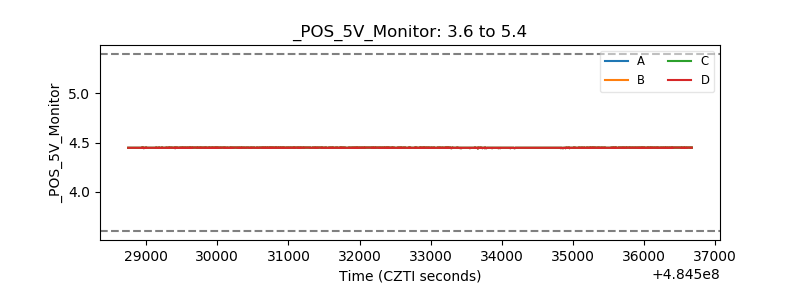 |
| _ROLL_ROT | 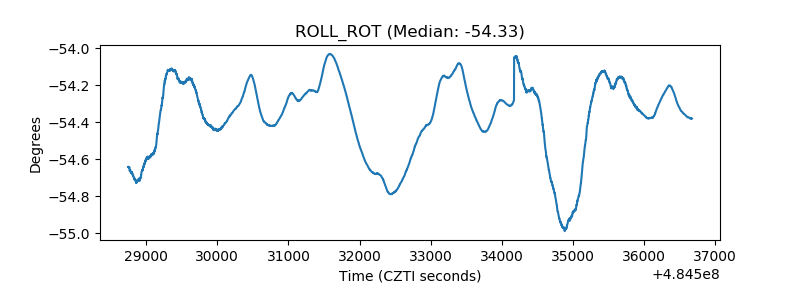 |
| _Roll_DEC | 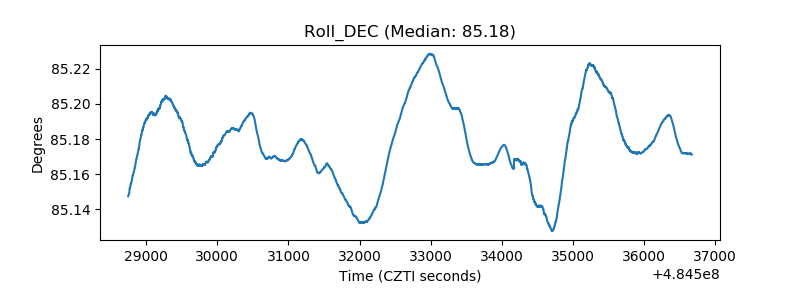 |
| _Roll_RA | 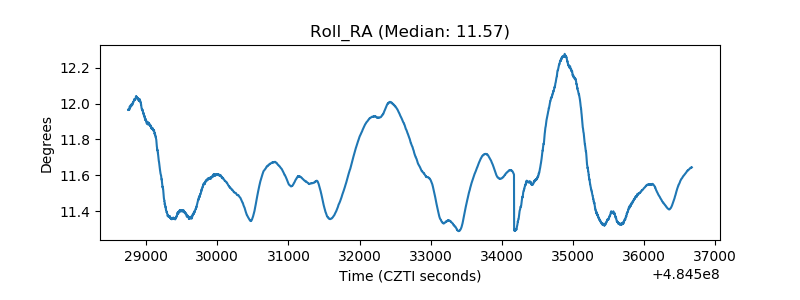 |
| Veto Counter | 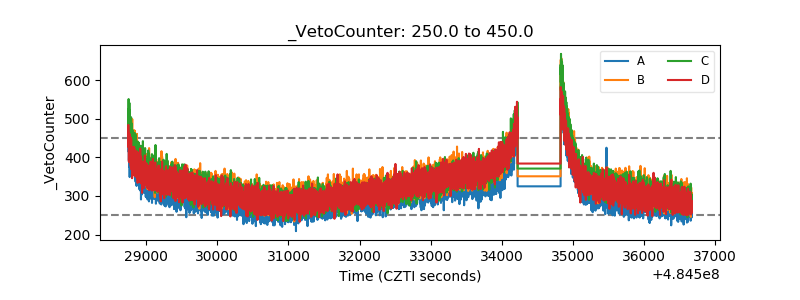 |