| Param | Original file | Final file |
|---|---|---|
| Filename | modeM0/AS1C09_011T06_9000006468_52007cztM0_level2.fits | modeM0/AS1C09_011T06_9000006468_52007cztM0_level2_quad_clean.evt |
| Size (bytes) | 889,358,400 | 88,148,160 |
| Size | 848.2 MB | 84.1 MB |
| Events in quadrant A | 6,374,595 | 584,044 |
| Events in quadrant B | 9,462,861 | 531,112 |
| Events in quadrant C | 8,016,338 | 533,545 |
| Events in quadrant D | 8,527,432 | 532,118 |
| Mode M0 | |||
|---|---|---|---|
| Quadrant | BADHDUFLAG | Total packets | Discarded packets |
| A | 0 | 23905 | 0 |
| B | 0 | 33026 | 0 |
| C | 0 | 28617 | 0 |
| D | 0 | 30305 | 0 |
| Mode SS | |||
|---|---|---|---|
| Quadrant | BADHDUFLAG | Total packets | Discarded packets |
| A | 0 | 140 | 0 |
| B | 0 | 140 | 0 |
| C | 0 | 140 | 0 |
| D | 0 | 140 | 0 |
| Quadrant | Total seconds | Saturated seconds | Saturation percentage |
|---|---|---|---|
| A | 6997 | 840 | 12.005145% |
| B | 6998 | 2149 | 30.708774% |
| C | 6998 | 1408 | 20.120034% |
| D | 6998 | 956 | 13.661046% |
Noise dominated data is calculated using 1-second bins in cleaned event files. If a bin has >2000 counts, and if more than 50% of those come from <1% of pixels, then it is considered to be noise-dominated and hence unusable.
| Quadrant | # 1 sec bins | Bins with >0 counts | Bins with >2000 counts | High rate bins dominated by noise | Noise dominated (total time) | Noise dominated (detector-on time) | Marked lightcurve |
|---|---|---|---|---|---|---|---|
| A | 6997 | 6997 | 736 | 736 | 10.52% | 10.52% | 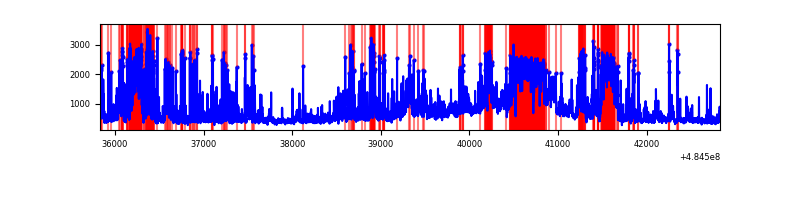 |
| B | 6998 | 6998 | 1202 | 1202 | 17.18% | 17.18% | 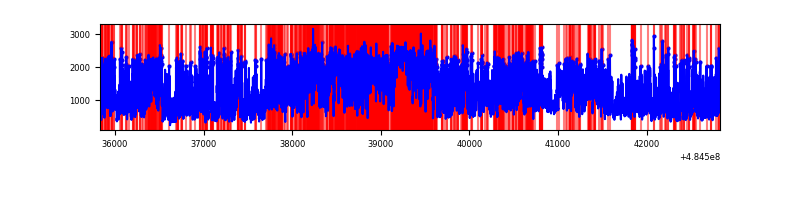 |
| C | 6998 | 6998 | 1402 | 1402 | 20.03% | 20.03% | 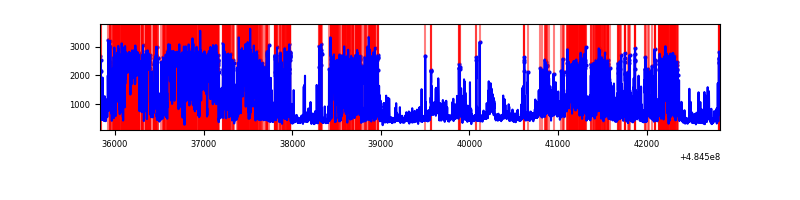 |
| D | 6998 | 6998 | 1072 | 1072 | 15.32% | 15.32% | 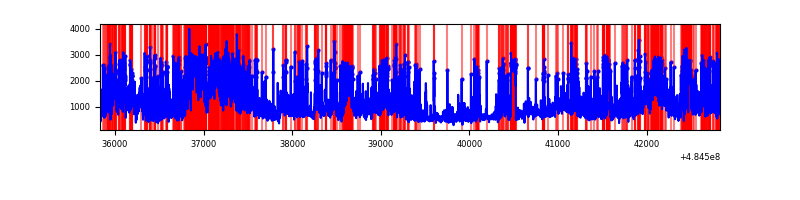 |
Top three noisy pixels from each quadrant. If the there are fewer than three noisy pixels in the level2.evt file, extra rows are filled as -1
| Pixel properties | Quadrant properties | ||||||
|---|---|---|---|---|---|---|---|
| Quadrant | DetID | PixID | Counts | Sigma | Mean | Median | Sigma |
| A | 3 | 14 | 1528289 | 8867.68 | 695 | 679 | 172.3 |
| A | 8 | 246 | 444721 | 2577.64 | 695 | 679 | 172.3 |
| A | 7 | 64 | 391588 | 2269.2 | 695 | 679 | 172.3 |
| B | 7 | 0 | 5825649 | 41363.18 | 659 | 635 | 140.8 |
| B | 4 | 206 | 367749 | 2606.86 | 659 | 635 | 140.8 |
| B | 10 | 247 | 107571 | 759.35 | 659 | 635 | 140.8 |
| C | 15 | 224 | 3486074 | 19046.75 | 655 | 647 | 183.0 |
| C | 4 | 5 | 827873 | 4520.53 | 655 | 647 | 183.0 |
| C | 15 | 178 | 374084 | 2040.71 | 655 | 647 | 183.0 |
| D | 12 | 6 | 1843638 | 9847.54 | 663 | 635 | 187.2 |
| D | 2 | 172 | 1589700 | 8490.7 | 663 | 635 | 187.2 |
| D | 12 | 17 | 544779 | 2907.47 | 663 | 635 | 187.2 |
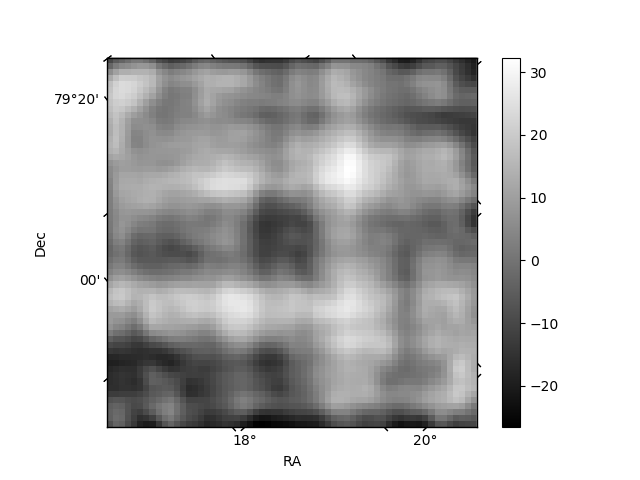
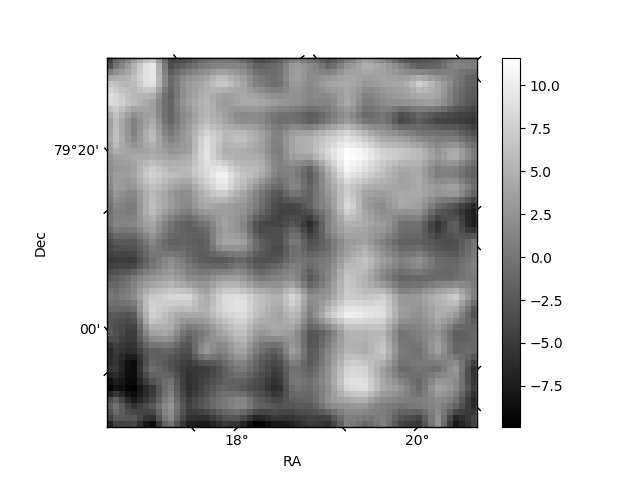
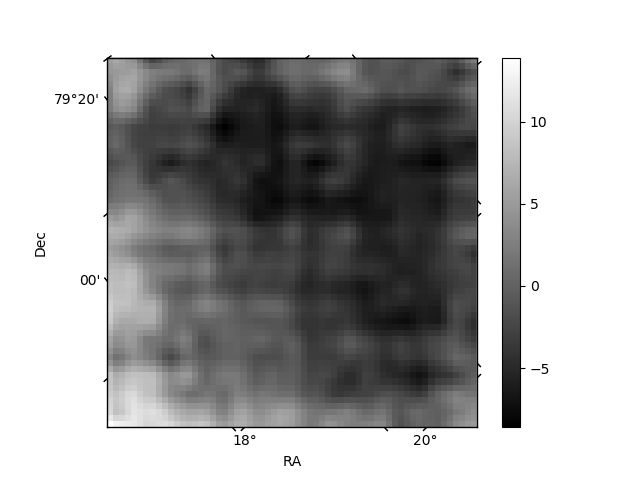
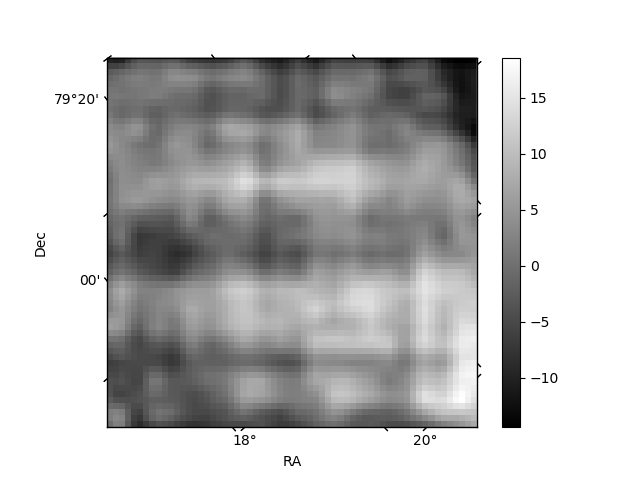
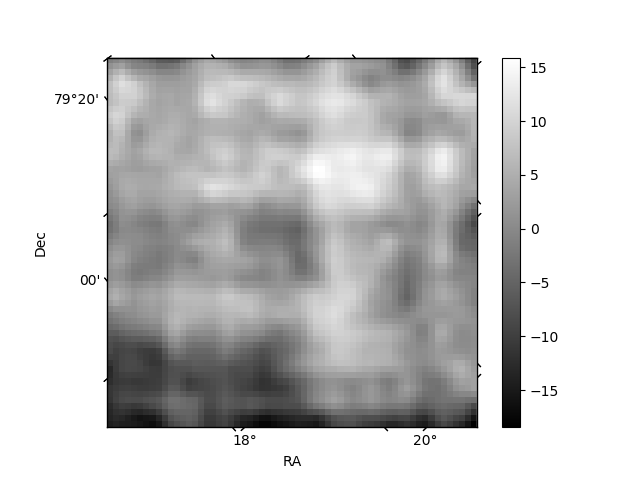
Histogram calculated using DETX and DETY for each event in the final _common_clean file
| Quadrant A | 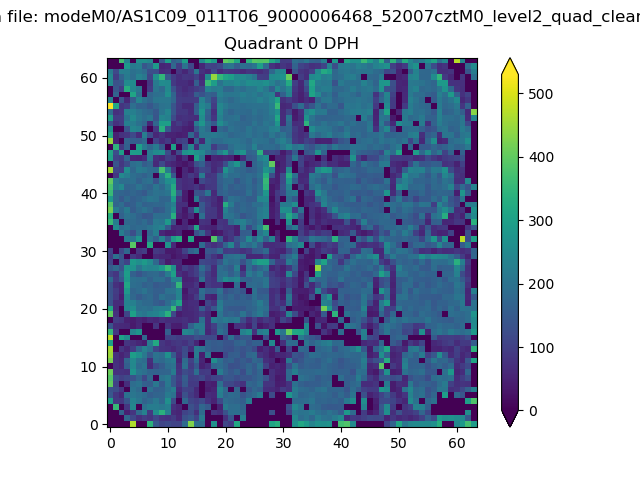 |
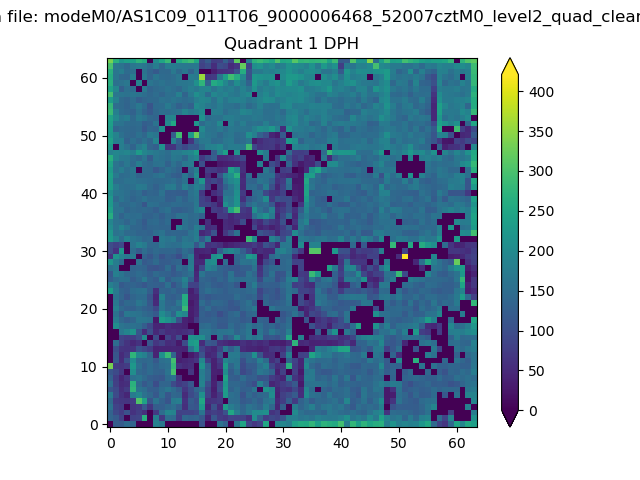 |
Quadrant B |
|---|---|---|---|
| Quadrant D | 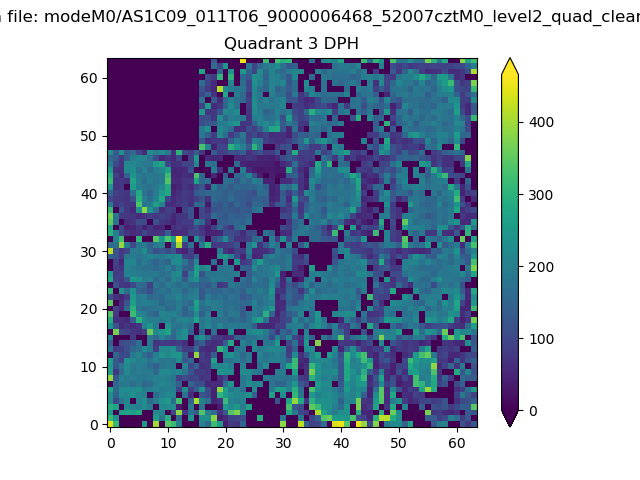 |
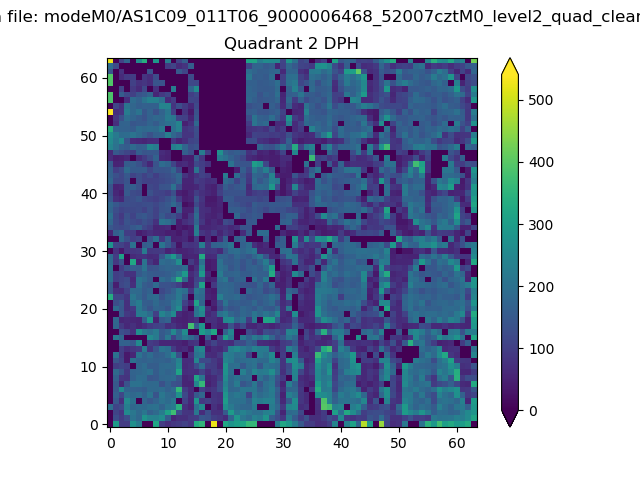 |
Quadrant C |
| Plot type | Count rate plots | Images |
|---|---|---|
| Comparison with Poisson distribution Blue bars denote a histogram of data divided into 1 sec bins. Red curve is a Poisson curve with rate = median count rate of data. |
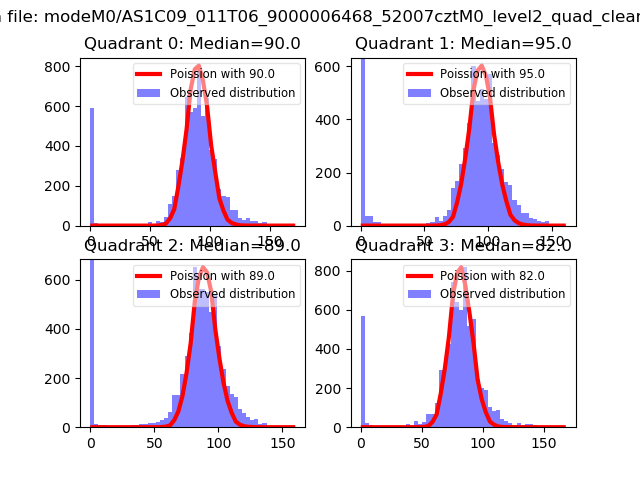 |
 |
| Quadrant-wise count rates Data is divided into 100 sec bins |
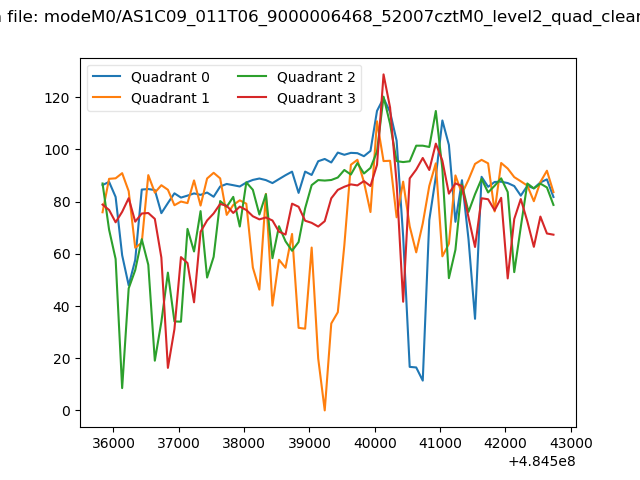 |
|
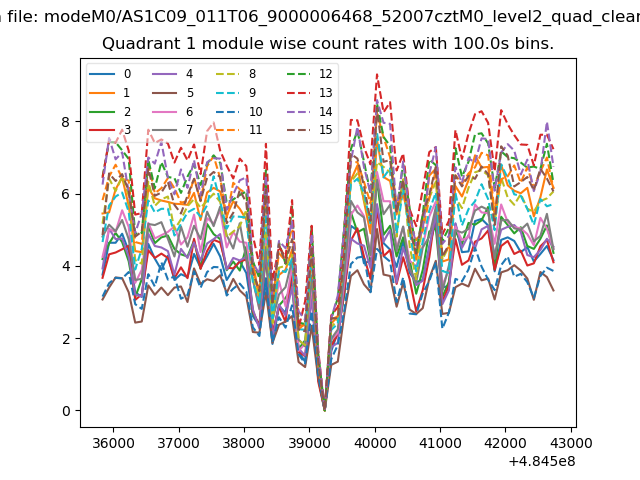
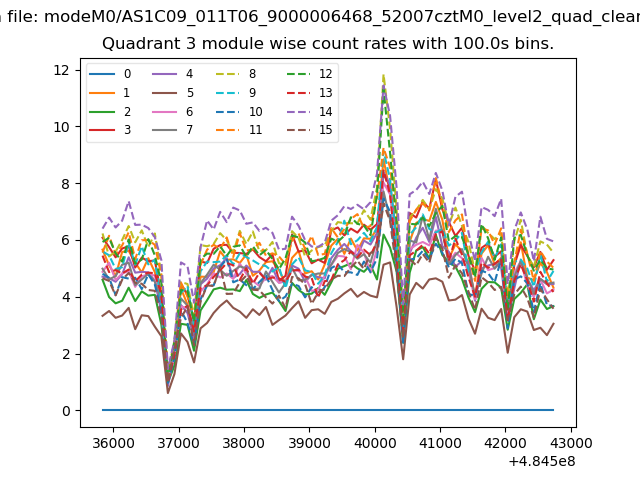
| Module-wise count rates for Quadrant A Data is divided into 100 sec bins |
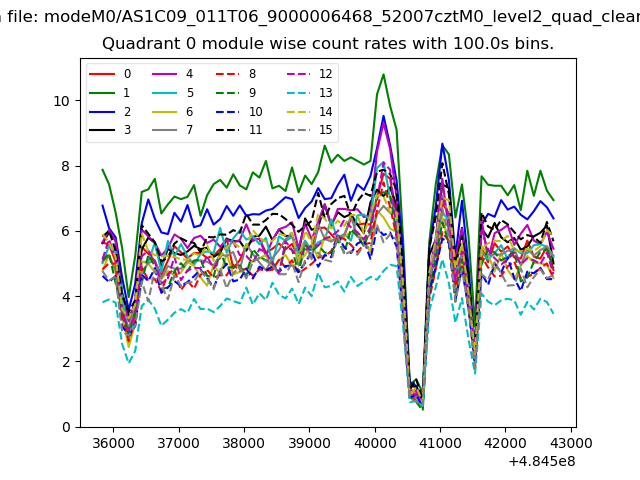 |
 |
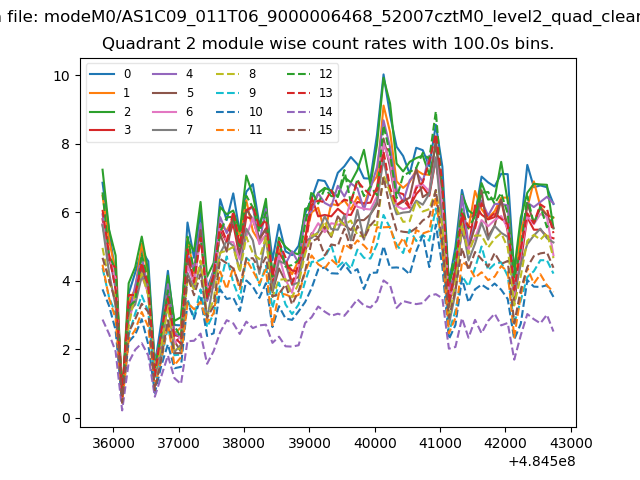
| Module-wise count rates for Quadrant B Data is divided into 100 sec bins |
 |
 |
| Module-wise count rates for Quadrant C Data is divided into 100 sec bins |
 |
 |
| Module-wise count rates for Quadrant D Data is divided into 100 sec bins |
 |
 |
| Parameter | Plot |
|---|---|
| CZT HV Monitor | 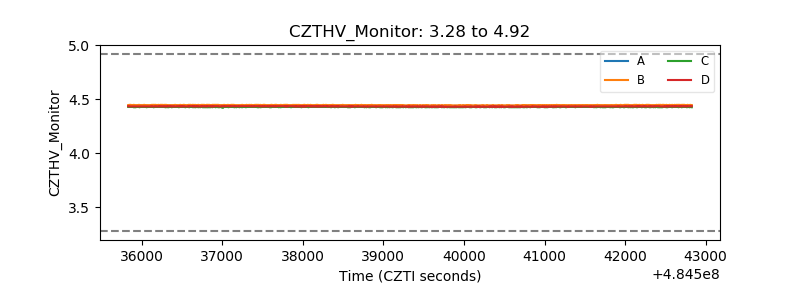 |
| D_VDD | 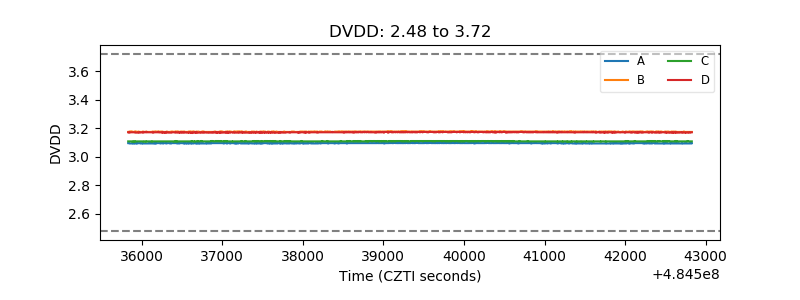 |
| Temperature 1 | 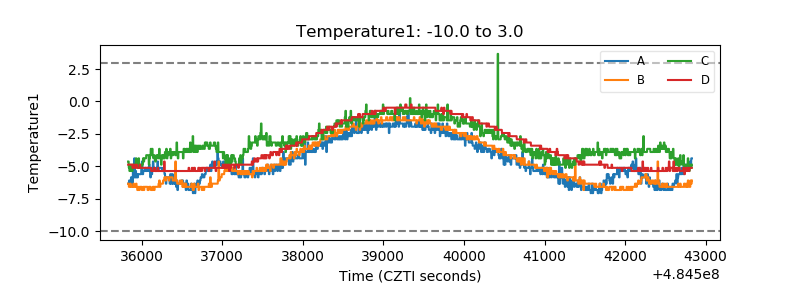 |
| Veto HV Monitor | 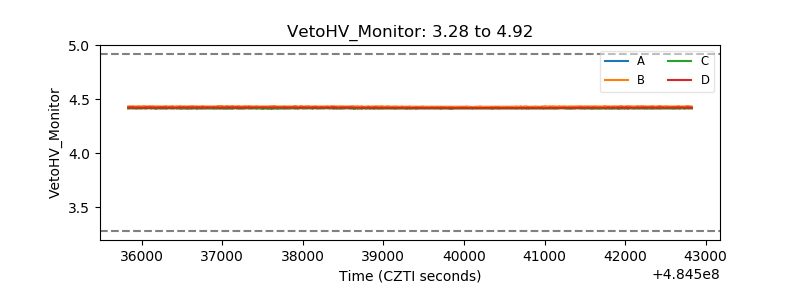 |
| Veto LLD | 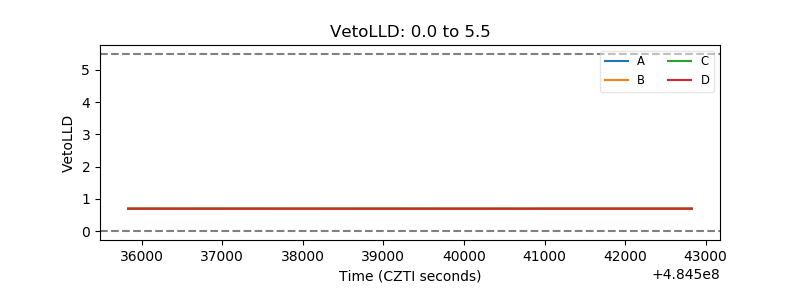 |
| Alpha Counter | 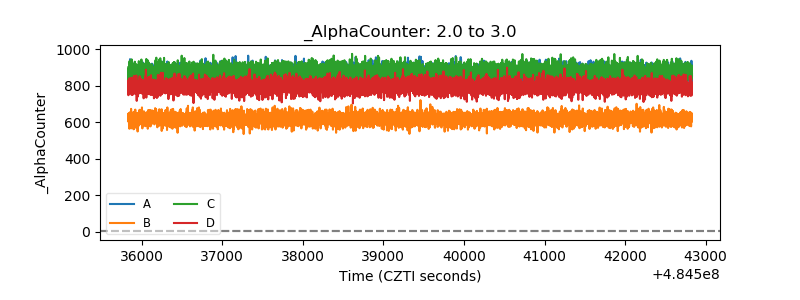 |
| _CPM_Rate | 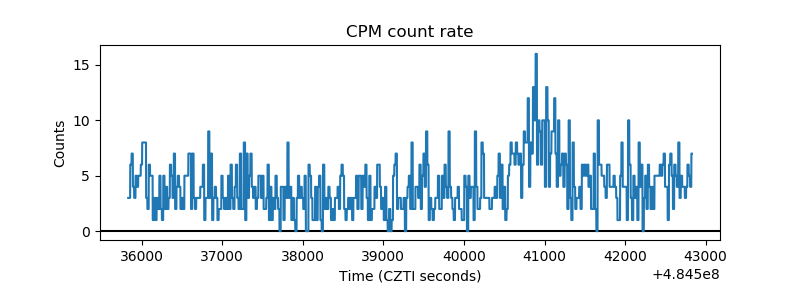 |
| CZT Counter | 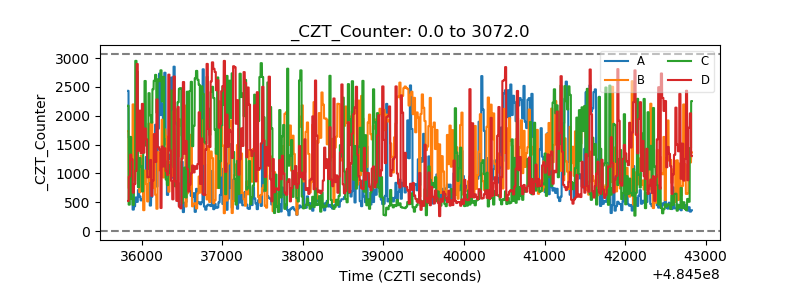 |
| +2.5 Volts monitor | 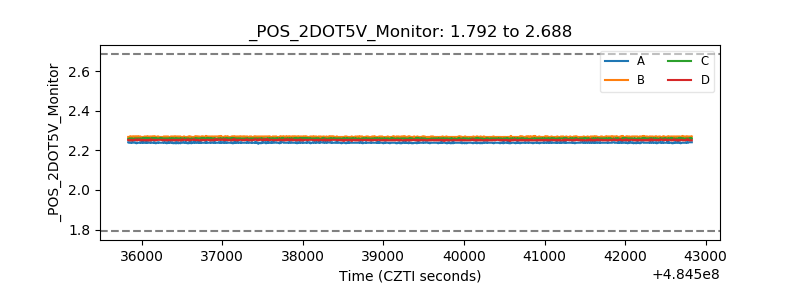 |
| +5 Volts monitor | 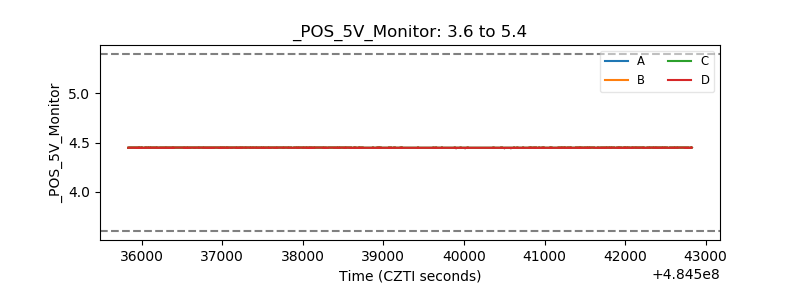 |
| _ROLL_ROT | 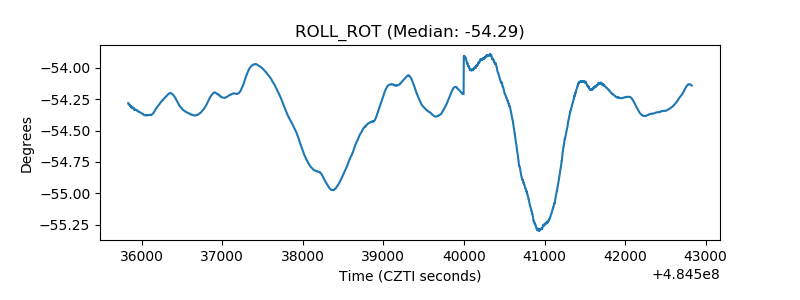 |
| _Roll_DEC | 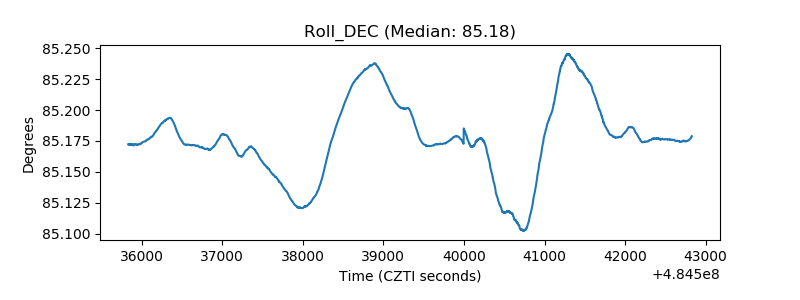 |
| _Roll_RA | 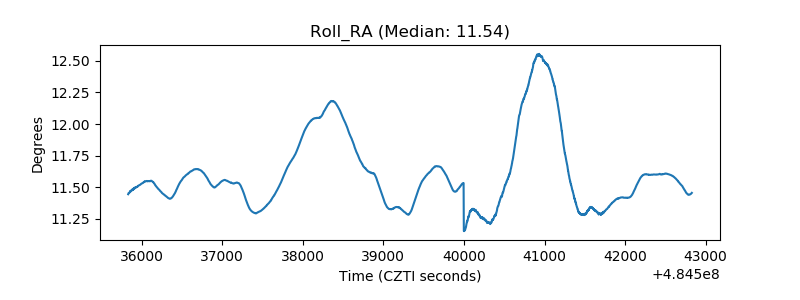 |
| Veto Counter | 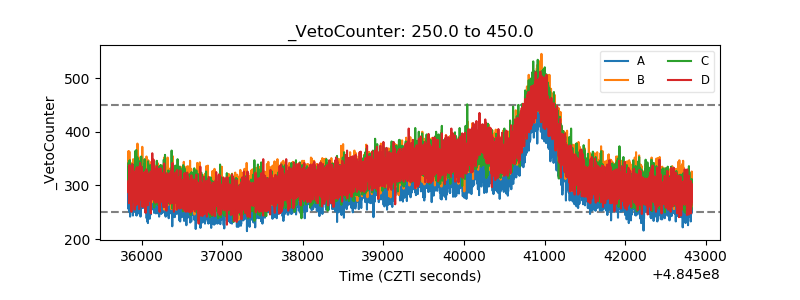 |