| Param | Original file | Final file |
|---|---|---|
| Filename | modeM0/AS1C09_011T06_9000006468_52008cztM0_level2.fits | modeM0/AS1C09_011T06_9000006468_52008cztM0_level2_quad_clean.evt |
| Size (bytes) | 891,740,160 | 99,365,760 |
| Size | 850.4 MB | 94.8 MB |
| Events in quadrant A | 4,906,619 | 686,032 |
| Events in quadrant B | 9,053,254 | 659,318 |
| Events in quadrant C | 6,813,972 | 639,849 |
| Events in quadrant D | 11,639,899 | 485,623 |
| Mode M0 | |||
|---|---|---|---|
| Quadrant | BADHDUFLAG | Total packets | Discarded packets |
| A | 0 | 19977 | 0 |
| B | 0 | 32325 | 0 |
| C | 0 | 25686 | 0 |
| D | 0 | 40020 | 0 |
| Mode SS | |||
|---|---|---|---|
| Quadrant | BADHDUFLAG | Total packets | Discarded packets |
| A | 0 | 156 | 0 |
| B | 0 | 156 | 0 |
| C | 0 | 156 | 0 |
| D | 0 | 156 | 0 |
| Quadrant | Total seconds | Saturated seconds | Saturation percentage |
|---|---|---|---|
| A | 7718 | 214 | 2.772739% |
| B | 7717 | 1408 | 18.245432% |
| C | 7717 | 733 | 9.498510% |
| D | 7718 | 2217 | 28.725058% |
Noise dominated data is calculated using 1-second bins in cleaned event files. If a bin has >2000 counts, and if more than 50% of those come from <1% of pixels, then it is considered to be noise-dominated and hence unusable.
| Quadrant | # 1 sec bins | Bins with >0 counts | Bins with >2000 counts | High rate bins dominated by noise | Noise dominated (total time) | Noise dominated (detector-on time) | Marked lightcurve |
|---|---|---|---|---|---|---|---|
| A | 7718 | 7718 | 221 | 221 | 2.86% | 2.86% | 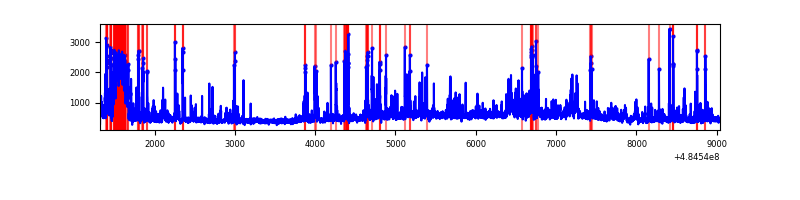 |
| B | 7717 | 7717 | 823 | 823 | 10.66% | 10.66% | 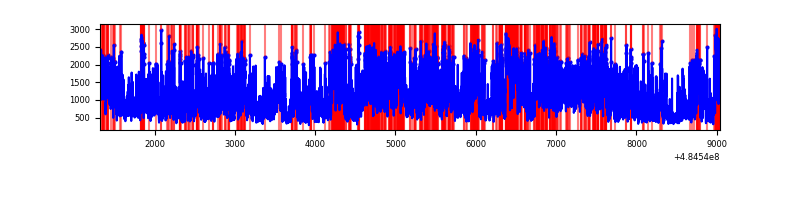 |
| C | 7717 | 7717 | 702 | 702 | 9.10% | 9.10% | 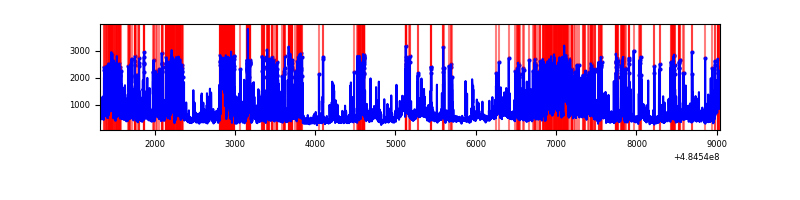 |
| D | 7718 | 7718 | 2142 | 2142 | 27.75% | 27.75% | 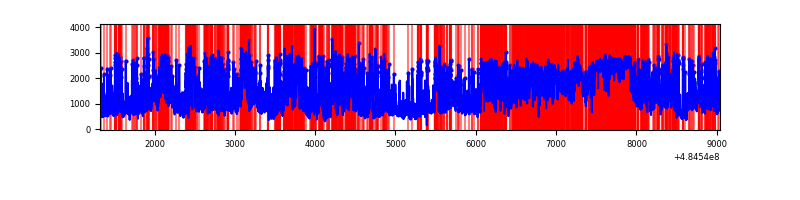 |
Top three noisy pixels from each quadrant. If the there are fewer than three noisy pixels in the level2.evt file, extra rows are filled as -1
| Pixel properties | Quadrant properties | ||||||
|---|---|---|---|---|---|---|---|
| Quadrant | DetID | PixID | Counts | Sigma | Mean | Median | Sigma |
| A | 3 | 14 | 812187 | 4179.0 | 774 | 752 | 194.2 |
| A | 4 | 3 | 318243 | 1635.12 | 774 | 752 | 194.2 |
| A | 5 | 240 | 231834 | 1190.1 | 774 | 752 | 194.2 |
| B | 7 | 0 | 4159102 | 26738.88 | 738 | 713 | 155.5 |
| B | 4 | 206 | 663440 | 4261.4 | 738 | 713 | 155.5 |
| B | 4 | 171 | 263352 | 1688.79 | 738 | 713 | 155.5 |
| C | 15 | 224 | 2409407 | 11685.64 | 740 | 734 | 206.1 |
| C | 4 | 5 | 510965 | 2475.38 | 740 | 734 | 206.1 |
| C | 15 | 147 | 203215 | 982.33 | 740 | 734 | 206.1 |
| D | 2 | 172 | 3008275 | 15548.11 | 677 | 648 | 193.4 |
| D | 12 | 6 | 1482164 | 7658.79 | 677 | 648 | 193.4 |
| D | 12 | 17 | 1249267 | 6454.81 | 677 | 648 | 193.4 |
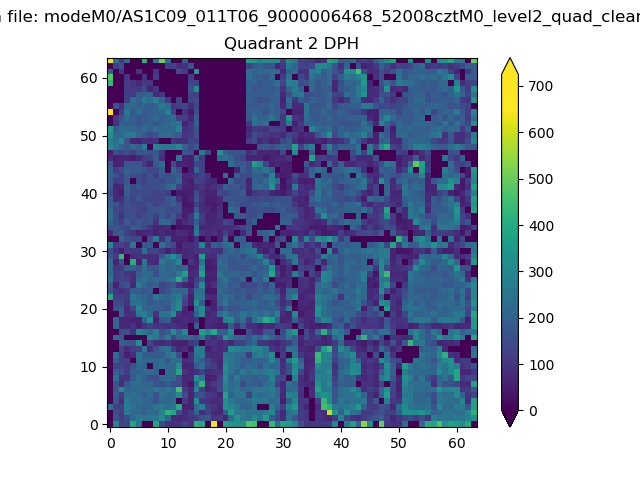
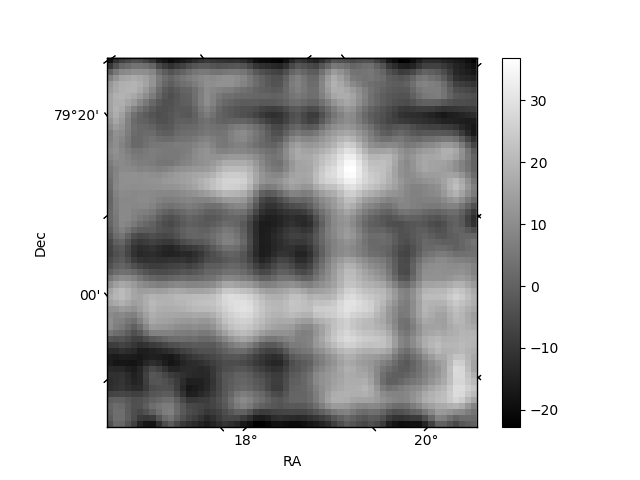
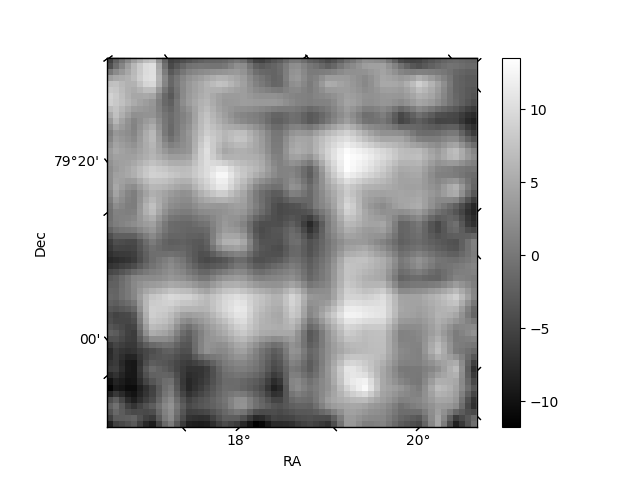
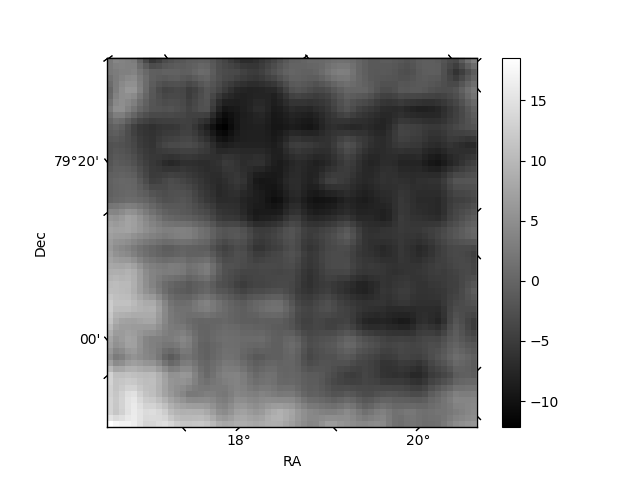
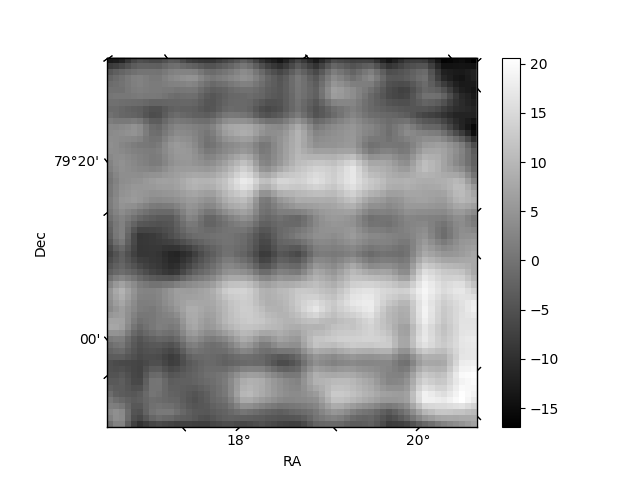
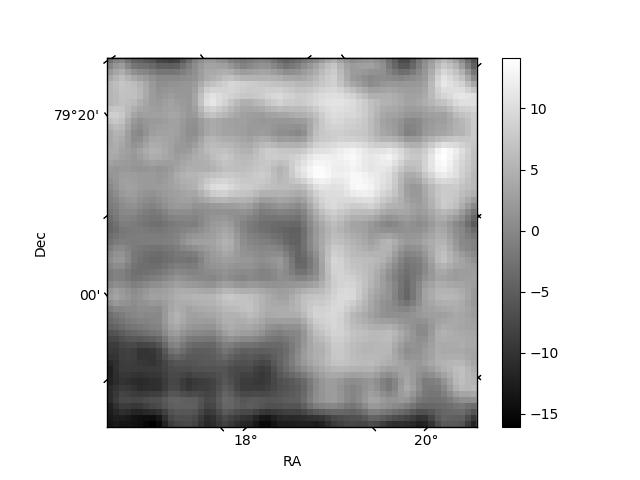
Histogram calculated using DETX and DETY for each event in the final _common_clean file
| Quadrant A | 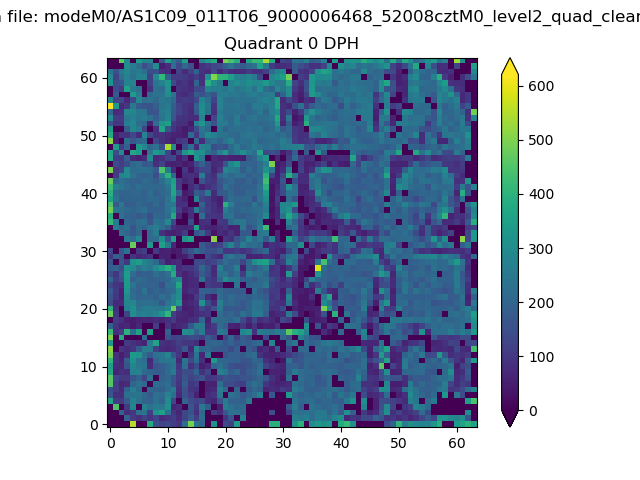 |
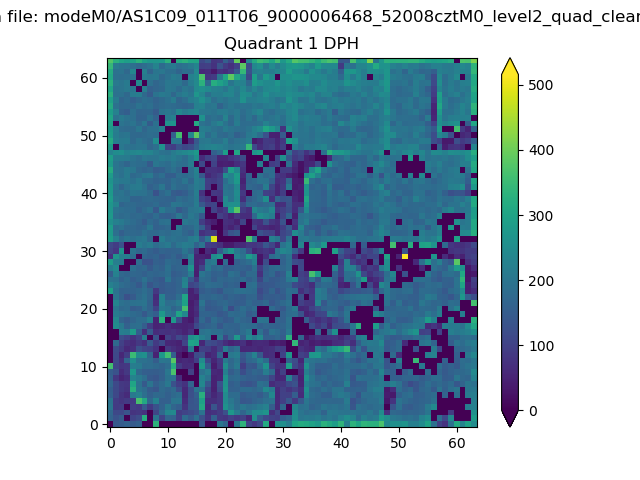 |
Quadrant B |
|---|---|---|---|
| Quadrant D | 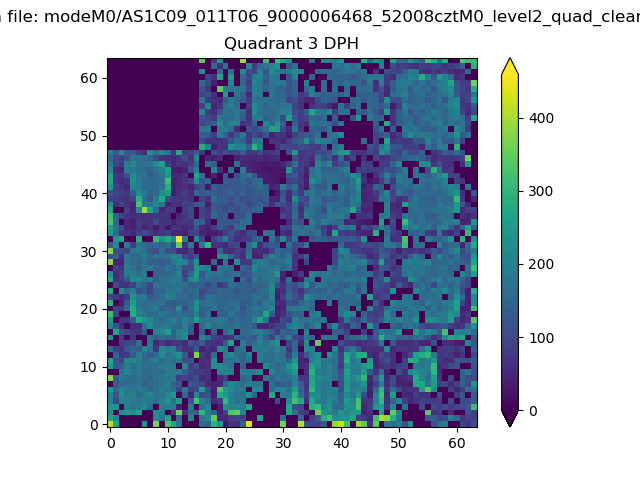 |
 |
Quadrant C |
| Plot type | Count rate plots | Images |
|---|---|---|
| Comparison with Poisson distribution Blue bars denote a histogram of data divided into 1 sec bins. Red curve is a Poisson curve with rate = median count rate of data. |
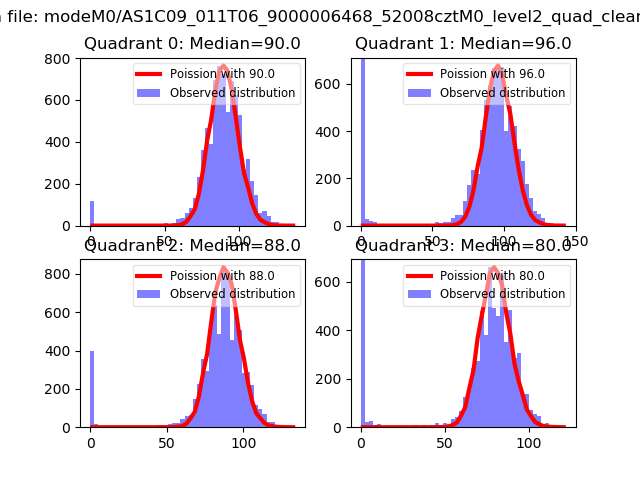 |
 |
| Quadrant-wise count rates Data is divided into 100 sec bins |
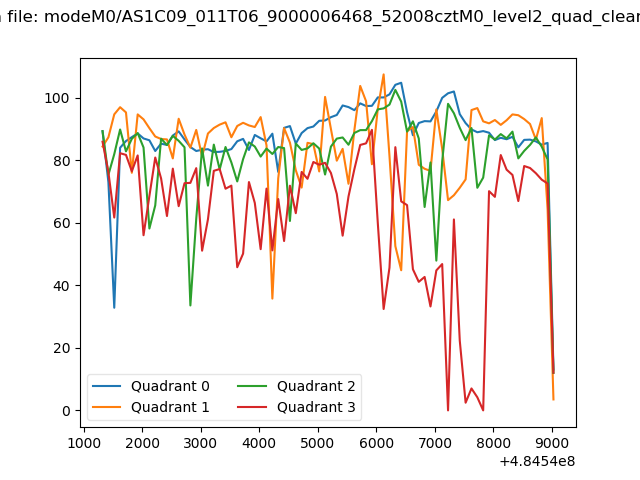 |
|
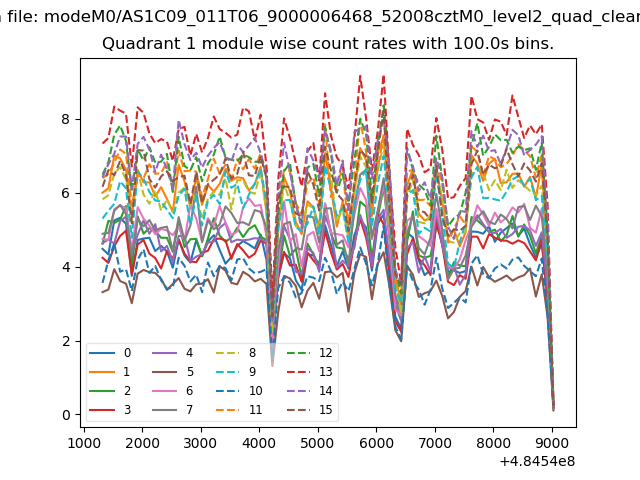
| Module-wise count rates for Quadrant A Data is divided into 100 sec bins |
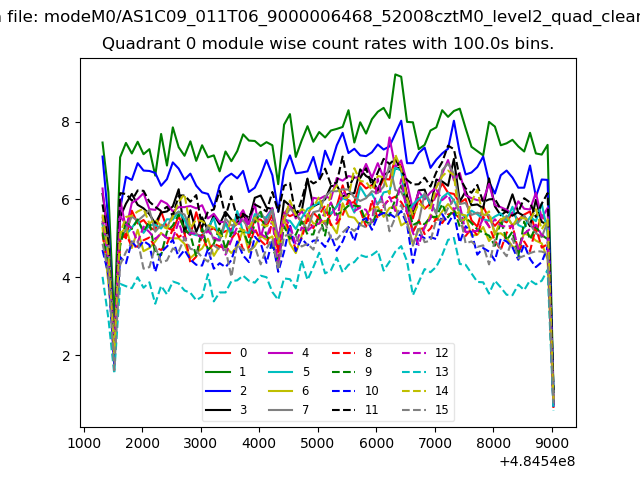 |
 |
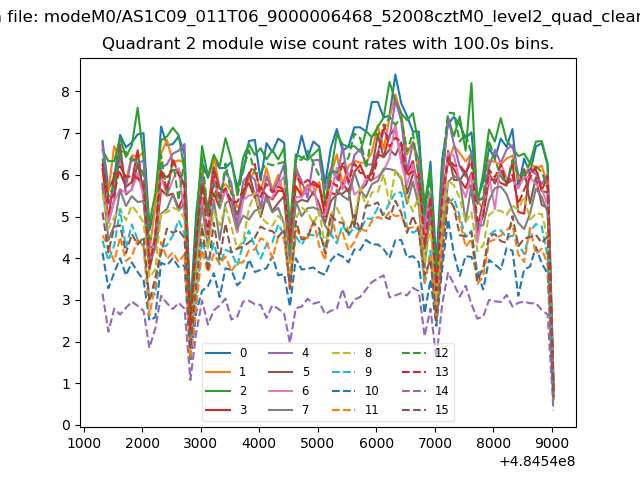
| Module-wise count rates for Quadrant B Data is divided into 100 sec bins |
 |
 |
| Module-wise count rates for Quadrant C Data is divided into 100 sec bins |
 |
 |
| Module-wise count rates for Quadrant D Data is divided into 100 sec bins |
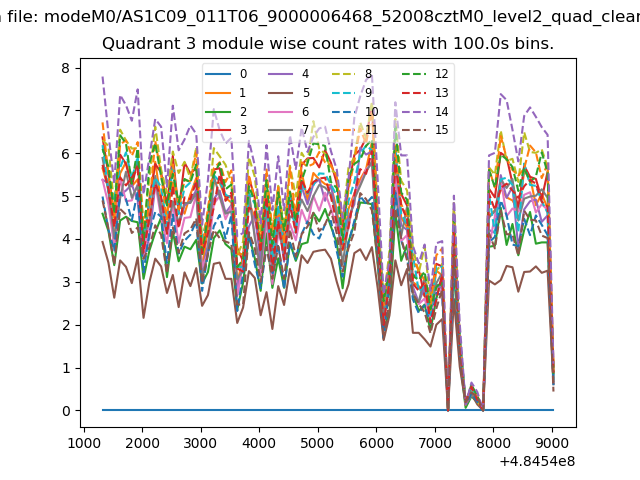 |
 |
| Parameter | Plot |
|---|---|
| CZT HV Monitor | 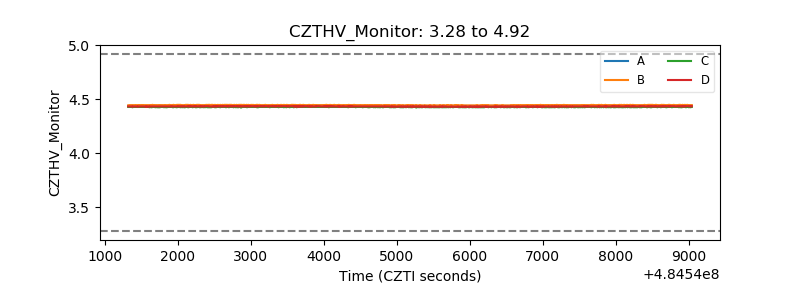 |
| D_VDD |  |
| Temperature 1 | 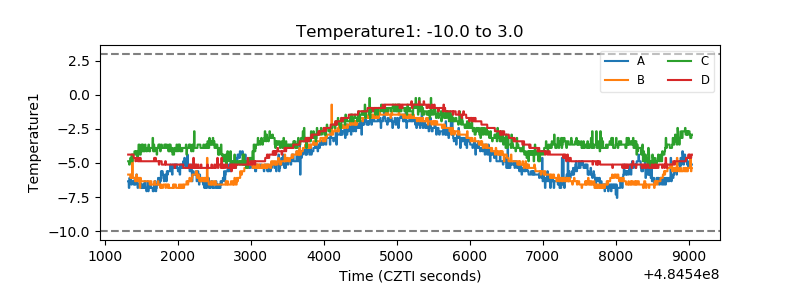 |
| Veto HV Monitor | 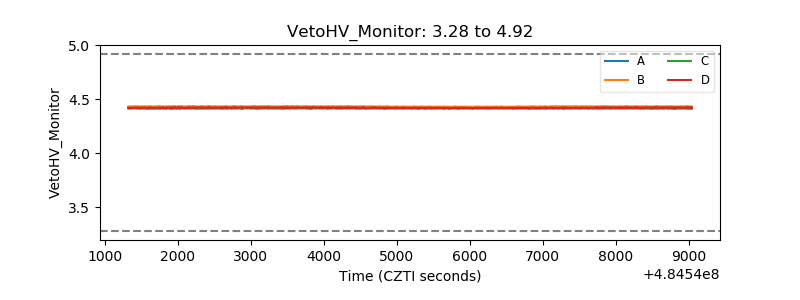 |
| Veto LLD | 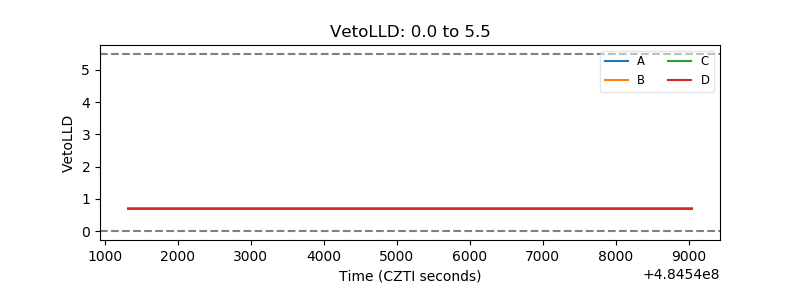 |
| Alpha Counter | 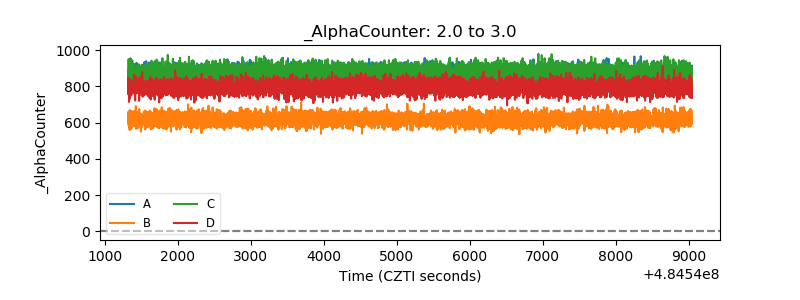 |
| _CPM_Rate | 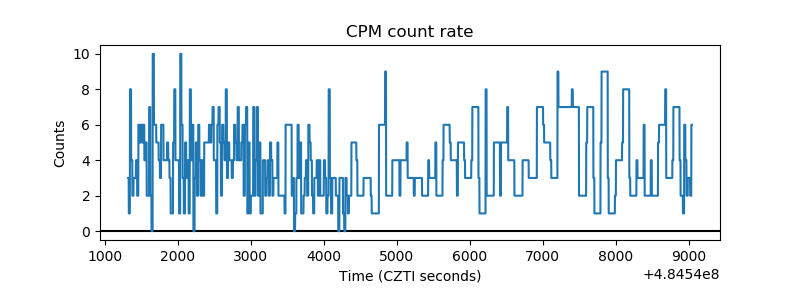 |
| CZT Counter | 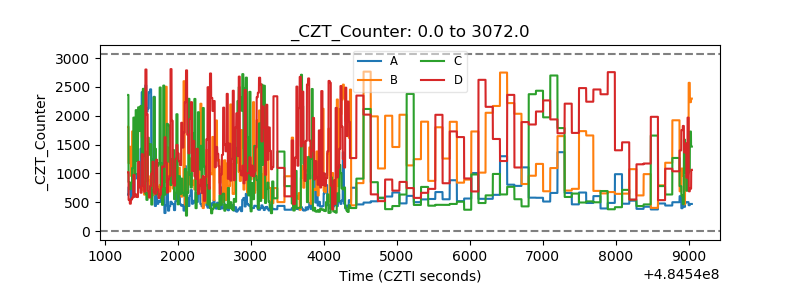 |
| +2.5 Volts monitor | 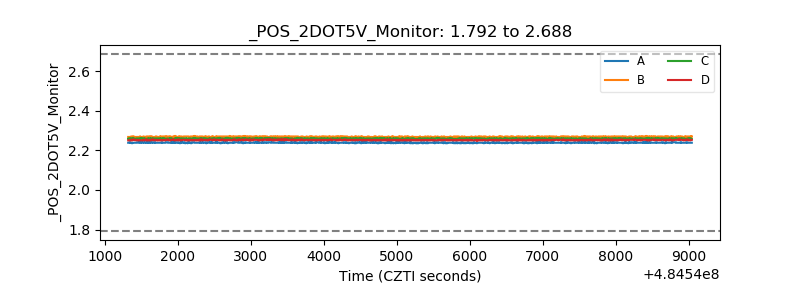 |
| +5 Volts monitor | 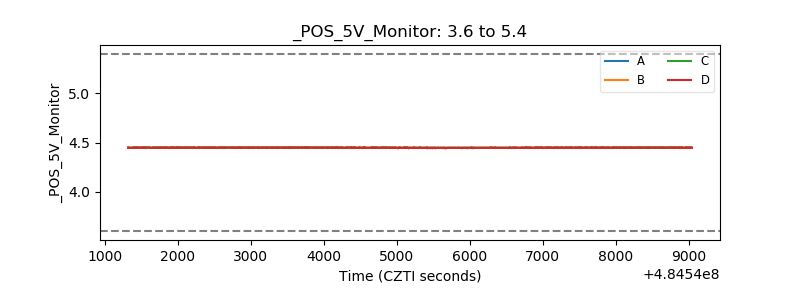 |
| _ROLL_ROT | 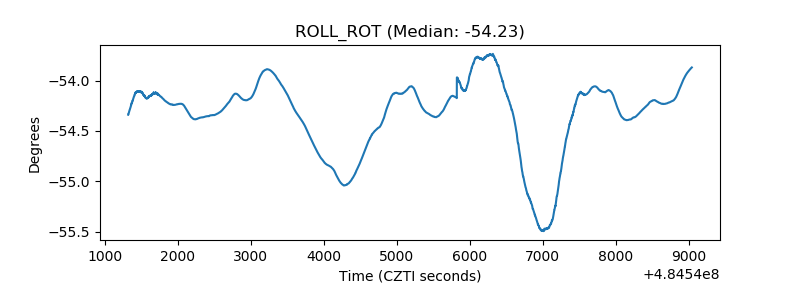 |
| _Roll_DEC | 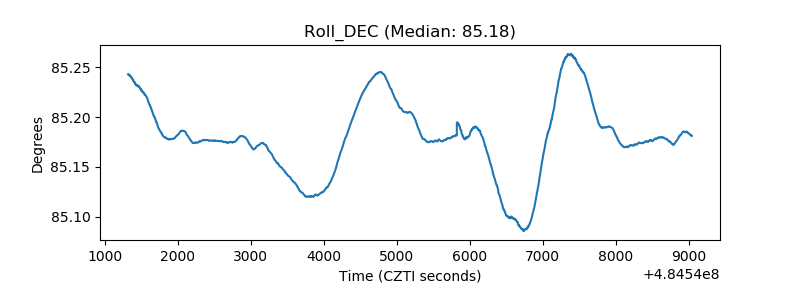 |
| _Roll_RA | 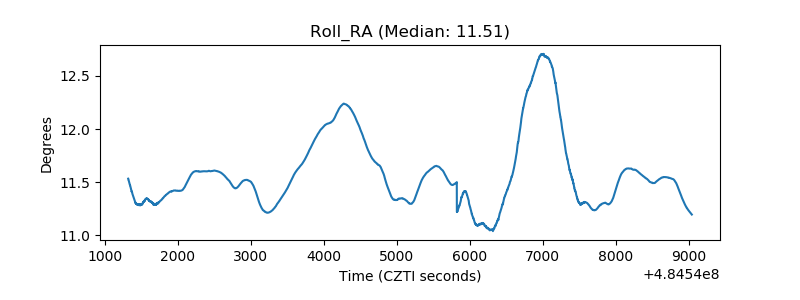 |
| Veto Counter | 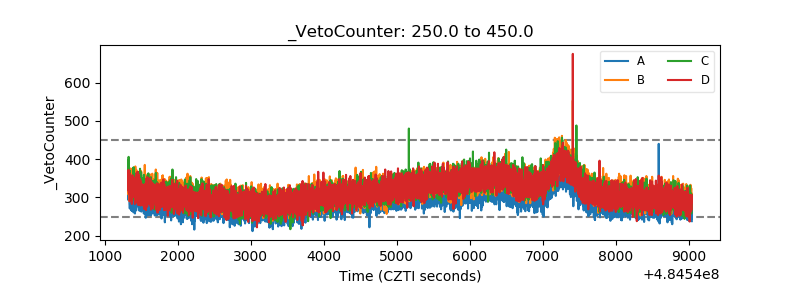 |