| Param | Original file | Final file |
|---|---|---|
| Filename | modeM0/AS1C09_011T06_9000006468_52009cztM0_level2.fits | modeM0/AS1C09_011T06_9000006468_52009cztM0_level2_quad_clean.evt |
| Size (bytes) | 760,682,880 | 95,918,400 |
| Size | 725.4 MB | 91.5 MB |
| Events in quadrant A | 4,464,449 | 652,921 |
| Events in quadrant B | 6,942,572 | 644,605 |
| Events in quadrant C | 6,356,591 | 589,332 |
| Events in quadrant D | 9,839,872 | 517,532 |
| Mode M0 | |||
|---|---|---|---|
| Quadrant | BADHDUFLAG | Total packets | Discarded packets |
| A | 0 | 18327 | 0 |
| B | 0 | 25663 | 0 |
| C | 0 | 23898 | 0 |
| D | 0 | 34321 | 0 |
| Mode SS | |||
|---|---|---|---|
| Quadrant | BADHDUFLAG | Total packets | Discarded packets |
| A | 0 | 142 | 0 |
| B | 0 | 142 | 0 |
| C | 0 | 142 | 0 |
| D | 0 | 142 | 0 |
| Quadrant | Total seconds | Saturated seconds | Saturation percentage |
|---|---|---|---|
| A | 7179 | 117 | 1.629753% |
| B | 7180 | 855 | 11.908078% |
| C | 7180 | 776 | 10.807799% |
| D | 7179 | 1319 | 18.373032% |
Noise dominated data is calculated using 1-second bins in cleaned event files. If a bin has >2000 counts, and if more than 50% of those come from <1% of pixels, then it is considered to be noise-dominated and hence unusable.
| Quadrant | # 1 sec bins | Bins with >0 counts | Bins with >2000 counts | High rate bins dominated by noise | Noise dominated (total time) | Noise dominated (detector-on time) | Marked lightcurve |
|---|---|---|---|---|---|---|---|
| A | 7179 | 7179 | 102 | 102 | 1.42% | 1.42% | 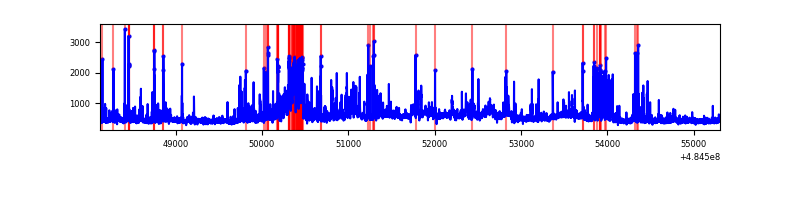 |
| B | 7180 | 7180 | 604 | 604 | 8.41% | 8.41% | 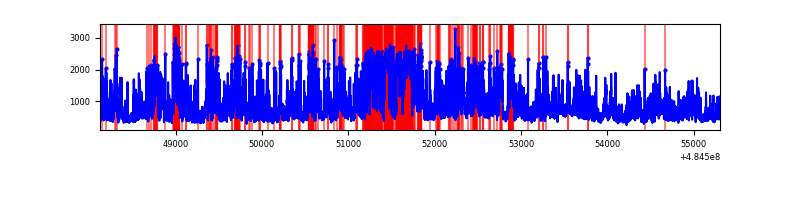 |
| C | 7179 | 7179 | 708 | 708 | 9.86% | 9.86% | 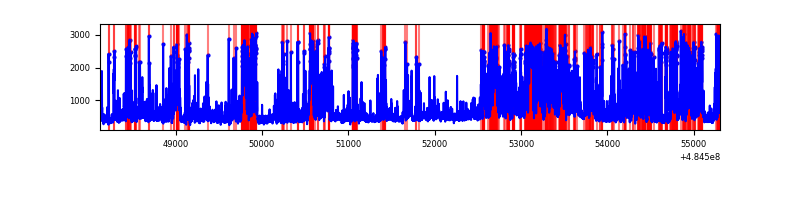 |
| D | 7179 | 7179 | 1487 | 1487 | 20.71% | 20.71% | 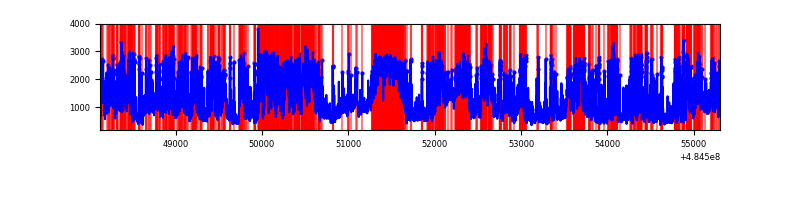 |
Top three noisy pixels from each quadrant. If the there are fewer than three noisy pixels in the level2.evt file, extra rows are filled as -1
| Pixel properties | Quadrant properties | ||||||
|---|---|---|---|---|---|---|---|
| Quadrant | DetID | PixID | Counts | Sigma | Mean | Median | Sigma |
| A | 3 | 14 | 510331 | 2797.22 | 734 | 714 | 182.2 |
| A | 4 | 3 | 254180 | 1391.24 | 734 | 714 | 182.2 |
| A | 13 | 248 | 153752 | 840.0 | 734 | 714 | 182.2 |
| B | 7 | 0 | 2373798 | 15856.51 | 703 | 678 | 149.7 |
| B | 4 | 206 | 817463 | 5457.52 | 703 | 678 | 149.7 |
| B | 5 | 185 | 346356 | 2309.72 | 703 | 678 | 149.7 |
| C | 15 | 224 | 2617560 | 13784.0 | 690 | 688 | 189.8 |
| C | 15 | 158 | 233166 | 1224.54 | 690 | 688 | 189.8 |
| C | 15 | 174 | 79606 | 415.69 | 690 | 688 | 189.8 |
| D | 6 | 42 | 1999160 | 10470.48 | 667 | 638 | 190.9 |
| D | 12 | 6 | 912461 | 4777.14 | 667 | 638 | 190.9 |
| D | 7 | 96 | 672113 | 3517.93 | 667 | 638 | 190.9 |
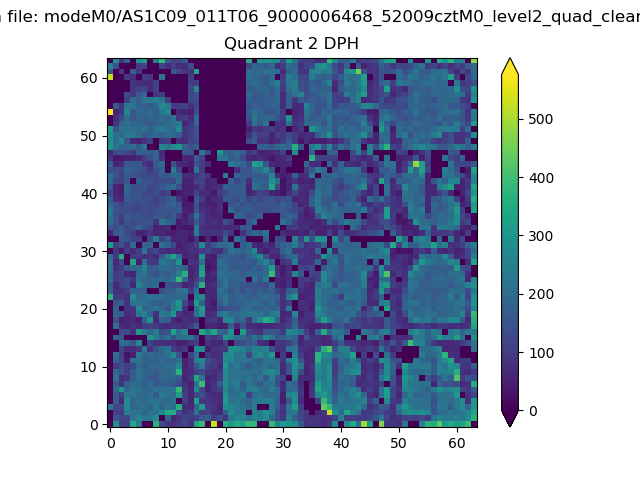
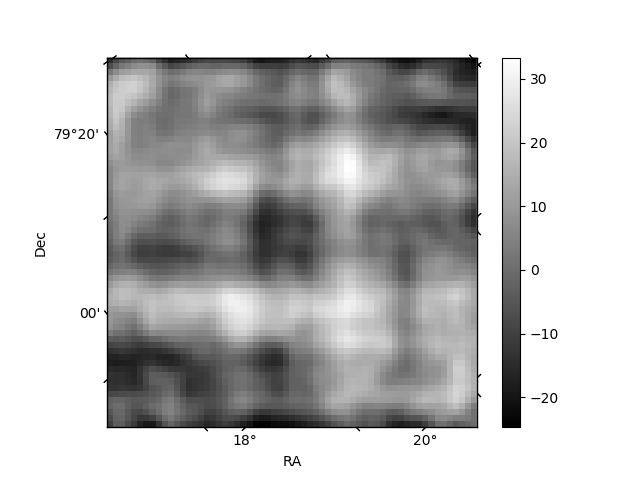
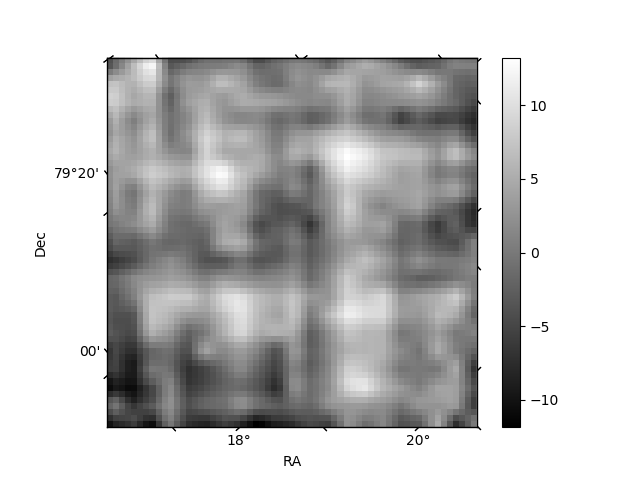
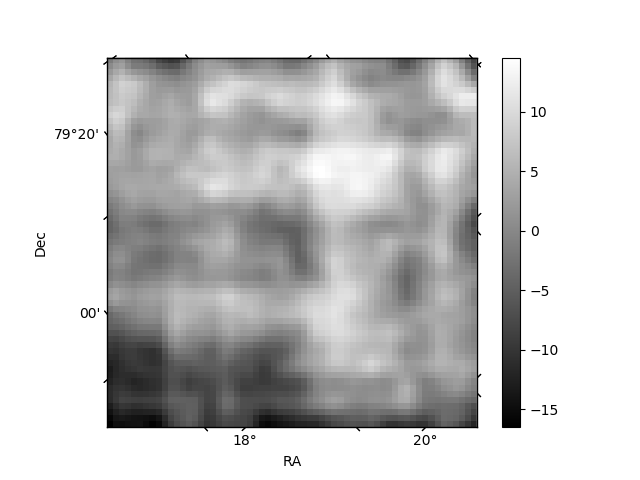
Histogram calculated using DETX and DETY for each event in the final _common_clean file
| Quadrant A | 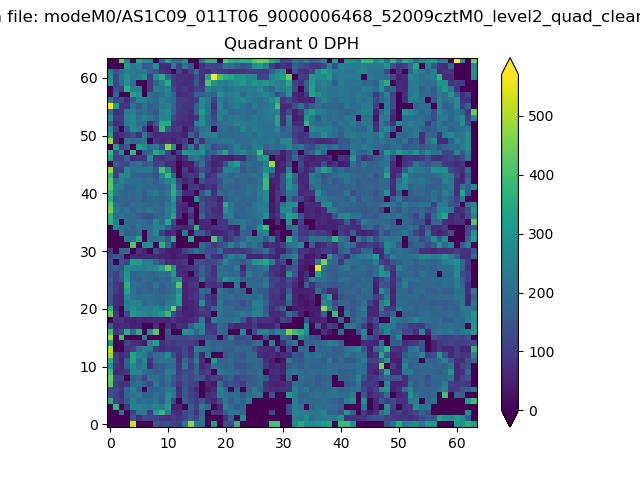 |
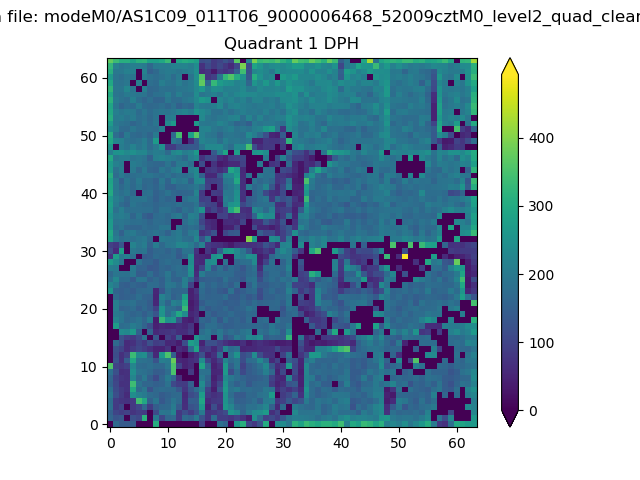 |
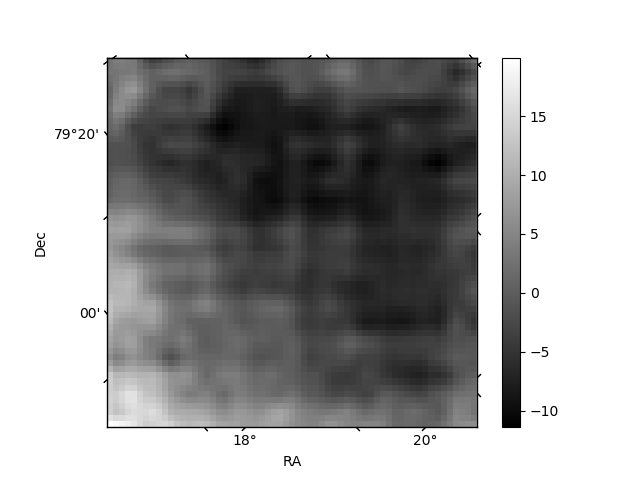
Quadrant B |
|---|---|---|---|
| Quadrant D | 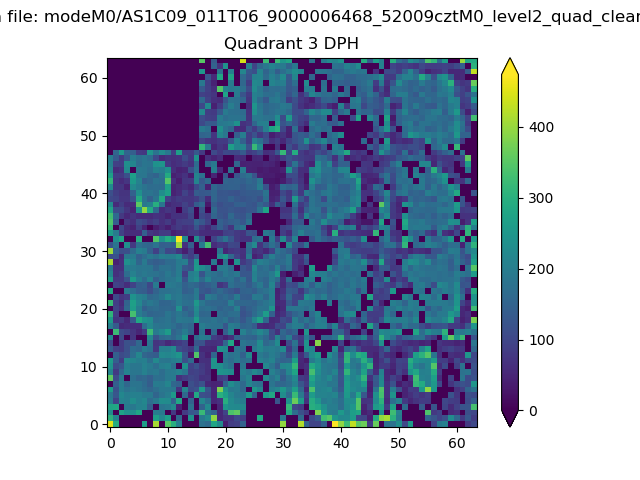 |
 |
Quadrant C |
| Plot type | Count rate plots | Images |
|---|---|---|
| Comparison with Poisson distribution Blue bars denote a histogram of data divided into 1 sec bins. Red curve is a Poisson curve with rate = median count rate of data. |
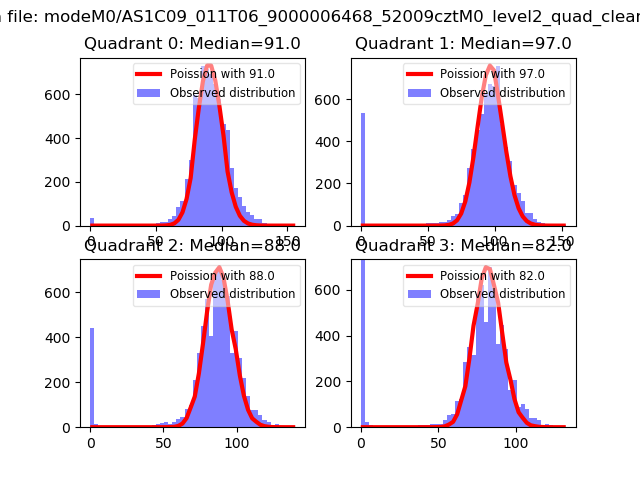 |
 |
| Quadrant-wise count rates Data is divided into 100 sec bins |
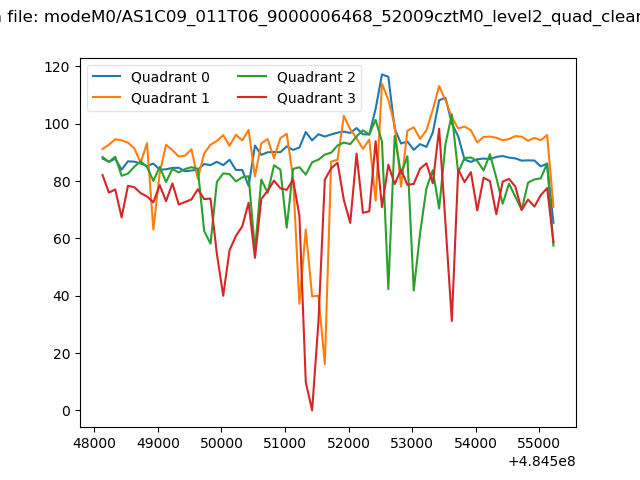 |
|
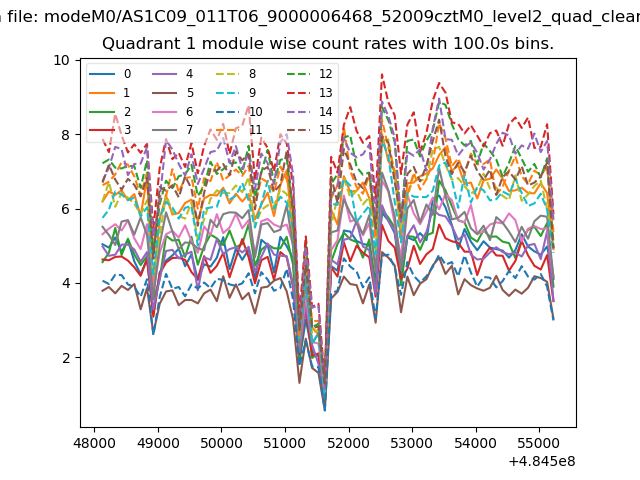
| Module-wise count rates for Quadrant A Data is divided into 100 sec bins |
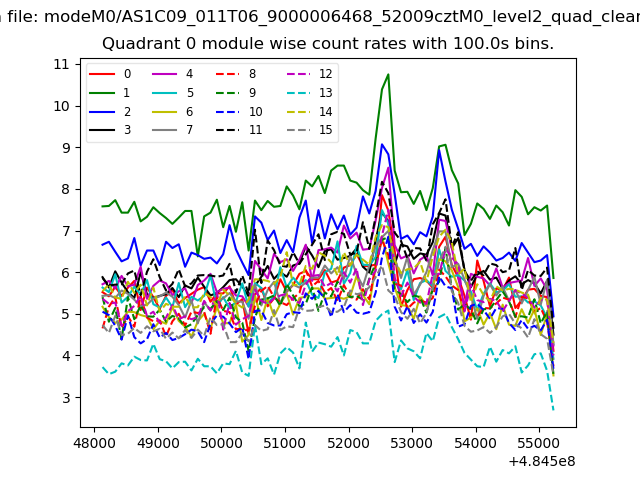 |
 |
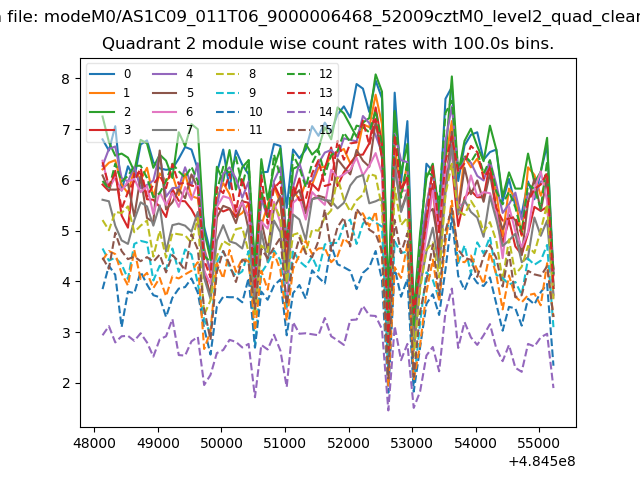
| Module-wise count rates for Quadrant B Data is divided into 100 sec bins |
 |
 |
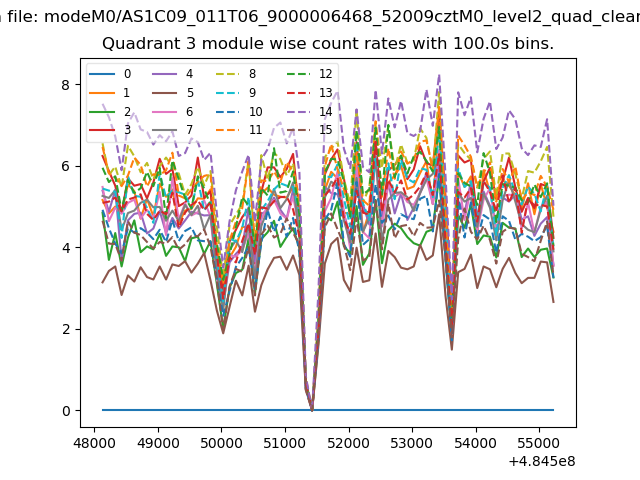
| Module-wise count rates for Quadrant C Data is divided into 100 sec bins |
 |
 |
| Module-wise count rates for Quadrant D Data is divided into 100 sec bins |
 |
 |
| Parameter | Plot |
|---|---|
| CZT HV Monitor | 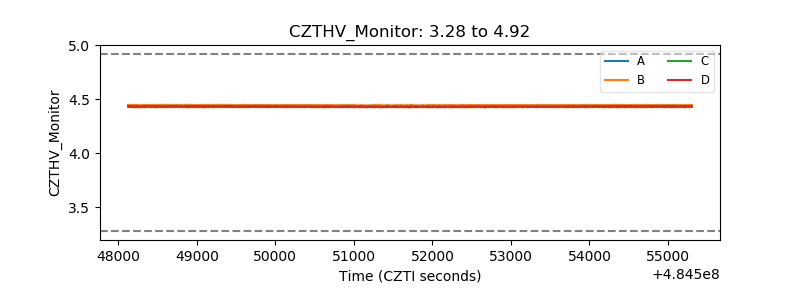 |
| D_VDD | 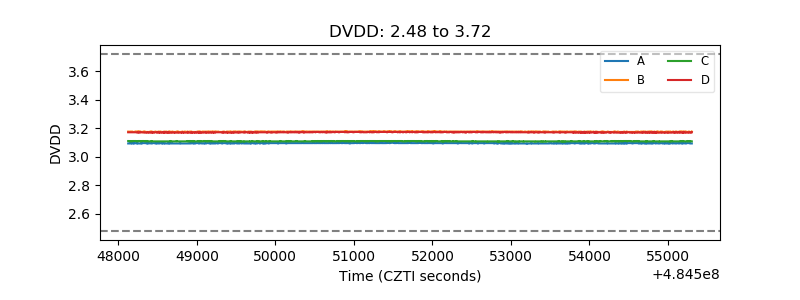 |
| Temperature 1 | 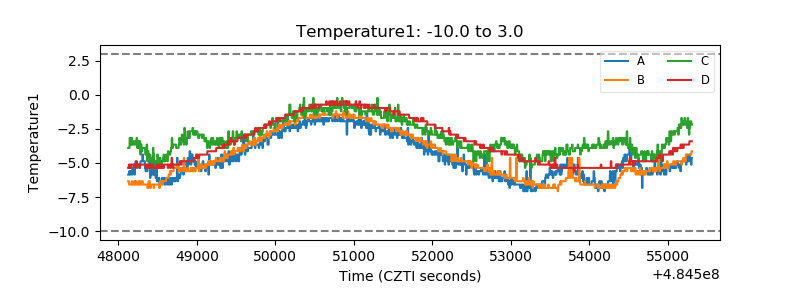 |
| Veto HV Monitor |  |
| Veto LLD | 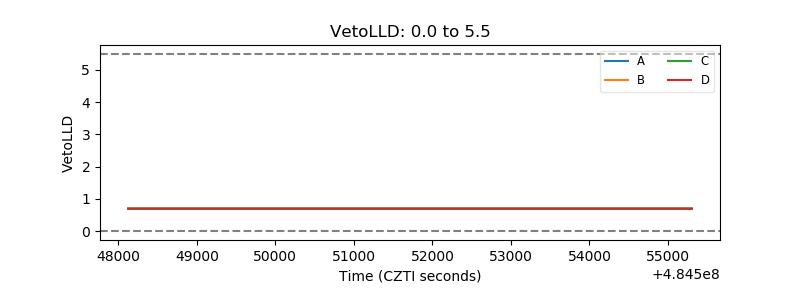 |
| Alpha Counter | 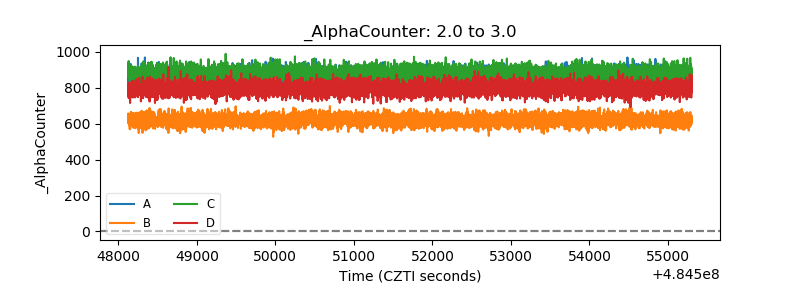 |
| _CPM_Rate | 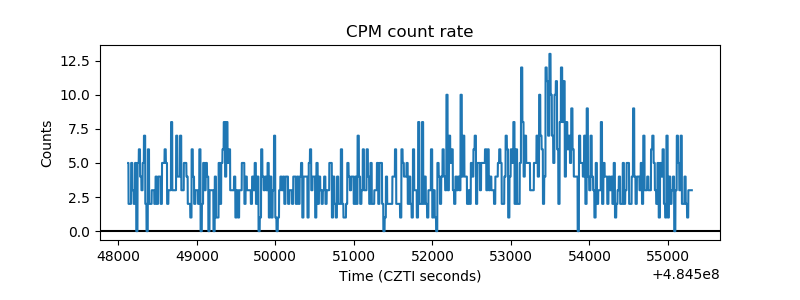 |
| CZT Counter | 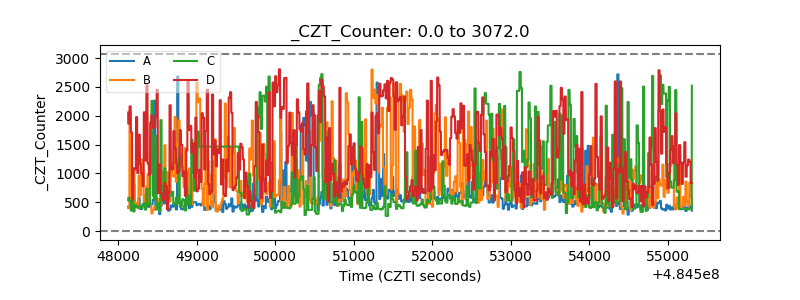 |
| +2.5 Volts monitor |  |
| +5 Volts monitor | 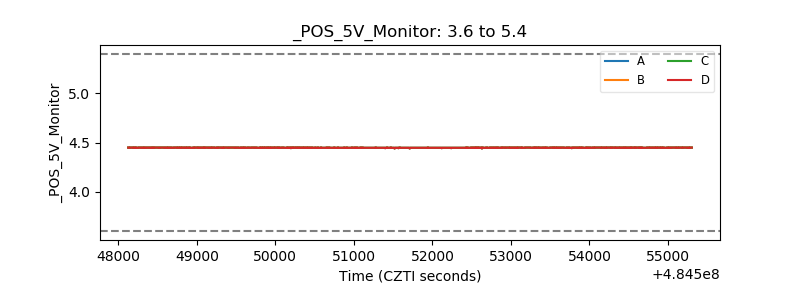 |
| _ROLL_ROT | 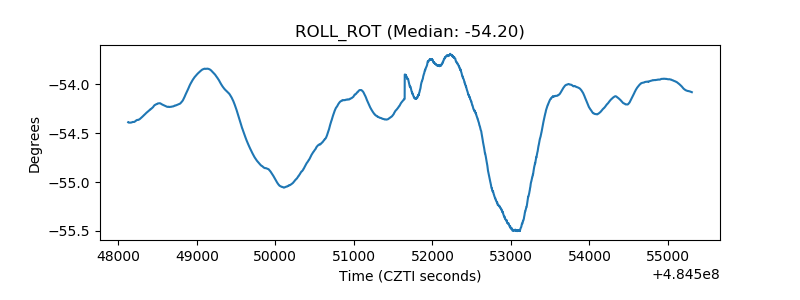 |
| _Roll_DEC | 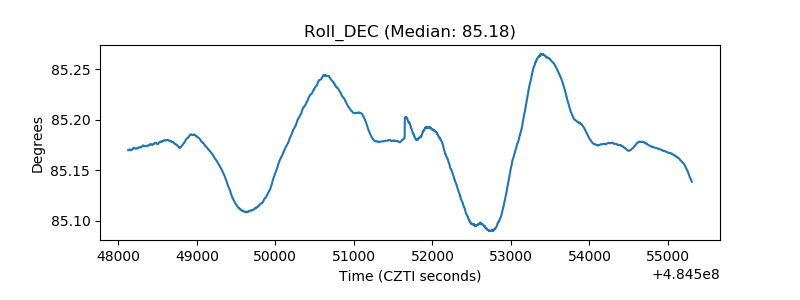 |
| _Roll_RA | 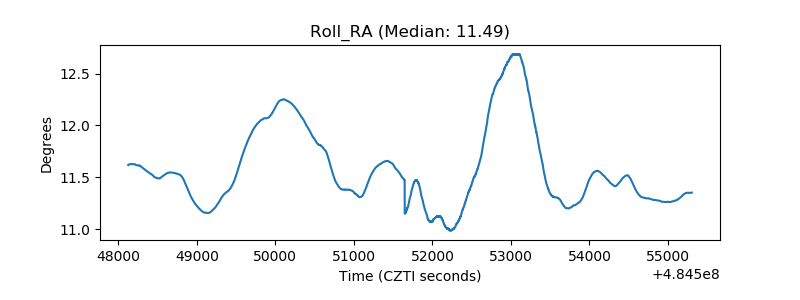 |
| Veto Counter | 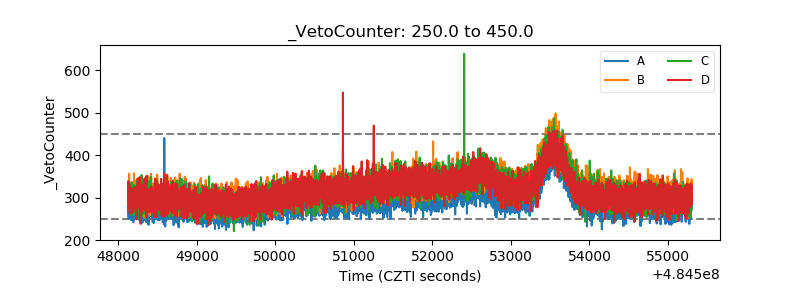 |