| Param | Original file | Final file |
|---|---|---|
| Filename | modeM0/AS1C09_011T06_9000006468_52012cztM0_level2.fits | modeM0/AS1C09_011T06_9000006468_52012cztM0_level2_quad_clean.evt |
| Size (bytes) | 2,125,180,800 | 217,889,280 |
| Size | 2.0 GB | 207.8 MB |
| Events in quadrant A | 11,308,578 | 1,602,910 |
| Events in quadrant B | 16,756,568 | 1,608,670 |
| Events in quadrant C | 15,812,696 | 1,398,584 |
| Events in quadrant D | 33,404,143 | 745,661 |
| Mode M0 | |||
|---|---|---|---|
| Quadrant | BADHDUFLAG | Total packets | Discarded packets |
| A | 0 | 45505 | 2 |
| B | 0 | 62336 | 2 |
| C | 0 | 59727 | 2 |
| D | 0 | 111727 | 2 |
| Mode M9 | |||
|---|---|---|---|
| Quadrant | BADHDUFLAG | Total packets | Discarded packets |
| A | 0 | 10 | 0 |
| B | 0 | 10 | 0 |
| C | 0 | 10 | 0 |
| D | 0 | 10 | 0 |
| Mode SS | |||
|---|---|---|---|
| Quadrant | BADHDUFLAG | Total packets | Discarded packets |
| A | 0 | 364 | 0 |
| B | 0 | 364 | 0 |
| C | 0 | 364 | 0 |
| D | 0 | 364 | 0 |
| Quadrant | Total seconds | Saturated seconds | Saturation percentage |
|---|---|---|---|
| A | 17985 | 597 | 3.319433% |
| B | 17986 | 1942 | 10.797287% |
| C | 17986 | 2101 | 11.681308% |
| D | 17986 | 9240 | 51.373290% |
Noise dominated data is calculated using 1-second bins in cleaned event files. If a bin has >2000 counts, and if more than 50% of those come from <1% of pixels, then it is considered to be noise-dominated and hence unusable.
| Quadrant | # 1 sec bins | Bins with >0 counts | Bins with >2000 counts | High rate bins dominated by noise | Noise dominated (total time) | Noise dominated (detector-on time) | Marked lightcurve |
|---|---|---|---|---|---|---|---|
| A | 19015 | 17985 | 201 | 201 | 1.06% | 1.12% | 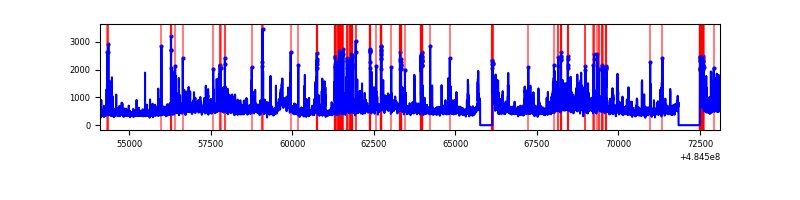 |
| B | 19016 | 17986 | 1174 | 1174 | 6.17% | 6.53% | 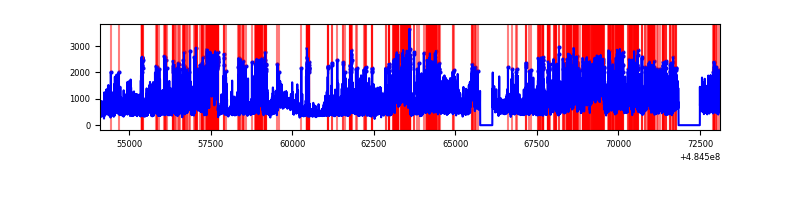 |
| C | 19016 | 17987 | 1902 | 1902 | 10.00% | 10.57% | 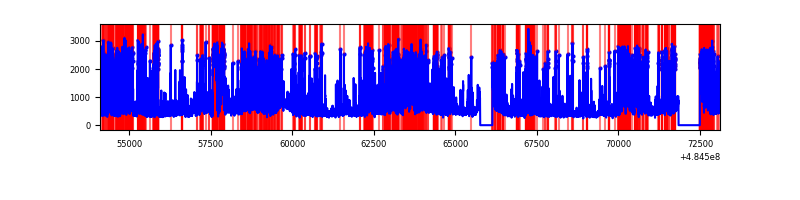 |
| D | 19016 | 17986 | 9110 | 9110 | 47.91% | 50.65% | 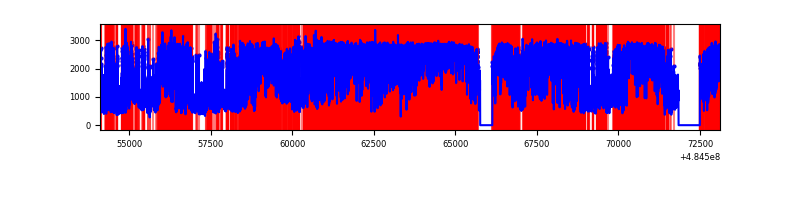 |
Top three noisy pixels from each quadrant. If the there are fewer than three noisy pixels in the level2.evt file, extra rows are filled as -1
| Pixel properties | Quadrant properties | ||||||
|---|---|---|---|---|---|---|---|
| Quadrant | DetID | PixID | Counts | Sigma | Mean | Median | Sigma |
| A | 3 | 14 | 1129957 | 2418.52 | 1888 | 1842 | 466.4 |
| A | 4 | 3 | 754282 | 1613.13 | 1888 | 1842 | 466.4 |
| A | 4 | 95 | 520778 | 1112.53 | 1888 | 1842 | 466.4 |
| B | 7 | 0 | 4182222 | 10817.52 | 1829 | 1764 | 386.5 |
| B | 4 | 206 | 2361890 | 6107.16 | 1829 | 1764 | 386.5 |
| B | 5 | 185 | 520466 | 1342.21 | 1829 | 1764 | 386.5 |
| C | 15 | 224 | 4205376 | 8641.71 | 1765 | 1750 | 486.4 |
| C | 13 | 3 | 994829 | 2041.55 | 1765 | 1750 | 486.4 |
| C | 15 | 147 | 904180 | 1855.19 | 1765 | 1750 | 486.4 |
| D | 12 | 17 | 13050890 | 32810.92 | 1367 | 1306 | 397.7 |
| D | 6 | 42 | 4724248 | 11875.02 | 1367 | 1306 | 397.7 |
| D | 13 | 187 | 3133685 | 7875.82 | 1367 | 1306 | 397.7 |
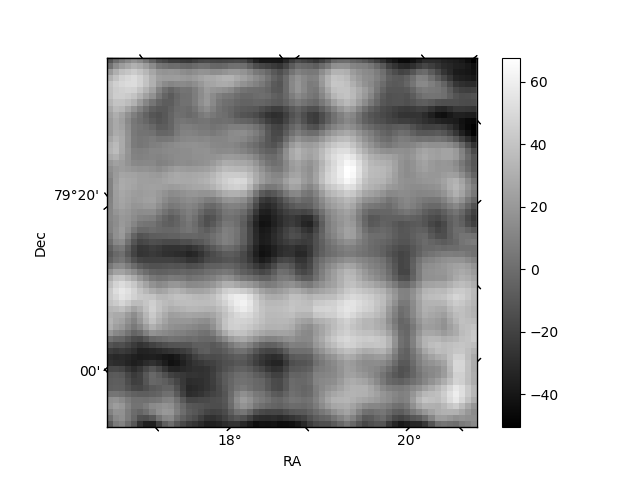
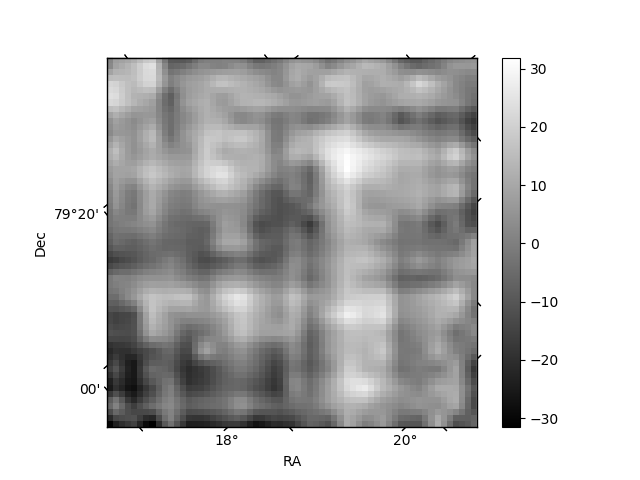
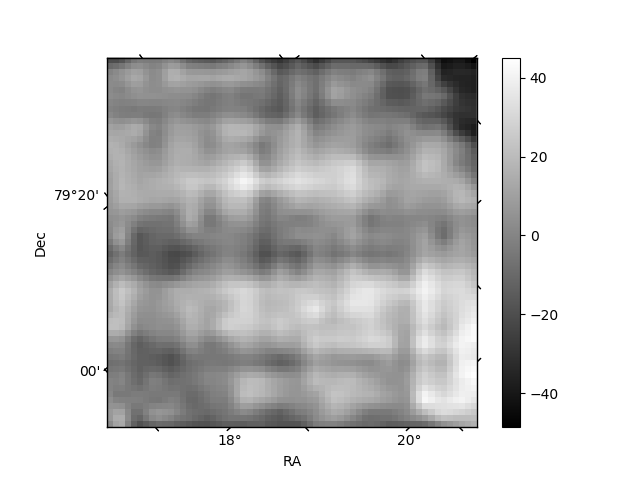
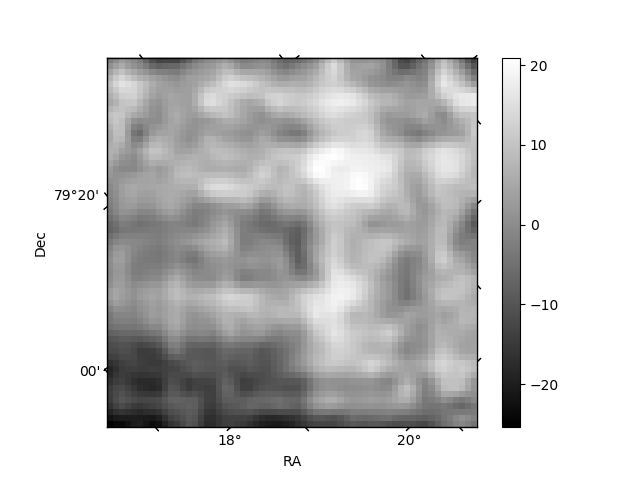
Histogram calculated using DETX and DETY for each event in the final _common_clean file
| Quadrant A | 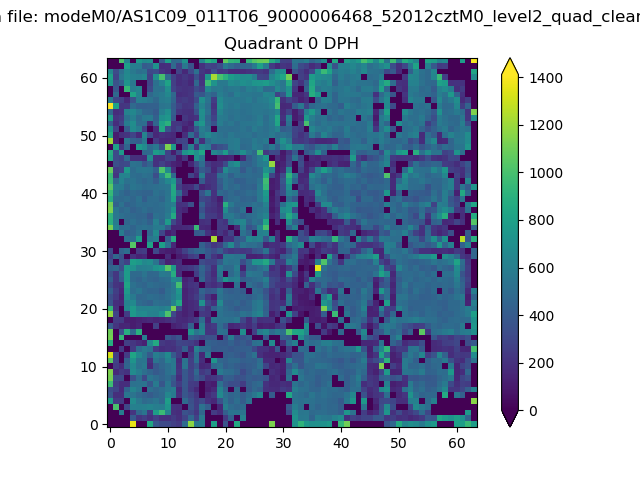 |
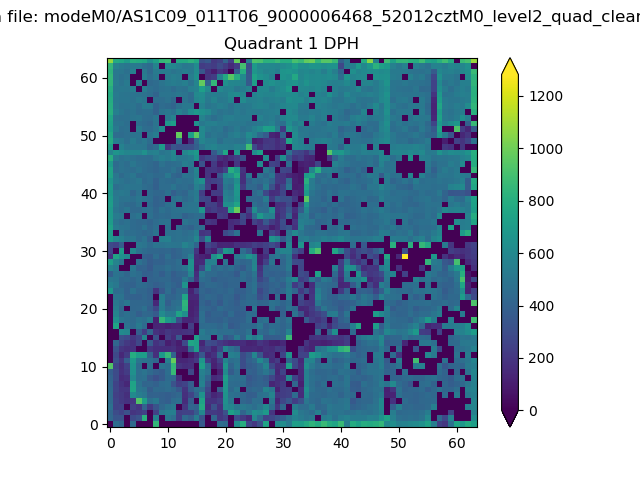 |
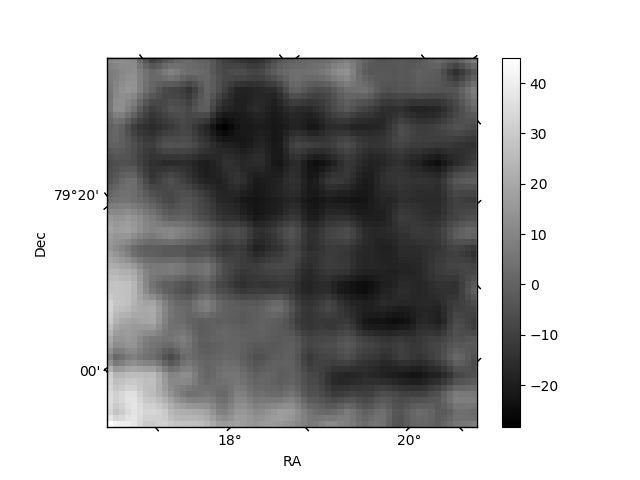
Quadrant B |
|---|---|---|---|
| Quadrant D | 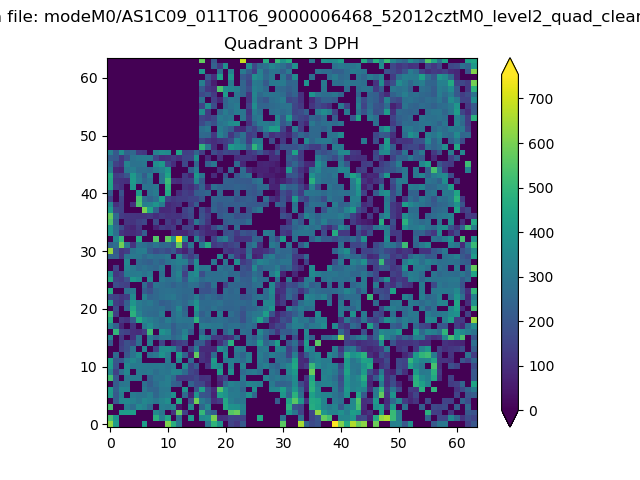 |
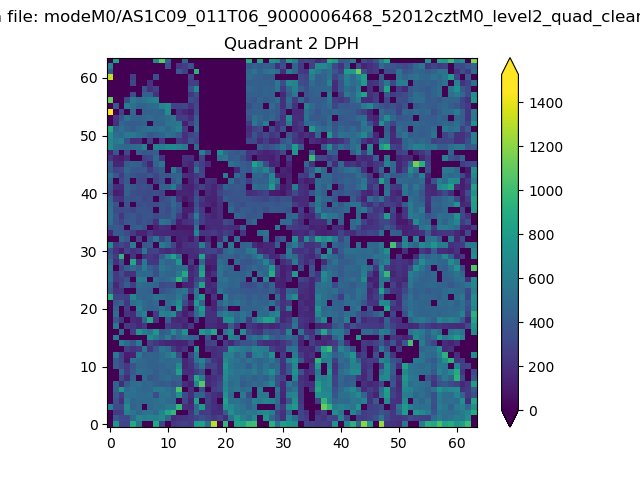 |
Quadrant C |
| Plot type | Count rate plots | Images |
|---|---|---|
| Comparison with Poisson distribution Blue bars denote a histogram of data divided into 1 sec bins. Red curve is a Poisson curve with rate = median count rate of data. |
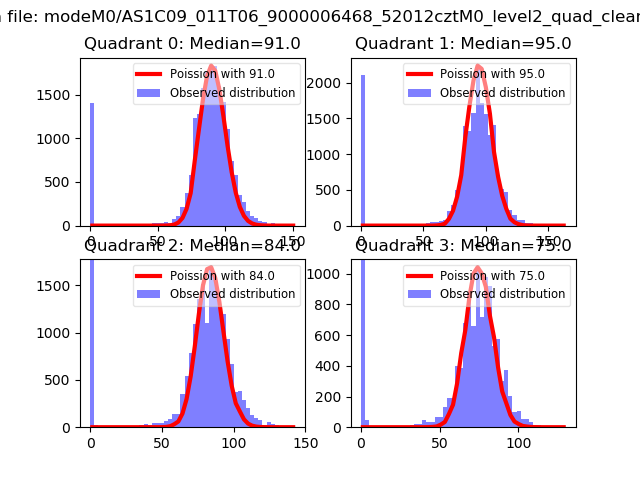 |
 |
| Quadrant-wise count rates Data is divided into 100 sec bins |
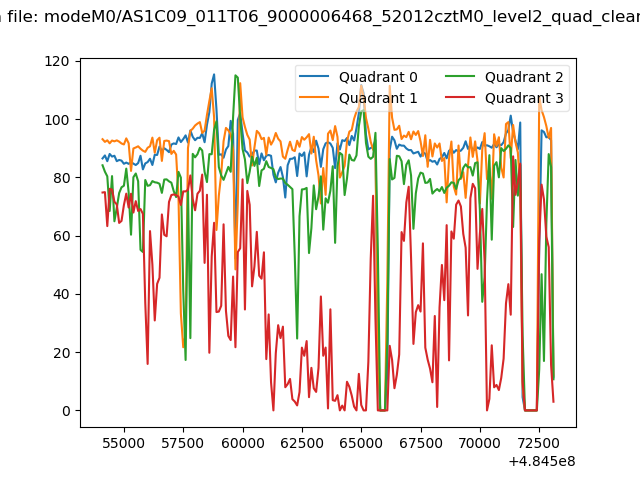 |
|
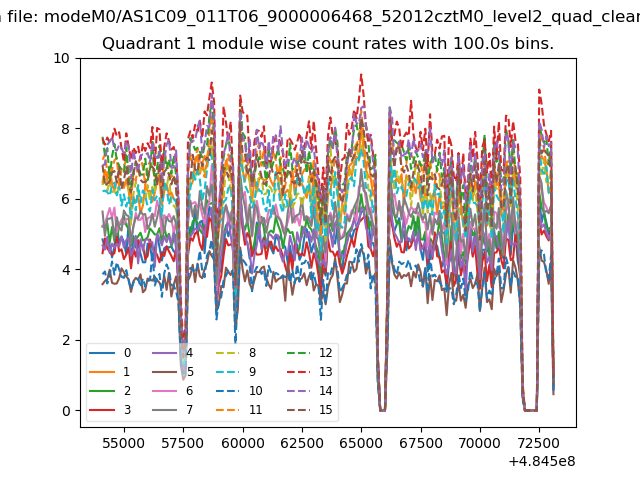
| Module-wise count rates for Quadrant A Data is divided into 100 sec bins |
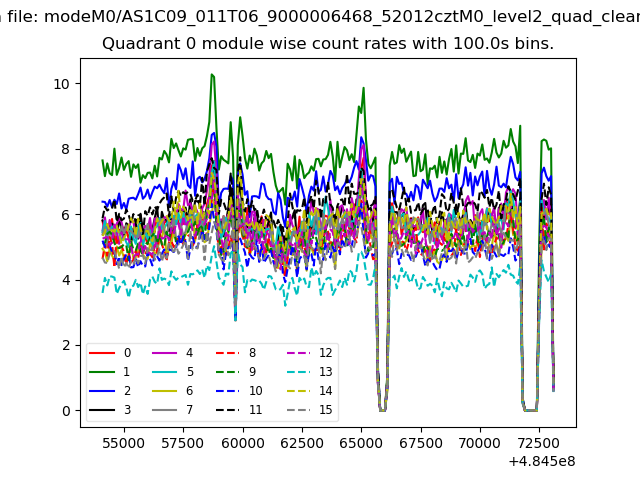 |
 |
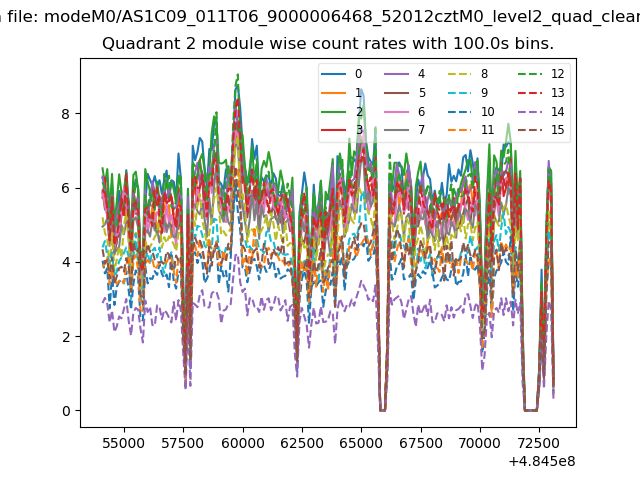
| Module-wise count rates for Quadrant B Data is divided into 100 sec bins |
 |
 |
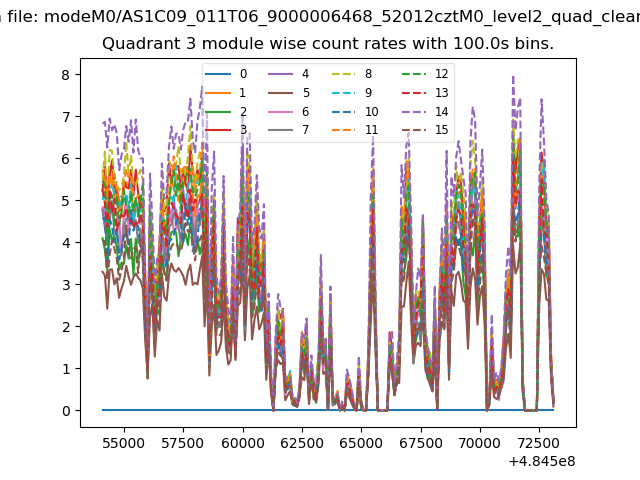
| Module-wise count rates for Quadrant C Data is divided into 100 sec bins |
 |
 |
| Module-wise count rates for Quadrant D Data is divided into 100 sec bins |
 |
 |
| Parameter | Plot |
|---|---|
| CZT HV Monitor |  |
| D_VDD | 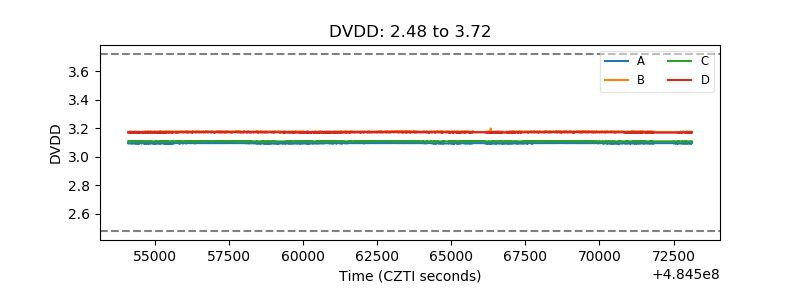 |
| Temperature 1 | 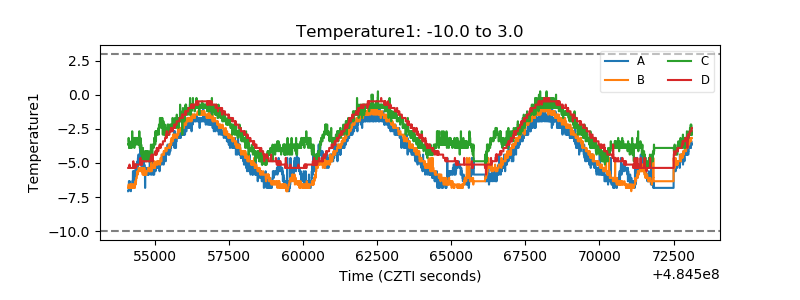 |
| Veto HV Monitor | 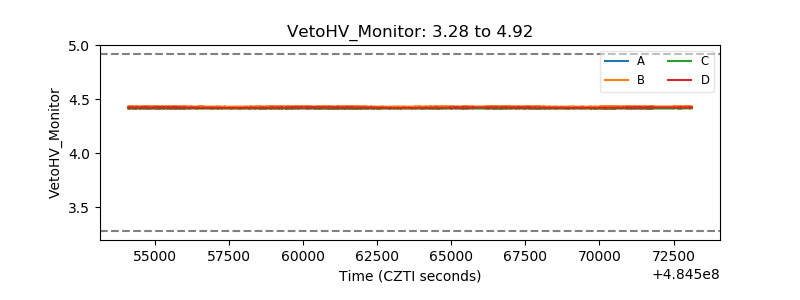 |
| Veto LLD | 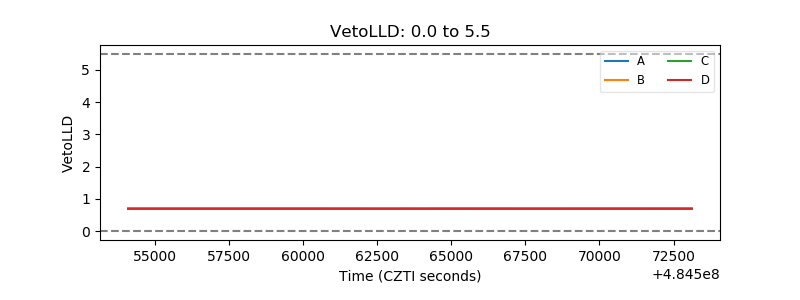 |
| Alpha Counter | 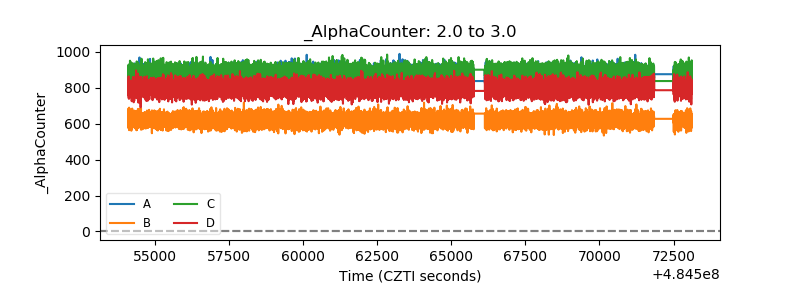 |
| _CPM_Rate | 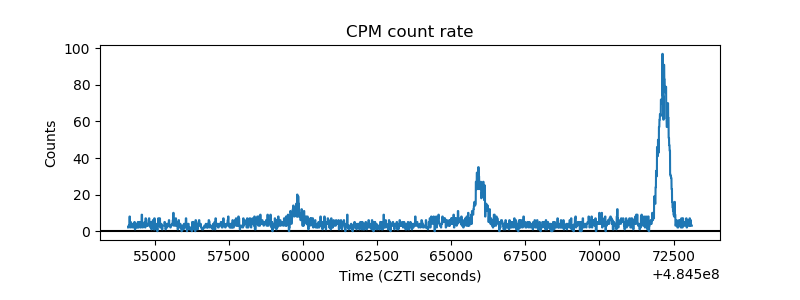 |
| CZT Counter | 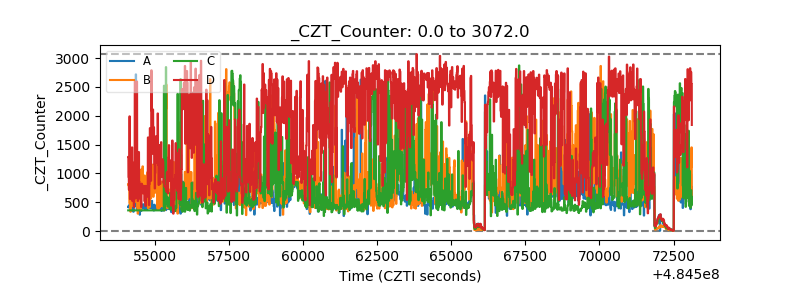 |
| +2.5 Volts monitor | 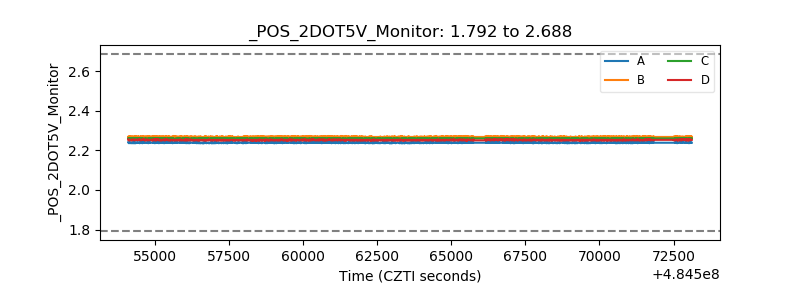 |
| +5 Volts monitor | 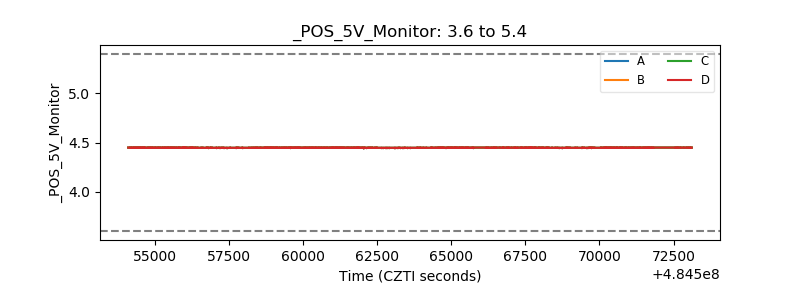 |
| _ROLL_ROT | 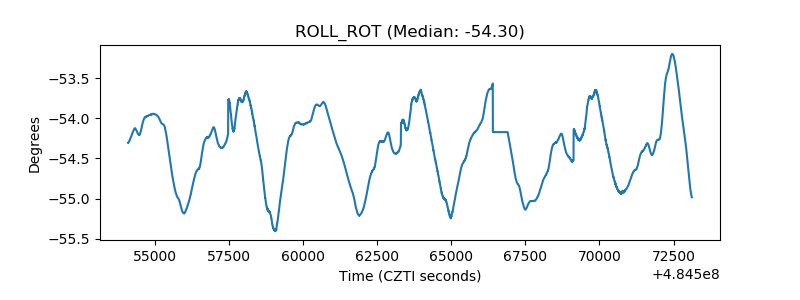 |
| _Roll_DEC | 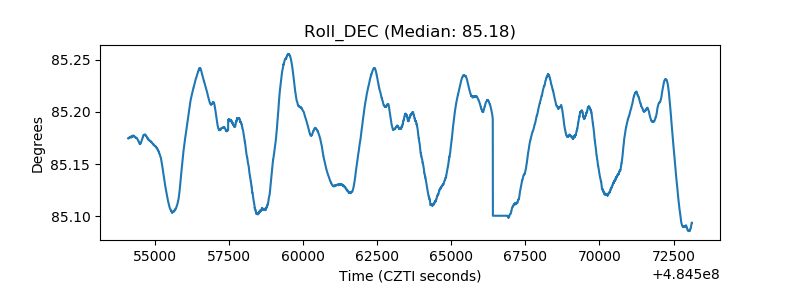 |
| _Roll_RA | 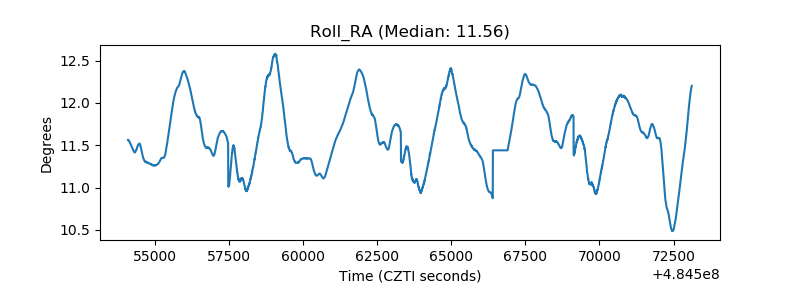 |
| Veto Counter | 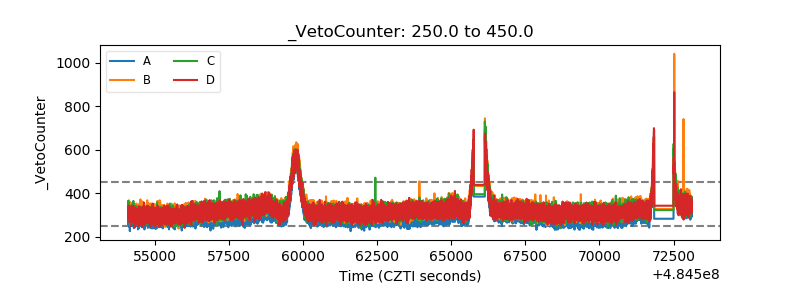 |