| Param | Original file | Final file |
|---|---|---|
| Filename | modeM0/AS1C09_011T06_9000006468_52013cztM0_level2.fits | modeM0/AS1C09_011T06_9000006468_52013cztM0_level2_quad_clean.evt |
| Size (bytes) | 881,233,920 | 89,651,520 |
| Size | 840.4 MB | 85.5 MB |
| Events in quadrant A | 6,991,340 | 593,981 |
| Events in quadrant B | 6,645,577 | 661,341 |
| Events in quadrant C | 7,050,248 | 551,896 |
| Events in quadrant D | 11,395,146 | 420,030 |
| Mode M0 | |||
|---|---|---|---|
| Quadrant | BADHDUFLAG | Total packets | Discarded packets |
| A | 0 | 25626 | 1 |
| B | 0 | 24657 | 1 |
| C | 0 | 25761 | 1 |
| D | 0 | 38722 | 2 |
| Mode M9 | |||
|---|---|---|---|
| Quadrant | BADHDUFLAG | Total packets | Discarded packets |
| A | 0 | 8 | 0 |
| B | 0 | 8 | 0 |
| C | 0 | 8 | 0 |
| D | 0 | 8 | 0 |
| Mode SS | |||
|---|---|---|---|
| Quadrant | BADHDUFLAG | Total packets | Discarded packets |
| A | 0 | 144 | 0 |
| B | 0 | 144 | 0 |
| C | 0 | 144 | 0 |
| D | 0 | 144 | 0 |
| Quadrant | Total seconds | Saturated seconds | Saturation percentage |
|---|---|---|---|
| A | 6978 | 819 | 11.736887% |
| B | 6979 | 658 | 9.428285% |
| C | 6979 | 1045 | 14.973492% |
| D | 6978 | 2398 | 34.365148% |
Noise dominated data is calculated using 1-second bins in cleaned event files. If a bin has >2000 counts, and if more than 50% of those come from <1% of pixels, then it is considered to be noise-dominated and hence unusable.
| Quadrant | # 1 sec bins | Bins with >0 counts | Bins with >2000 counts | High rate bins dominated by noise | Noise dominated (total time) | Noise dominated (detector-on time) | Marked lightcurve |
|---|---|---|---|---|---|---|---|
| A | 7833 | 6978 | 706 | 706 | 9.01% | 10.12% | 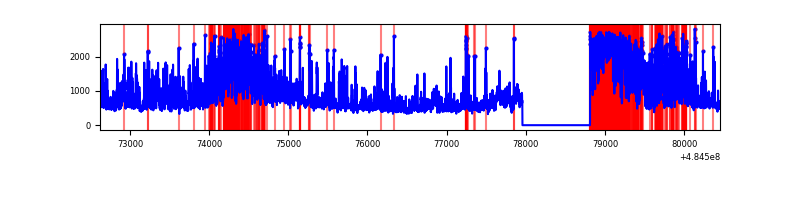 |
| B | 7834 | 6979 | 376 | 376 | 4.80% | 5.39% | 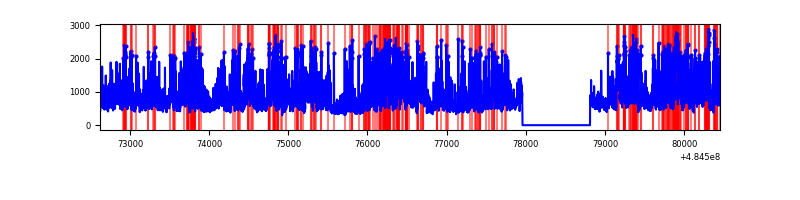 |
| C | 7833 | 6978 | 1002 | 1002 | 12.79% | 14.36% | 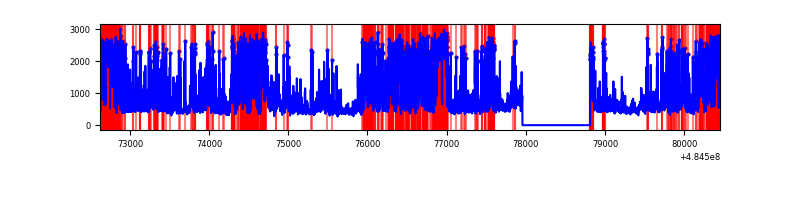 |
| D | 7833 | 6978 | 2600 | 2600 | 33.19% | 37.26% | 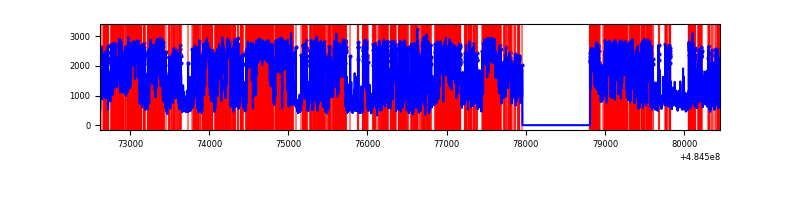 |
Top three noisy pixels from each quadrant. If the there are fewer than three noisy pixels in the level2.evt file, extra rows are filled as -1
| Pixel properties | Quadrant properties | ||||||
|---|---|---|---|---|---|---|---|
| Quadrant | DetID | PixID | Counts | Sigma | Mean | Median | Sigma |
| A | 4 | 95 | 2724532 | 15522.25 | 711 | 694 | 175.5 |
| A | 3 | 14 | 774570 | 4410.06 | 711 | 694 | 175.5 |
| A | 4 | 3 | 217123 | 1233.36 | 711 | 694 | 175.5 |
| B | 7 | 0 | 1780971 | 11709.44 | 712 | 687 | 152.0 |
| B | 12 | 32 | 603020 | 3961.72 | 712 | 687 | 152.0 |
| B | 5 | 185 | 453667 | 2979.38 | 712 | 687 | 152.0 |
| C | 15 | 224 | 3342391 | 18037.06 | 674 | 669 | 185.3 |
| C | 4 | 5 | 312254 | 1681.79 | 674 | 669 | 185.3 |
| C | 13 | 3 | 285095 | 1535.2 | 674 | 669 | 185.3 |
| D | 6 | 42 | 3139394 | 17811.7 | 618 | 591 | 176.2 |
| D | 12 | 17 | 2828697 | 16048.6 | 618 | 591 | 176.2 |
| D | 13 | 170 | 1249318 | 7086.13 | 618 | 591 | 176.2 |
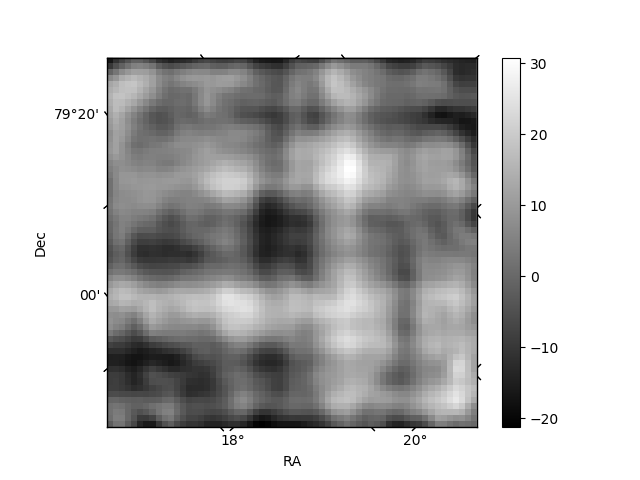
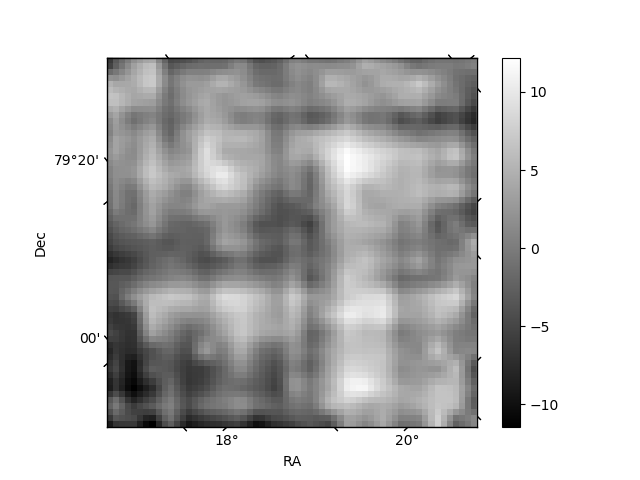
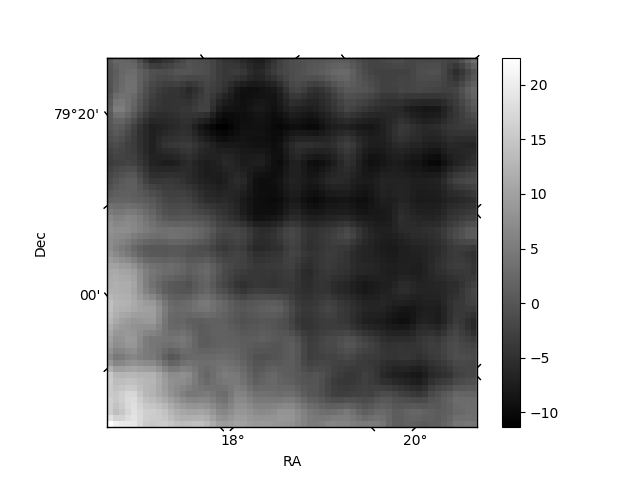
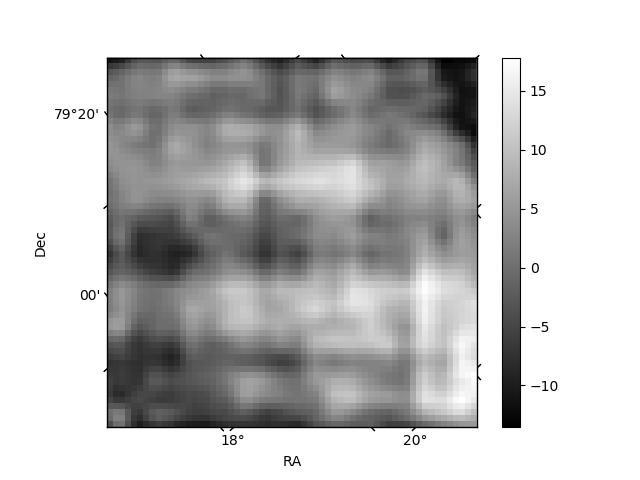
Histogram calculated using DETX and DETY for each event in the final _common_clean file
| Quadrant A | 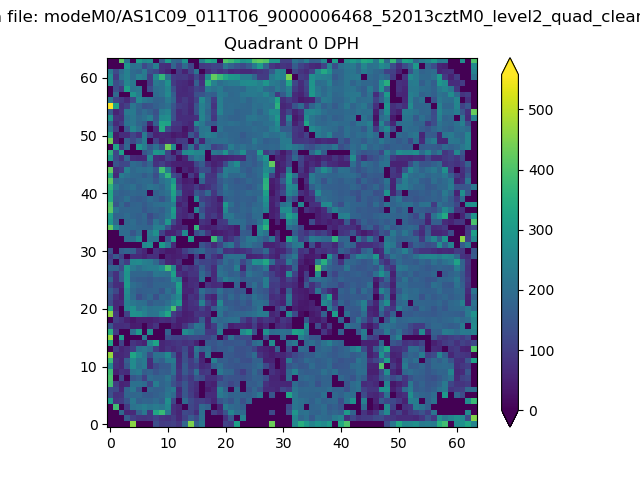 |
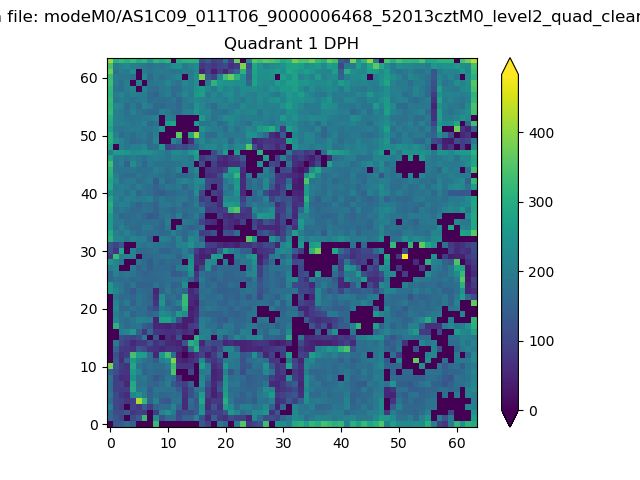 |
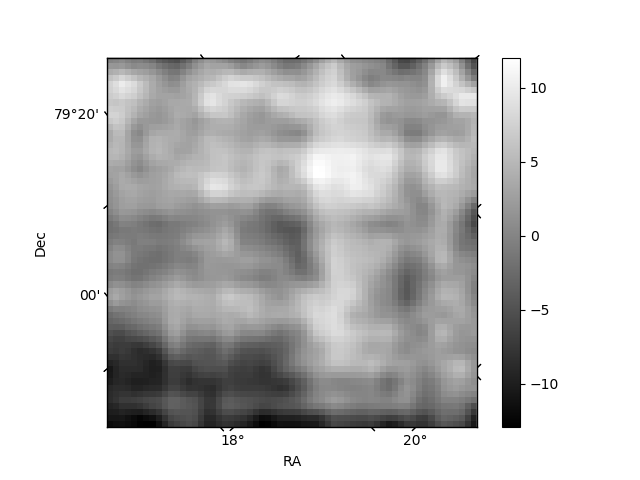
Quadrant B |
|---|---|---|---|
| Quadrant D | 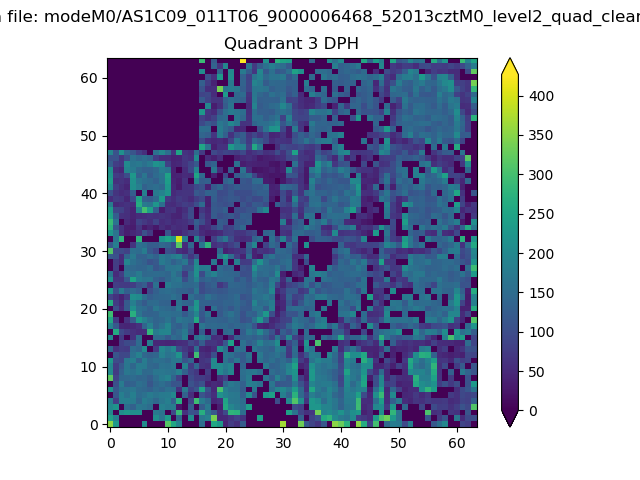 |
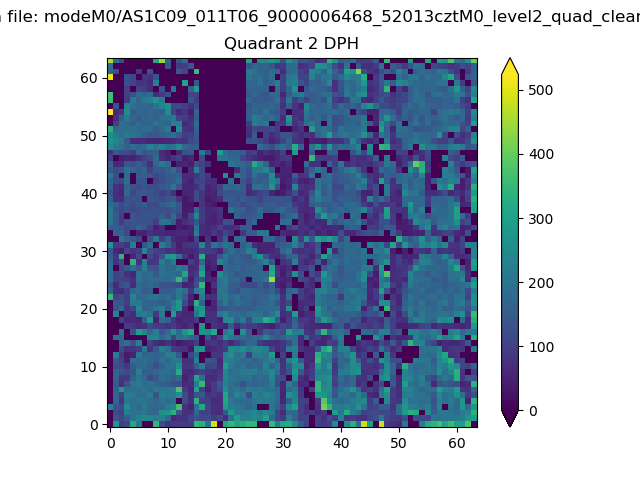 |
Quadrant C |
| Plot type | Count rate plots | Images |
|---|---|---|
| Comparison with Poisson distribution Blue bars denote a histogram of data divided into 1 sec bins. Red curve is a Poisson curve with rate = median count rate of data. |
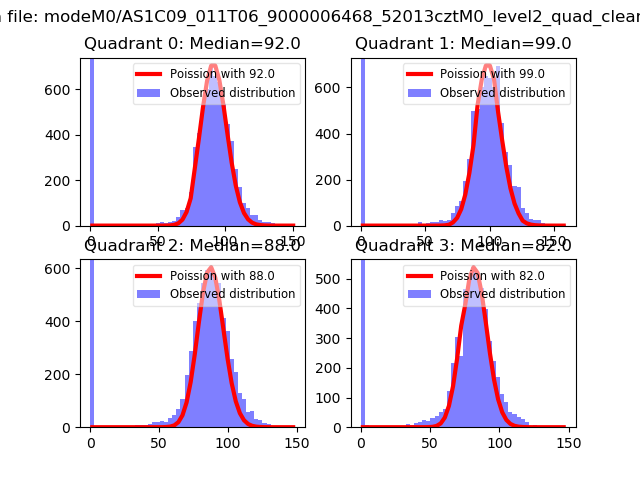 |
 |
| Quadrant-wise count rates Data is divided into 100 sec bins |
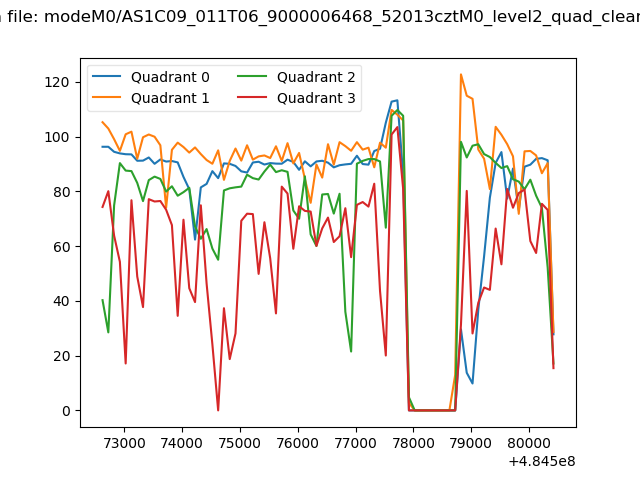 |
|
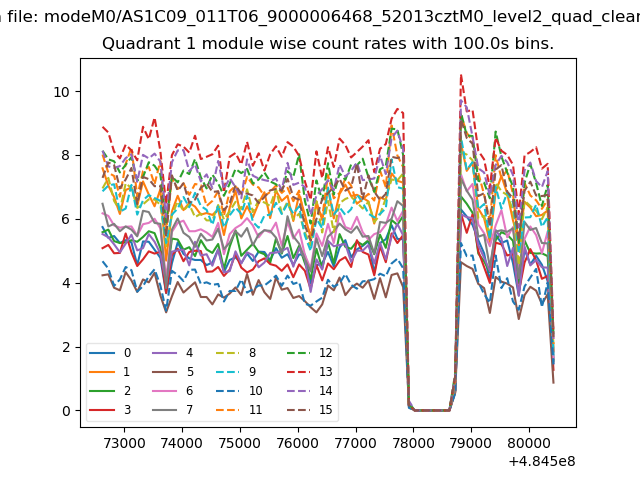
| Module-wise count rates for Quadrant A Data is divided into 100 sec bins |
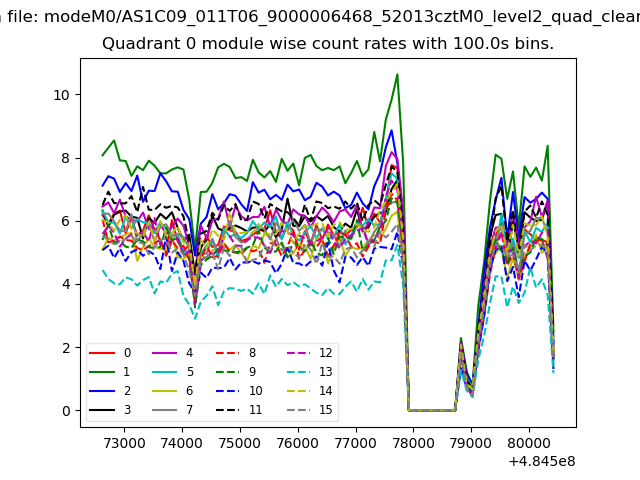 |
 |
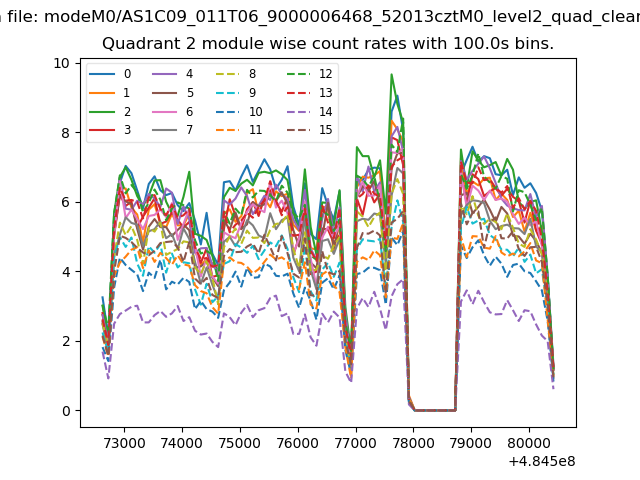
| Module-wise count rates for Quadrant B Data is divided into 100 sec bins |
 |
 |
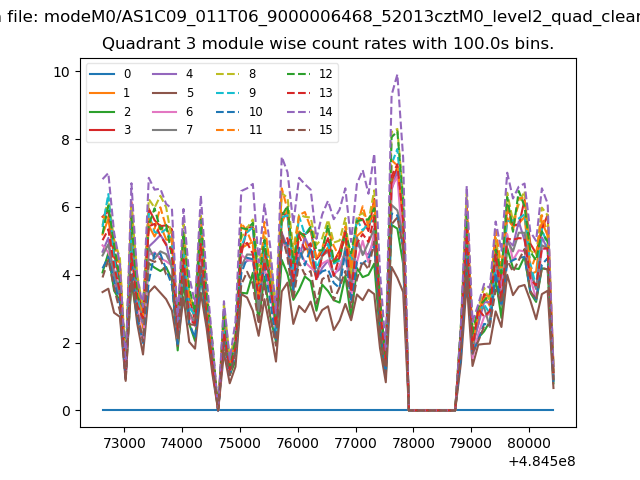
| Module-wise count rates for Quadrant C Data is divided into 100 sec bins |
 |
 |
| Module-wise count rates for Quadrant D Data is divided into 100 sec bins |
 |
 |
| Parameter | Plot |
|---|---|
| CZT HV Monitor | 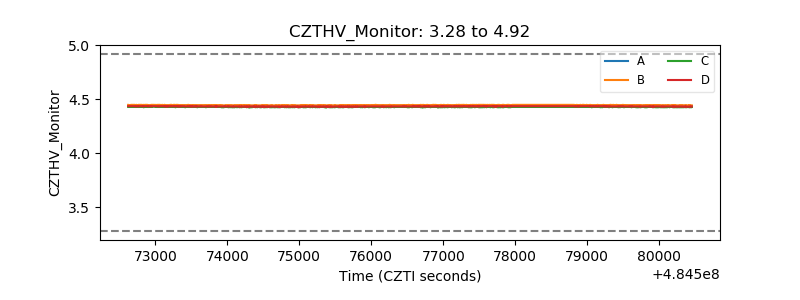 |
| D_VDD | 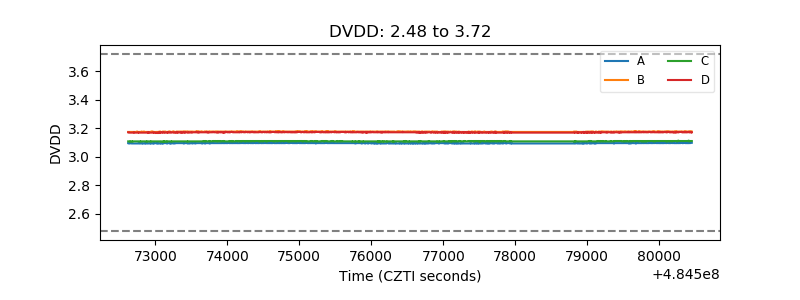 |
| Temperature 1 | 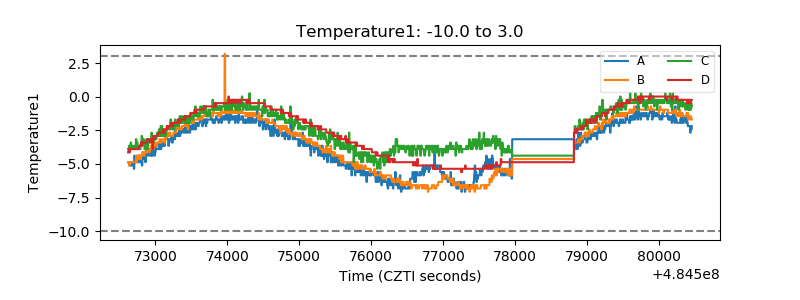 |
| Veto HV Monitor | 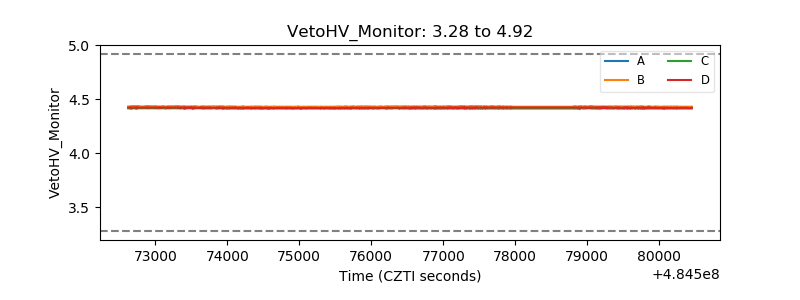 |
| Veto LLD | 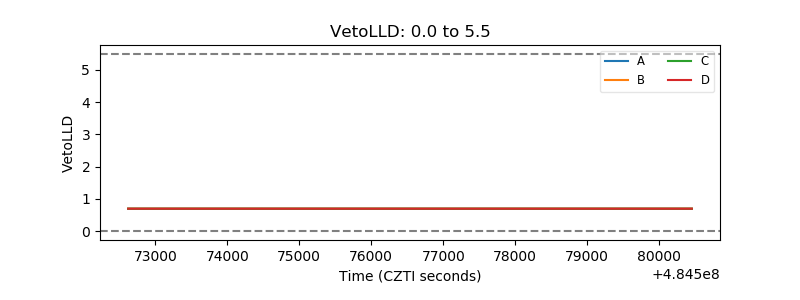 |
| Alpha Counter | 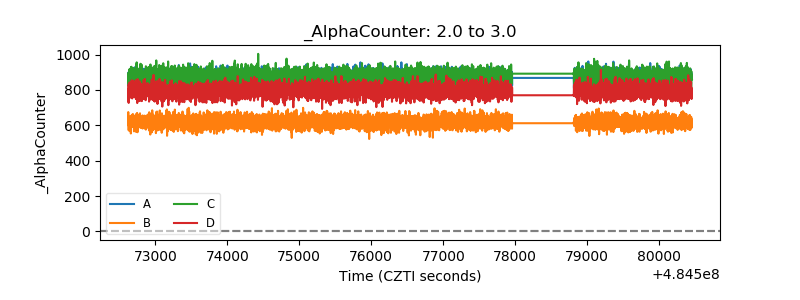 |
| _CPM_Rate | 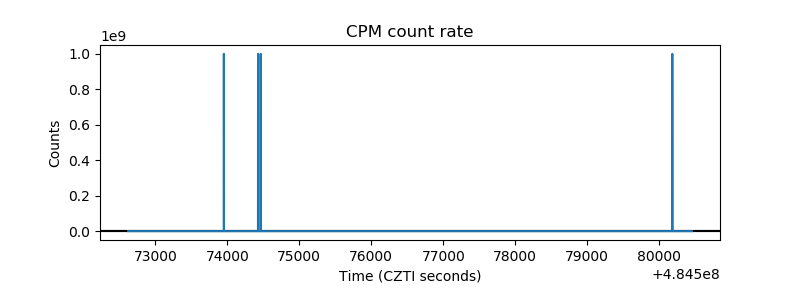 |
| CZT Counter | 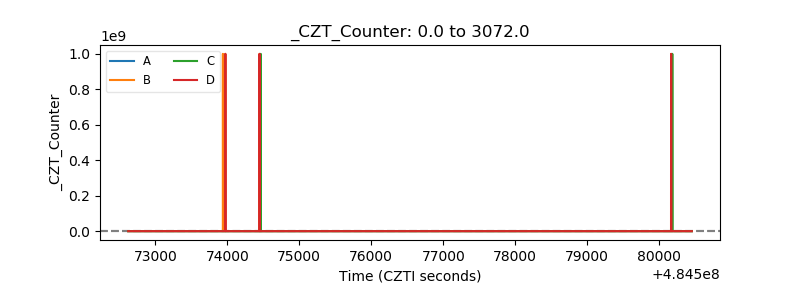 |
| +2.5 Volts monitor |  |
| +5 Volts monitor | 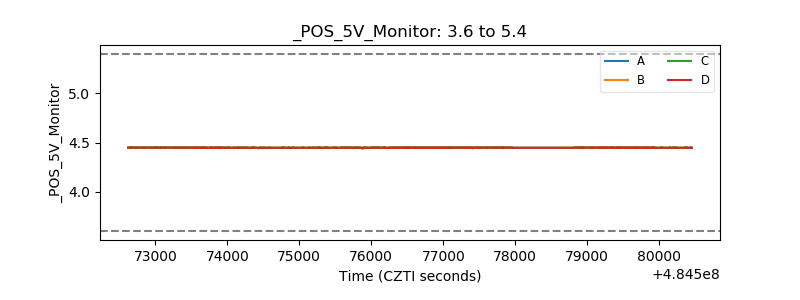 |
| _ROLL_ROT | 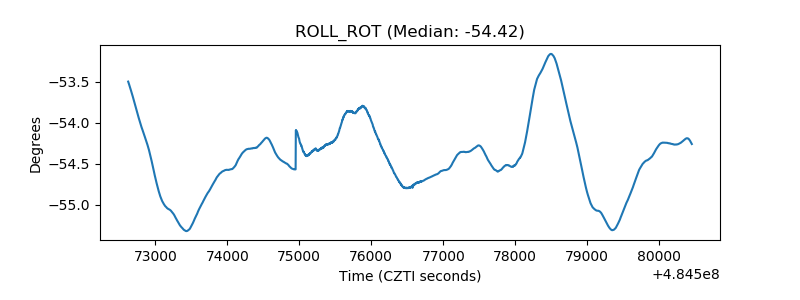 |
| _Roll_DEC | 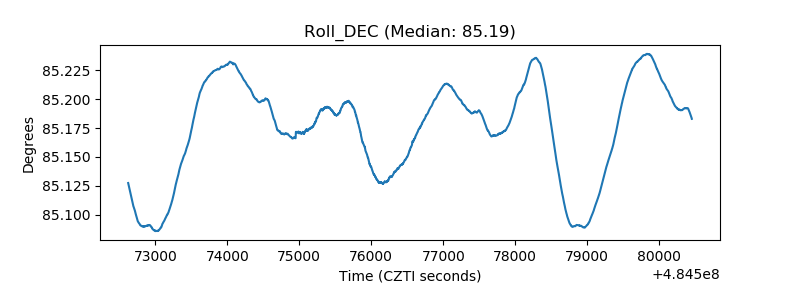 |
| _Roll_RA | 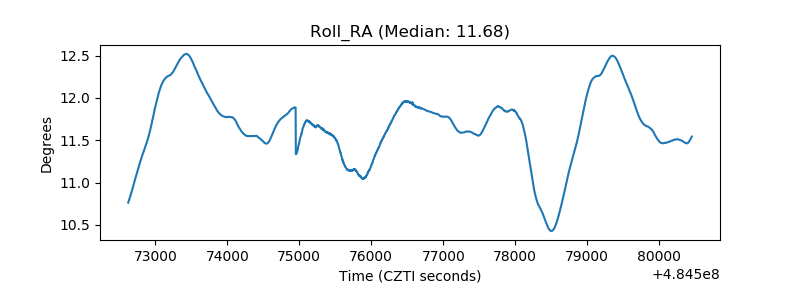 |
| Veto Counter | 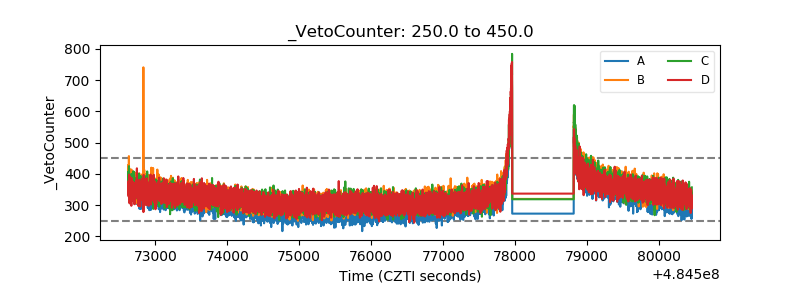 |