| Param | Original file | Final file |
|---|---|---|
| Filename | modeM0/AS1C09_011T06_9000006468_52015cztM0_level2.fits | modeM0/AS1C09_011T06_9000006468_52015cztM0_level2_quad_clean.evt |
| Size (bytes) | 721,537,920 | 82,074,240 |
| Size | 688.1 MB | 78.3 MB |
| Events in quadrant A | 5,063,268 | 559,645 |
| Events in quadrant B | 5,884,035 | 590,380 |
| Events in quadrant C | 5,853,659 | 510,121 |
| Events in quadrant D | 9,427,720 | 390,645 |
| Mode M0 | |||
|---|---|---|---|
| Quadrant | BADHDUFLAG | Total packets | Discarded packets |
| A | 0 | 19251 | 1 |
| B | 0 | 21790 | 1 |
| C | 0 | 21683 | 1 |
| D | 0 | 32338 | 1 |
| Mode M9 | |||
|---|---|---|---|
| Quadrant | BADHDUFLAG | Total packets | Discarded packets |
| A | 0 | 10 | 0 |
| B | 0 | 10 | 0 |
| C | 0 | 10 | 0 |
| D | 0 | 10 | 0 |
| Mode SS | |||
|---|---|---|---|
| Quadrant | BADHDUFLAG | Total packets | Discarded packets |
| A | 0 | 126 | 0 |
| B | 0 | 126 | 0 |
| C | 0 | 126 | 0 |
| D | 0 | 126 | 0 |
| Quadrant | Total seconds | Saturated seconds | Saturation percentage |
|---|---|---|---|
| A | 6215 | 475 | 7.642800% |
| B | 6216 | 687 | 11.052124% |
| C | 6216 | 812 | 13.063063% |
| D | 6215 | 1910 | 30.732100% |
Noise dominated data is calculated using 1-second bins in cleaned event files. If a bin has >2000 counts, and if more than 50% of those come from <1% of pixels, then it is considered to be noise-dominated and hence unusable.
| Quadrant | # 1 sec bins | Bins with >0 counts | Bins with >2000 counts | High rate bins dominated by noise | Noise dominated (total time) | Noise dominated (detector-on time) | Marked lightcurve |
|---|---|---|---|---|---|---|---|
| A | 7225 | 6215 | 391 | 391 | 5.41% | 6.29% | 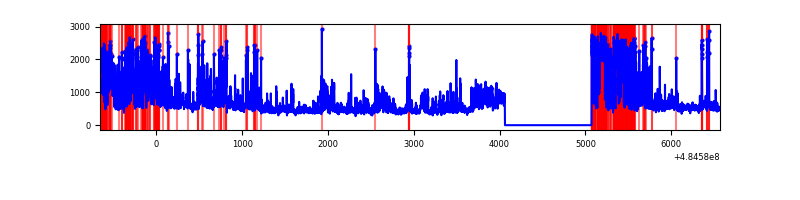 |
| B | 7226 | 6216 | 420 | 420 | 5.81% | 6.76% | 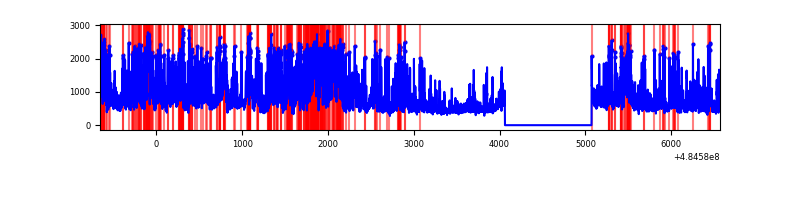 |
| C | 7226 | 6216 | 781 | 781 | 10.81% | 12.56% | 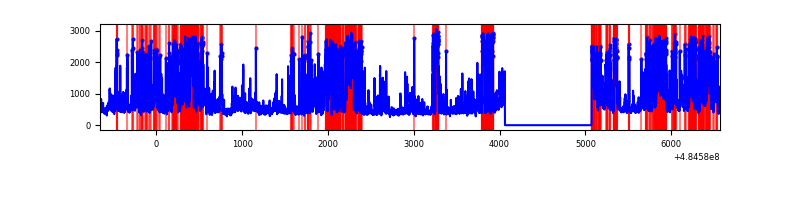 |
| D | 7224 | 6214 | 2058 | 2058 | 28.49% | 33.12% | 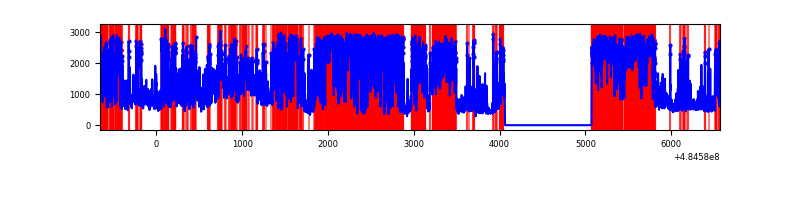 |
Top three noisy pixels from each quadrant. If the there are fewer than three noisy pixels in the level2.evt file, extra rows are filled as -1
| Pixel properties | Quadrant properties | ||||||
|---|---|---|---|---|---|---|---|
| Quadrant | DetID | PixID | Counts | Sigma | Mean | Median | Sigma |
| A | 4 | 95 | 1481631 | 9380.08 | 635 | 619 | 157.9 |
| A | 3 | 14 | 324395 | 2050.66 | 635 | 619 | 157.9 |
| A | 4 | 3 | 278560 | 1760.36 | 635 | 619 | 157.9 |
| B | 7 | 0 | 1482708 | 11086.5 | 632 | 610 | 133.7 |
| B | 12 | 32 | 638357 | 4770.52 | 632 | 610 | 133.7 |
| B | 0 | 171 | 248177 | 1851.87 | 632 | 610 | 133.7 |
| C | 15 | 224 | 2109530 | 12525.93 | 607 | 601 | 168.4 |
| C | 4 | 5 | 458929 | 2722.23 | 607 | 601 | 168.4 |
| C | 13 | 3 | 412300 | 2445.28 | 607 | 601 | 168.4 |
| D | 12 | 17 | 4208874 | 27016.96 | 545 | 521 | 155.8 |
| D | 6 | 42 | 1492469 | 9578.07 | 545 | 521 | 155.8 |
| D | 8 | 176 | 556065 | 3566.5 | 545 | 521 | 155.8 |
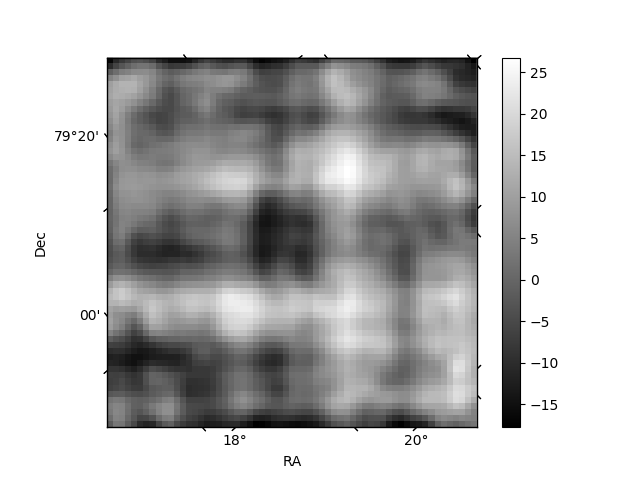
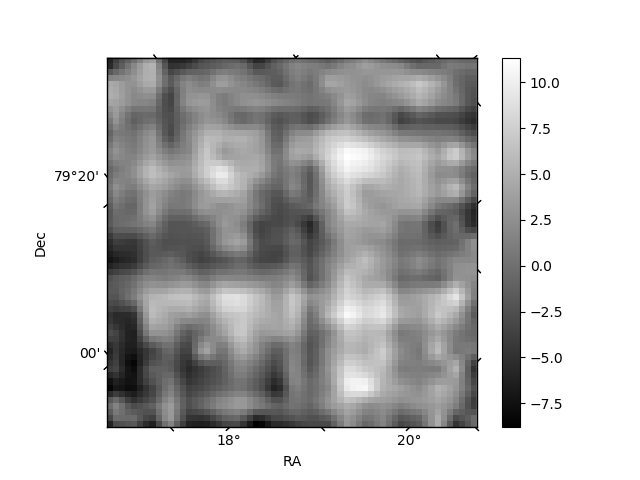
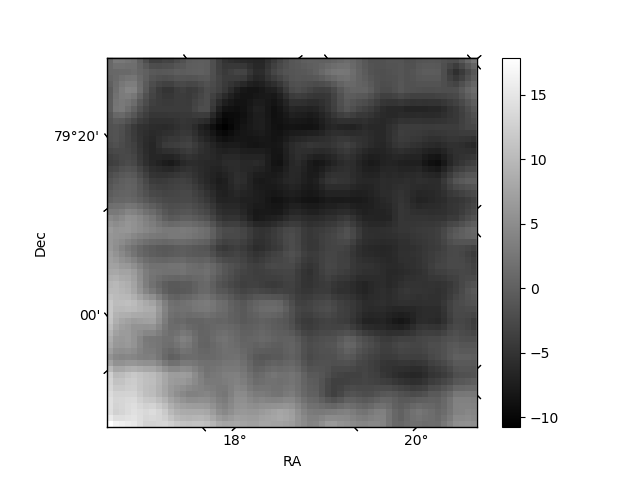
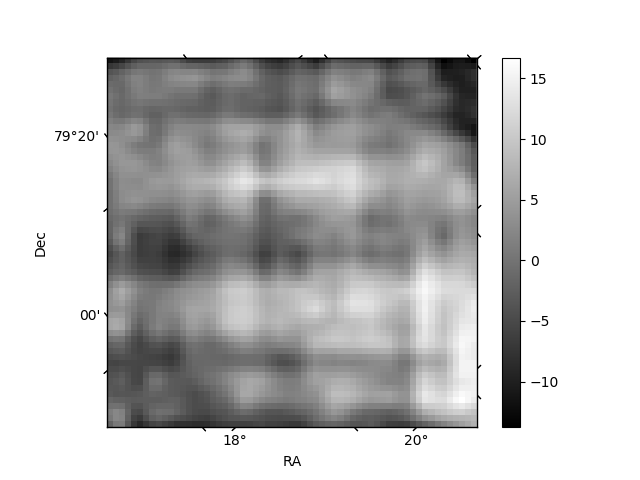
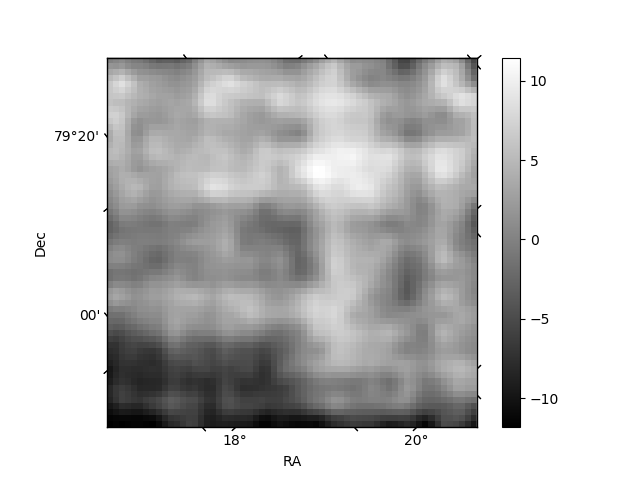
Histogram calculated using DETX and DETY for each event in the final _common_clean file
| Quadrant A | 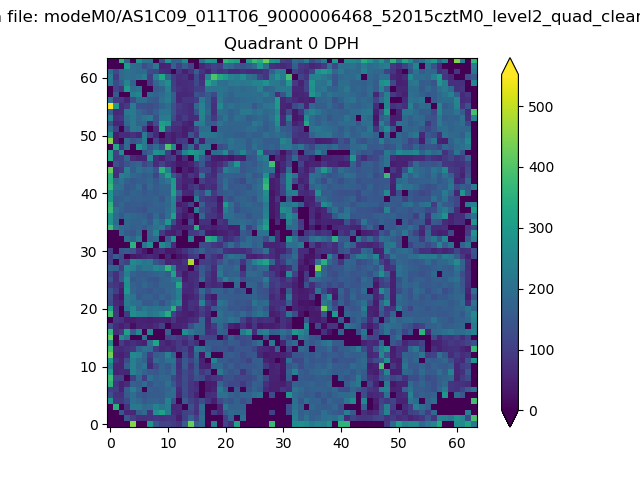 |
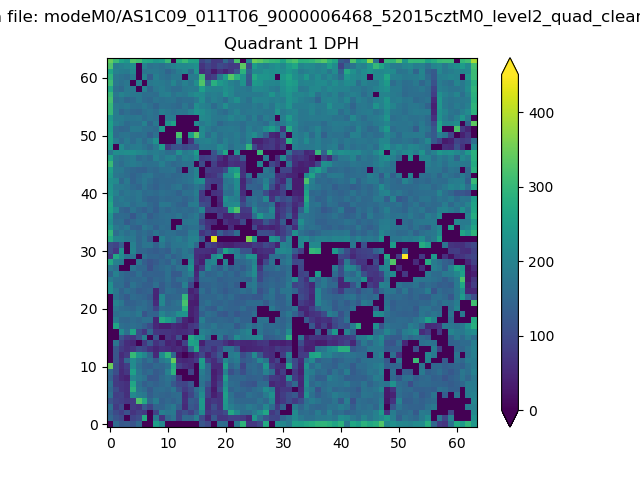 |
Quadrant B |
|---|---|---|---|
| Quadrant D | 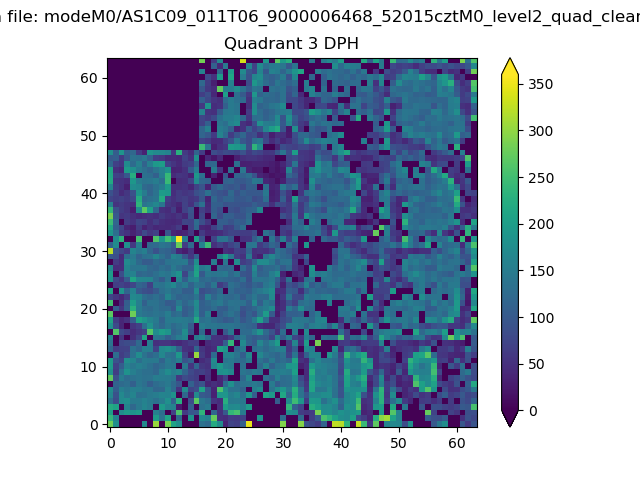 |
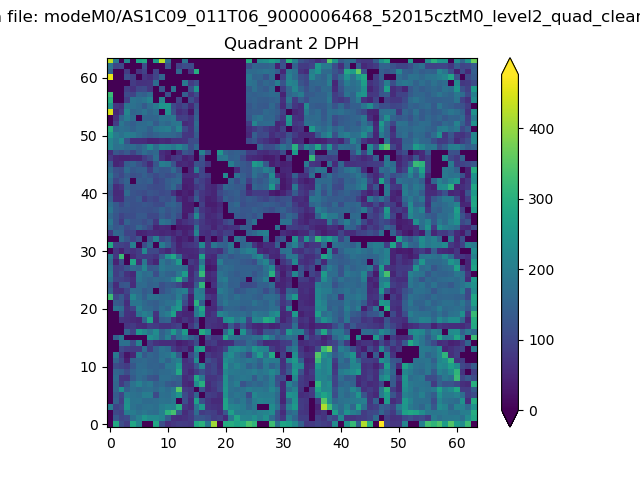 |
Quadrant C |
| Plot type | Count rate plots | Images |
|---|---|---|
| Comparison with Poisson distribution Blue bars denote a histogram of data divided into 1 sec bins. Red curve is a Poisson curve with rate = median count rate of data. |
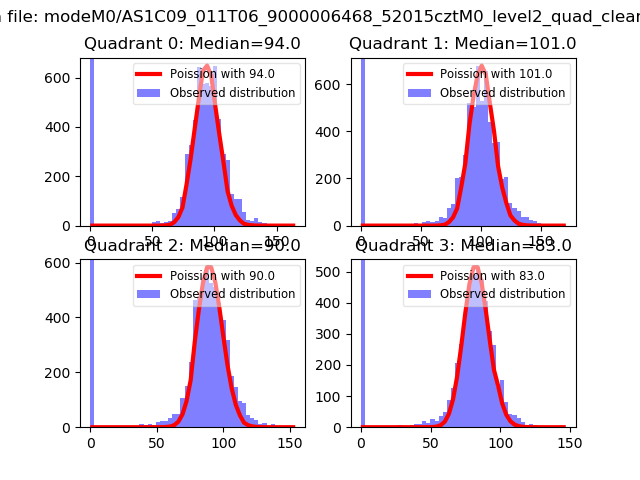 |
 |
| Quadrant-wise count rates Data is divided into 100 sec bins |
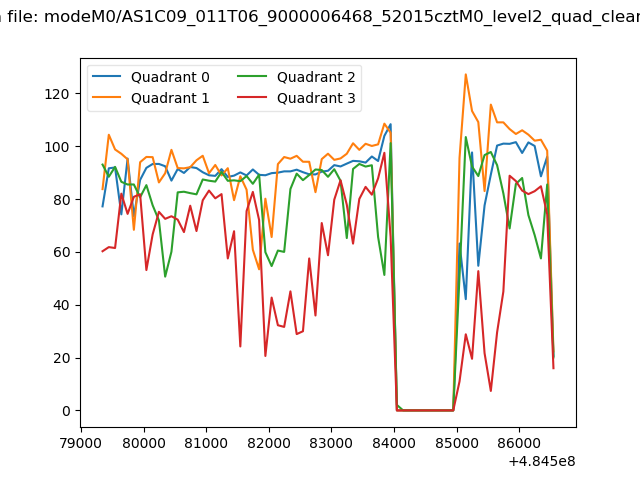 |
|
| Module-wise count rates for Quadrant A Data is divided into 100 sec bins |
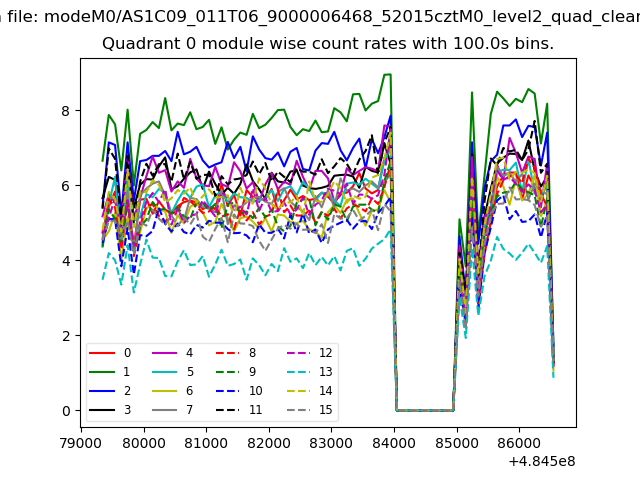 |
 |
| Module-wise count rates for Quadrant B Data is divided into 100 sec bins |
 |
 |
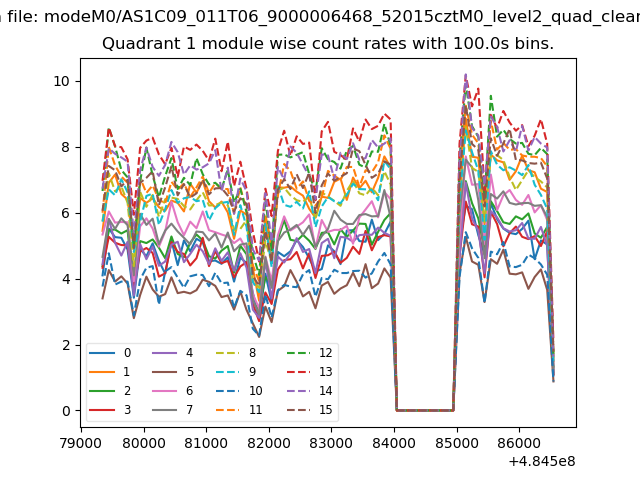
| Module-wise count rates for Quadrant C Data is divided into 100 sec bins |
 |
 |
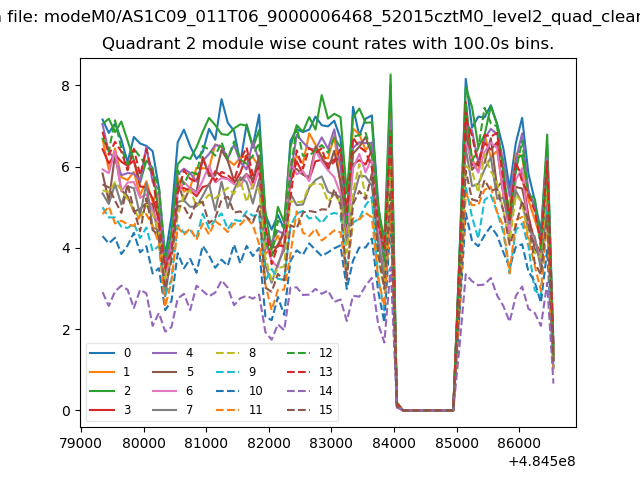
| Module-wise count rates for Quadrant D Data is divided into 100 sec bins |
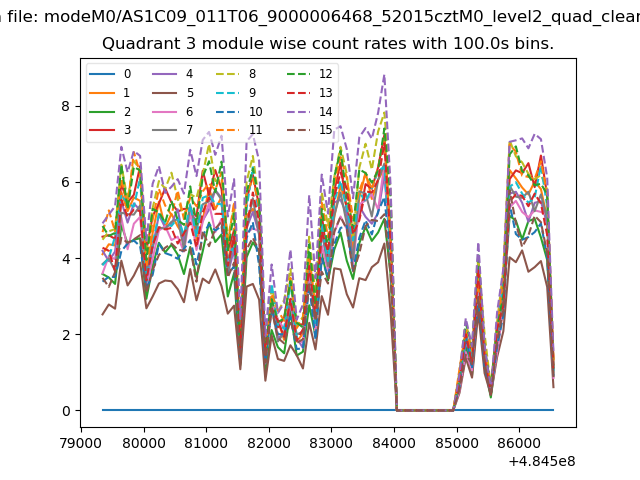 |
 |
| Parameter | Plot |
|---|---|
| CZT HV Monitor | 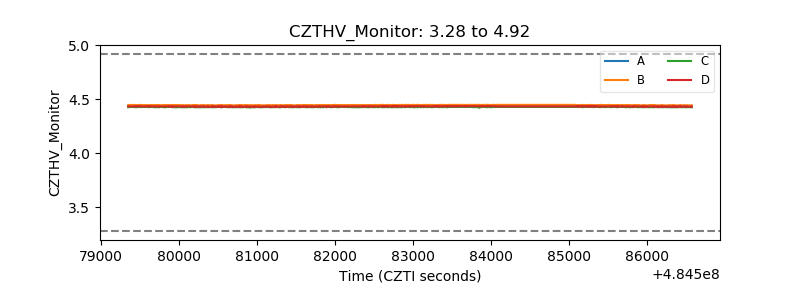 |
| D_VDD | 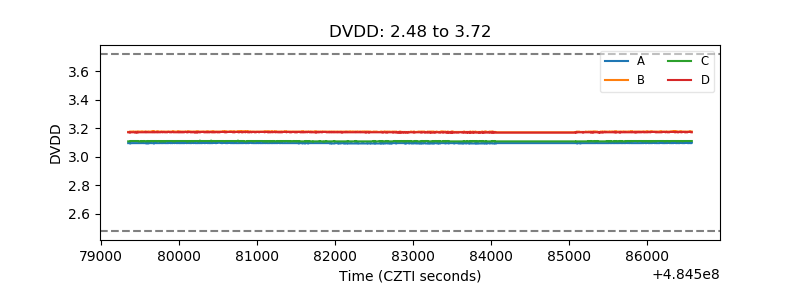 |
| Temperature 1 | 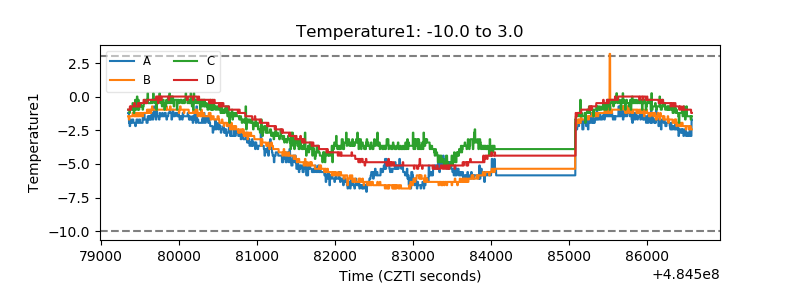 |
| Veto HV Monitor | 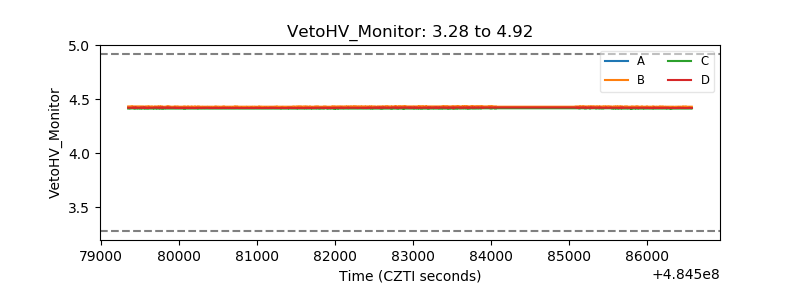 |
| Veto LLD | 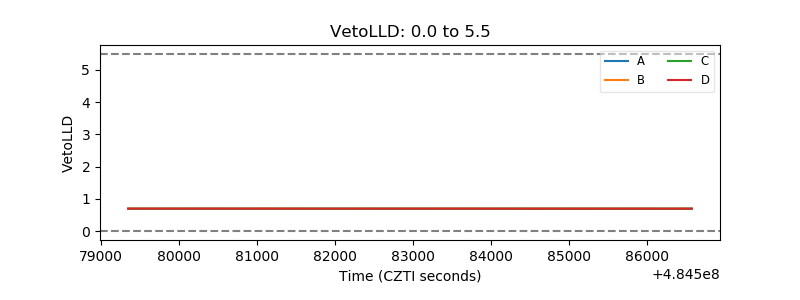 |
| Alpha Counter | 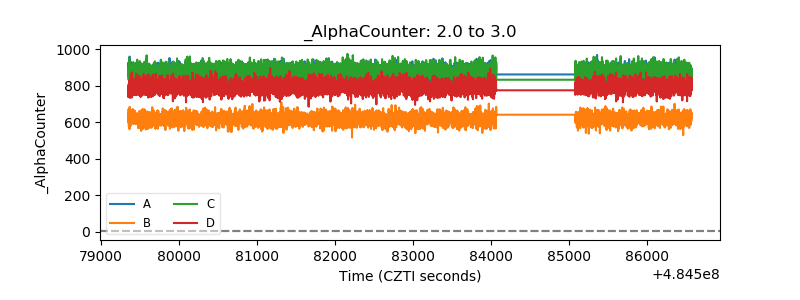 |
| _CPM_Rate | 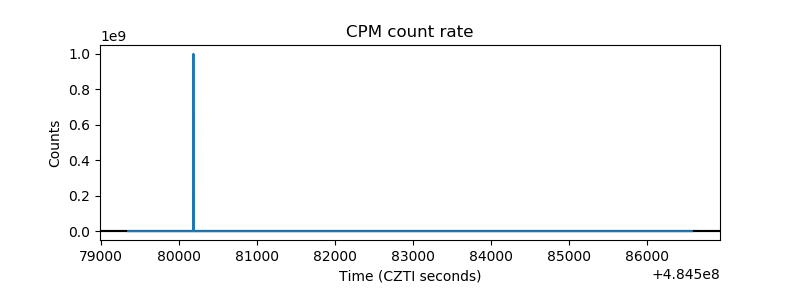 |
| CZT Counter | 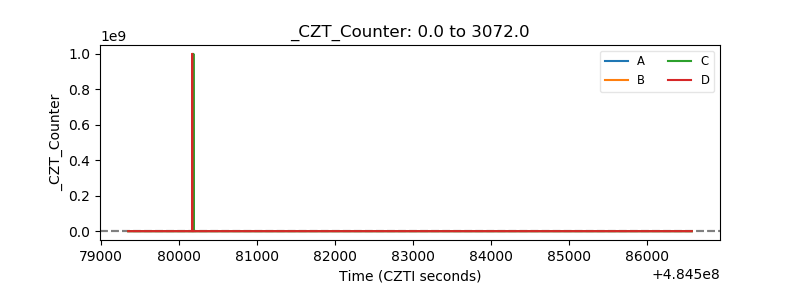 |
| +2.5 Volts monitor | 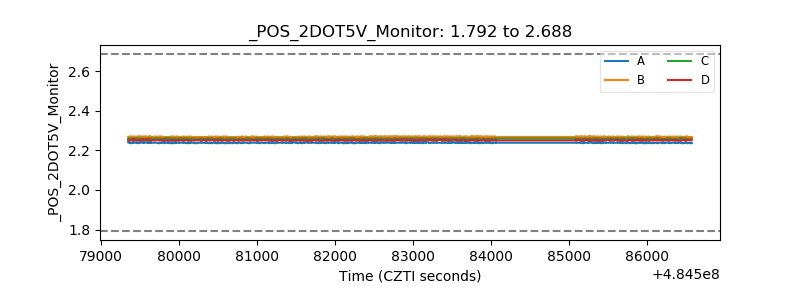 |
| +5 Volts monitor | 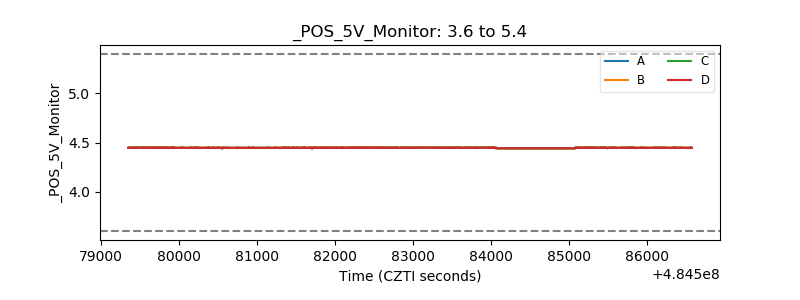 |
| _ROLL_ROT | 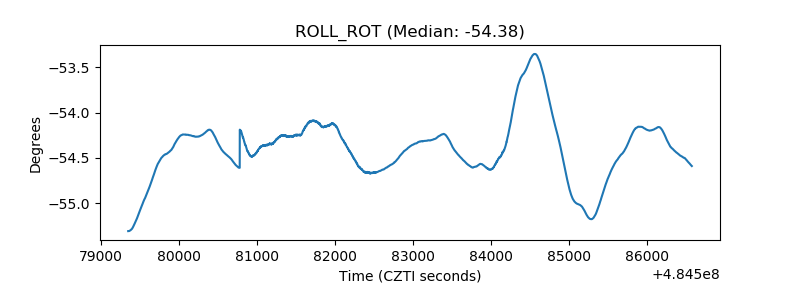 |
| _Roll_DEC | 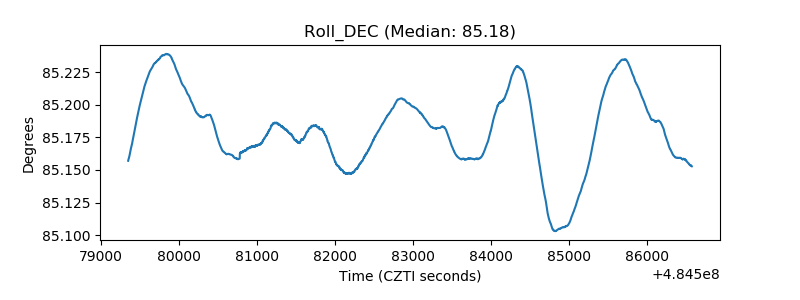 |
| _Roll_RA | 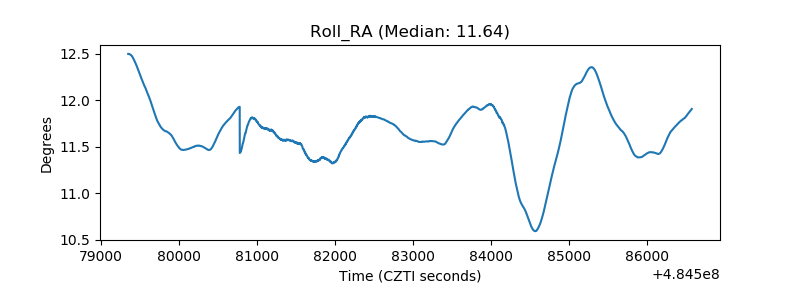 |
| Veto Counter | 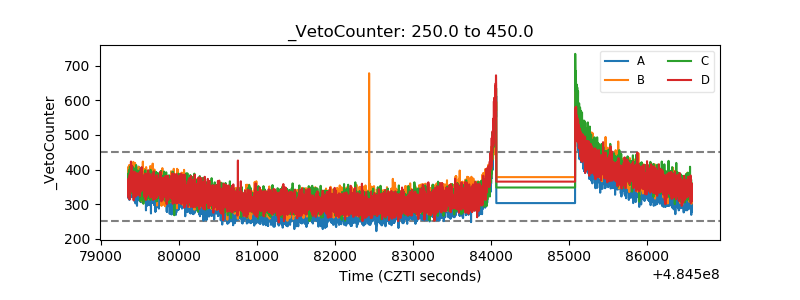 |