| Param | Original file | Final file |
|---|---|---|
| Filename | modeM0/AS1C09_011T06_9000006468_52016cztM0_level2.fits | modeM0/AS1C09_011T06_9000006468_52016cztM0_level2_quad_clean.evt |
| Size (bytes) | 616,587,840 | 85,271,040 |
| Size | 588.0 MB | 81.3 MB |
| Events in quadrant A | 4,065,835 | 589,012 |
| Events in quadrant B | 4,890,793 | 617,907 |
| Events in quadrant C | 6,852,344 | 471,225 |
| Events in quadrant D | 6,539,498 | 474,873 |
| Mode M0 | |||
|---|---|---|---|
| Quadrant | BADHDUFLAG | Total packets | Discarded packets |
| A | 0 | 16349 | 1 |
| B | 0 | 18743 | 1 |
| C | 0 | 24673 | 6 |
| D | 0 | 23805 | 1 |
| Mode M9 | |||
|---|---|---|---|
| Quadrant | BADHDUFLAG | Total packets | Discarded packets |
| A | 0 | 11 | 0 |
| B | 0 | 11 | 0 |
| C | 0 | 11 | 0 |
| D | 0 | 11 | 0 |
| Mode SS | |||
|---|---|---|---|
| Quadrant | BADHDUFLAG | Total packets | Discarded packets |
| A | 0 | 124 | 0 |
| B | 0 | 124 | 0 |
| C | 0 | 124 | 0 |
| D | 0 | 124 | 0 |
| Quadrant | Total seconds | Saturated seconds | Saturation percentage |
|---|---|---|---|
| A | 6140 | 173 | 2.817590% |
| B | 6140 | 366 | 5.960912% |
| C | 6139 | 1312 | 21.371559% |
| D | 6140 | 893 | 14.543974% |
Noise dominated data is calculated using 1-second bins in cleaned event files. If a bin has >2000 counts, and if more than 50% of those come from <1% of pixels, then it is considered to be noise-dominated and hence unusable.
| Quadrant | # 1 sec bins | Bins with >0 counts | Bins with >2000 counts | High rate bins dominated by noise | Noise dominated (total time) | Noise dominated (detector-on time) | Marked lightcurve |
|---|---|---|---|---|---|---|---|
| A | 7234 | 6139 | 100 | 100 | 1.38% | 1.63% | 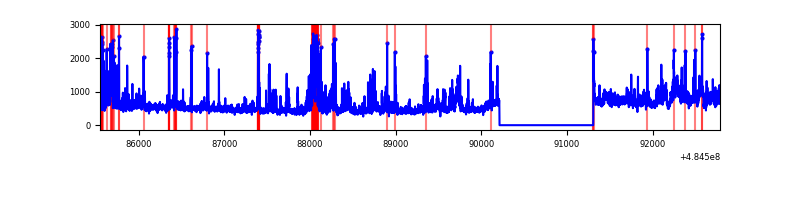 |
| B | 7234 | 6139 | 174 | 174 | 2.41% | 2.83% | 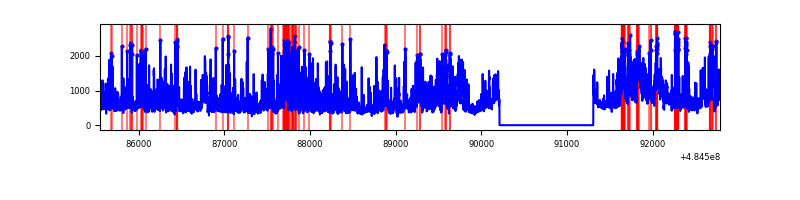 |
| C | 7233 | 6138 | 1244 | 1244 | 17.20% | 20.27% | 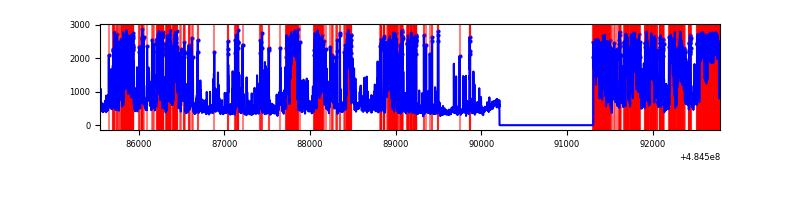 |
| D | 7234 | 6139 | 903 | 903 | 12.48% | 14.71% | 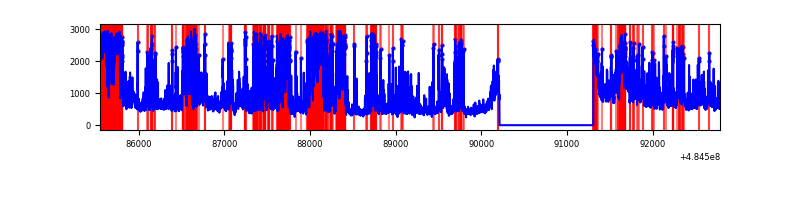 |
Top three noisy pixels from each quadrant. If the there are fewer than three noisy pixels in the level2.evt file, extra rows are filled as -1
| Pixel properties | Quadrant properties | ||||||
|---|---|---|---|---|---|---|---|
| Quadrant | DetID | PixID | Counts | Sigma | Mean | Median | Sigma |
| A | 4 | 95 | 360898 | 2269.6 | 643 | 628 | 158.7 |
| A | 4 | 3 | 302100 | 1899.19 | 643 | 628 | 158.7 |
| A | 3 | 14 | 255340 | 1604.62 | 643 | 628 | 158.7 |
| B | 7 | 0 | 946848 | 7104.6 | 637 | 617 | 133.2 |
| B | 5 | 185 | 232325 | 1739.74 | 637 | 617 | 133.2 |
| B | 12 | 32 | 216919 | 1624.06 | 637 | 617 | 133.2 |
| C | 15 | 224 | 3215338 | 19911.64 | 579 | 571 | 161.5 |
| C | 4 | 5 | 847138 | 5243.47 | 579 | 571 | 161.5 |
| C | 13 | 3 | 259916 | 1606.33 | 579 | 571 | 161.5 |
| D | 12 | 17 | 1959501 | 11579.82 | 599 | 572 | 169.2 |
| D | 8 | 176 | 740274 | 4372.6 | 599 | 572 | 169.2 |
| D | 13 | 170 | 464334 | 2741.44 | 599 | 572 | 169.2 |
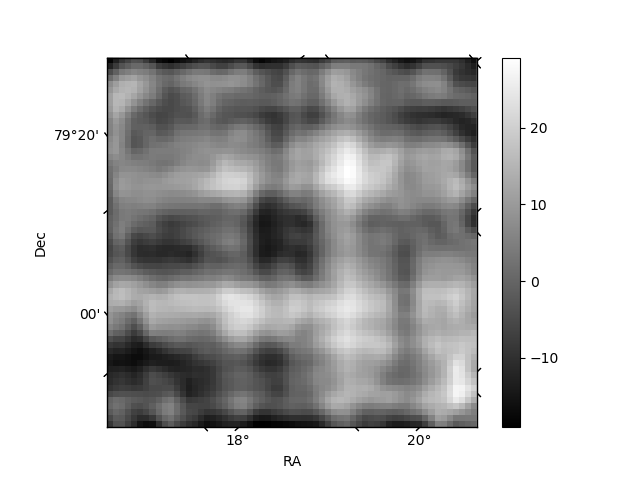
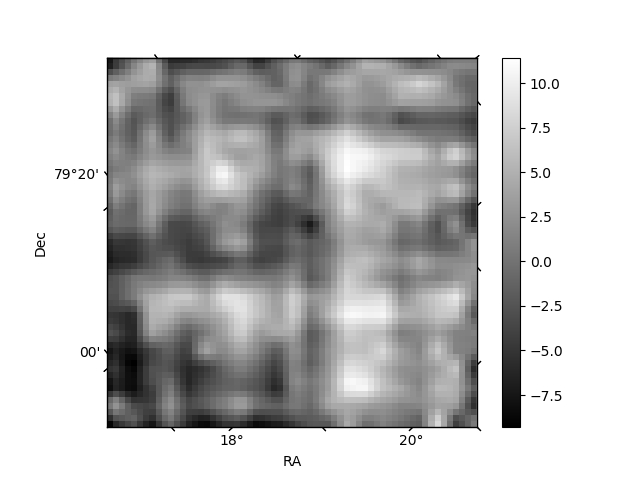
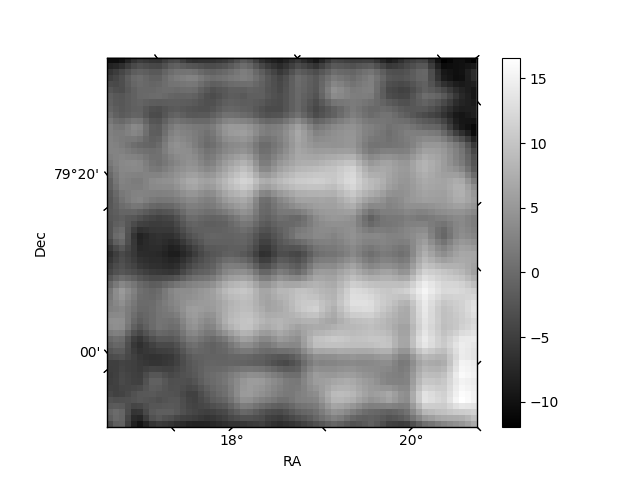
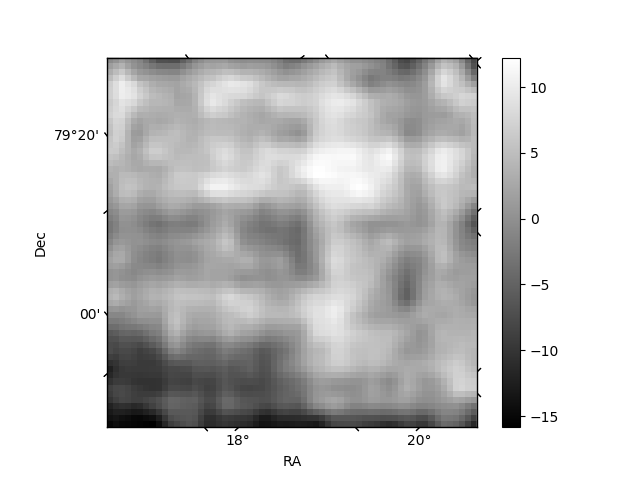
Histogram calculated using DETX and DETY for each event in the final _common_clean file
| Quadrant A | 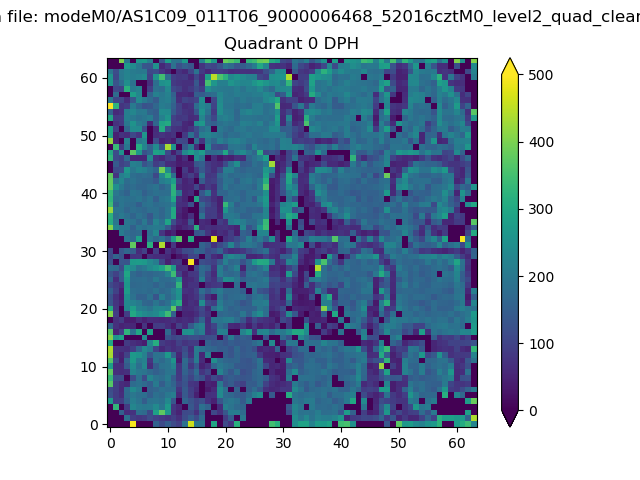 |
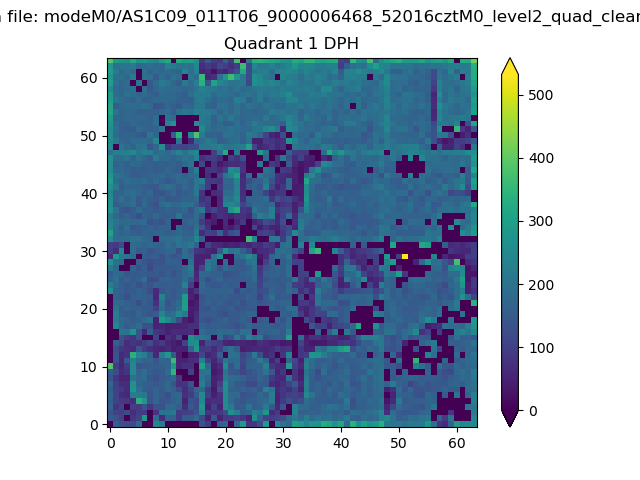 |
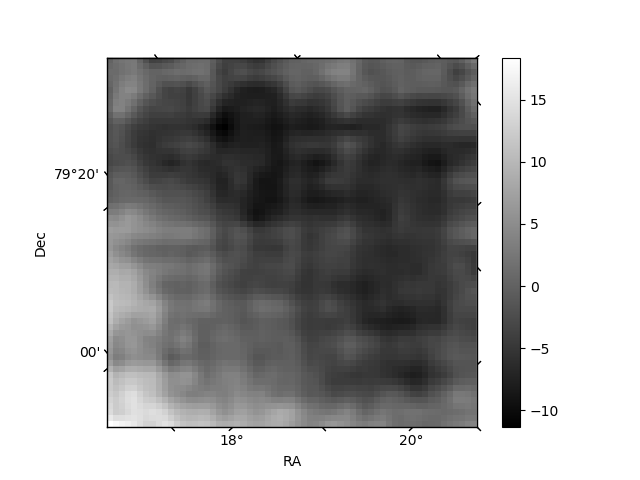
Quadrant B |
|---|---|---|---|
| Quadrant D | 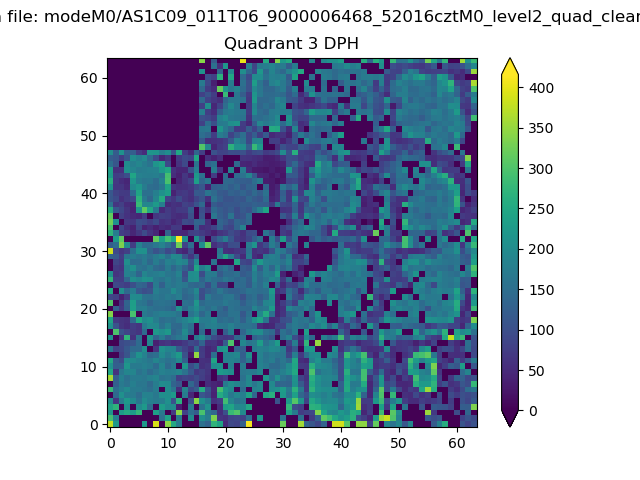 |
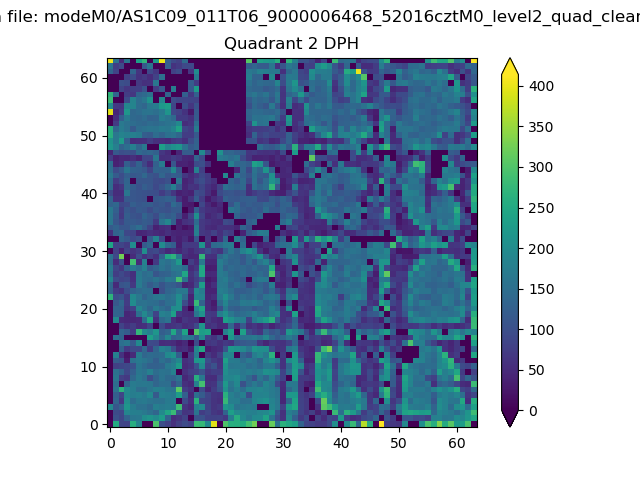 |
Quadrant C |
| Plot type | Count rate plots | Images |
|---|---|---|
| Comparison with Poisson distribution Blue bars denote a histogram of data divided into 1 sec bins. Red curve is a Poisson curve with rate = median count rate of data. |
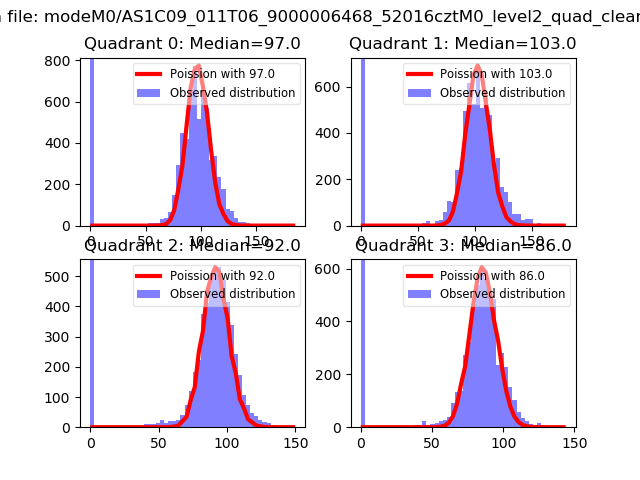 |
 |
| Quadrant-wise count rates Data is divided into 100 sec bins |
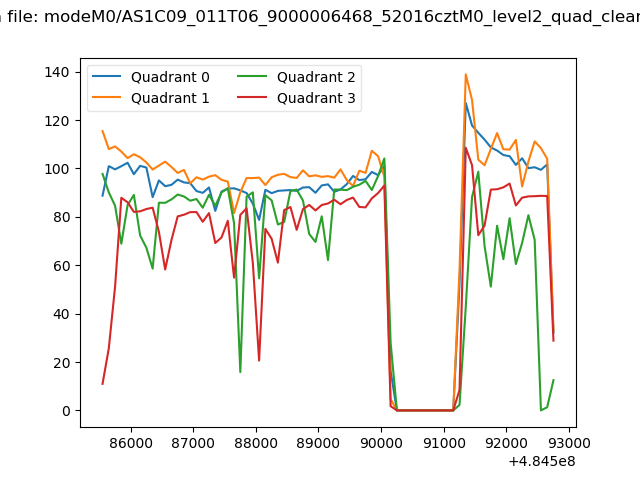 |
|
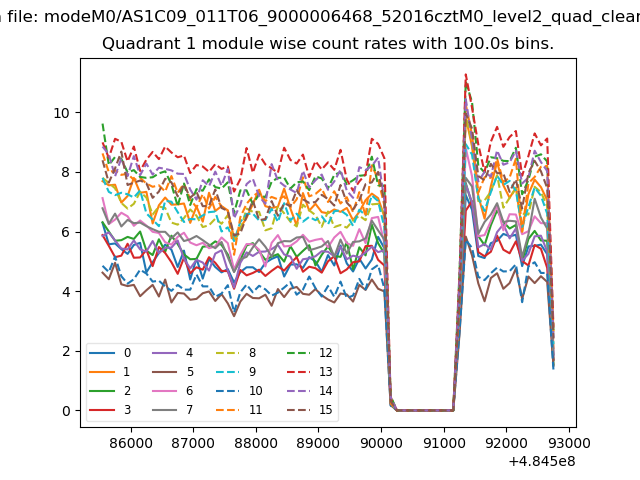
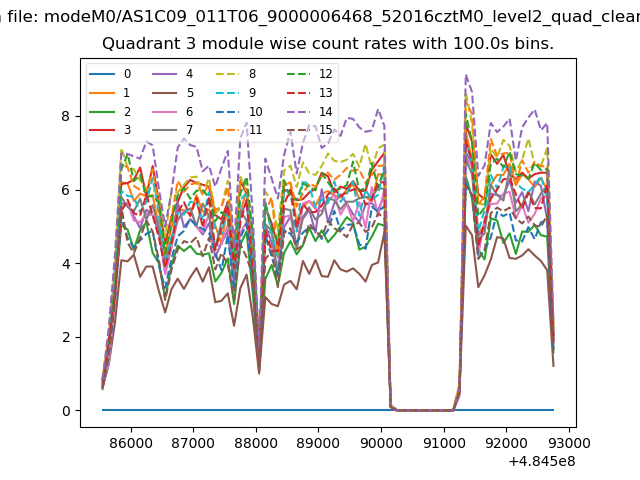
| Module-wise count rates for Quadrant A Data is divided into 100 sec bins |
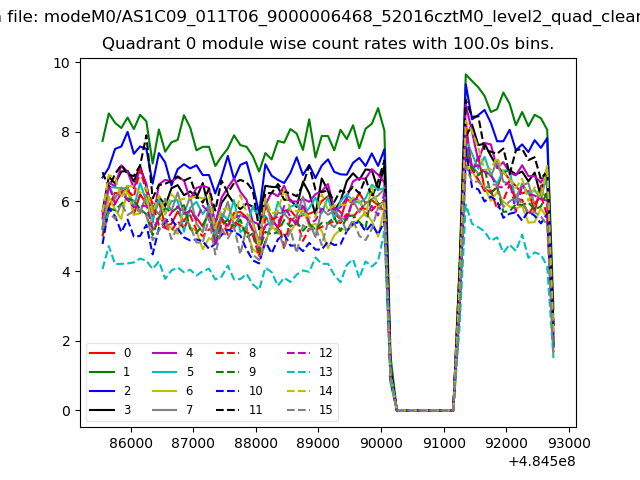 |
 |
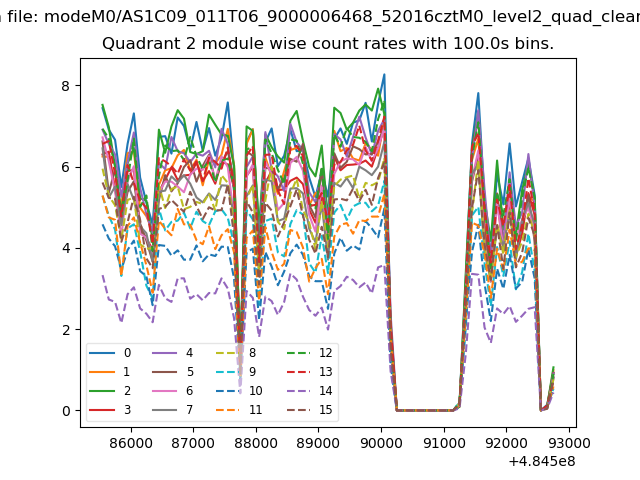
| Module-wise count rates for Quadrant B Data is divided into 100 sec bins |
 |
 |
| Module-wise count rates for Quadrant C Data is divided into 100 sec bins |
 |
 |
| Module-wise count rates for Quadrant D Data is divided into 100 sec bins |
 |
 |
| Parameter | Plot |
|---|---|
| CZT HV Monitor | 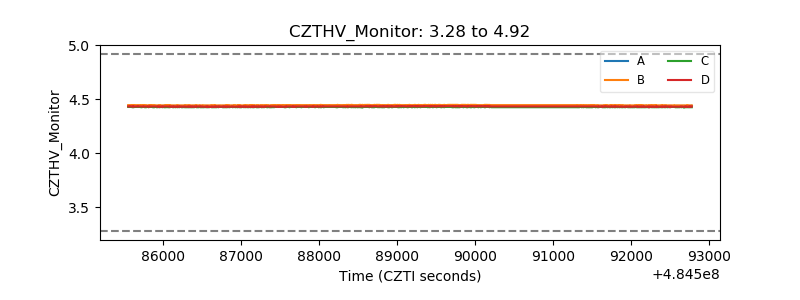 |
| D_VDD | 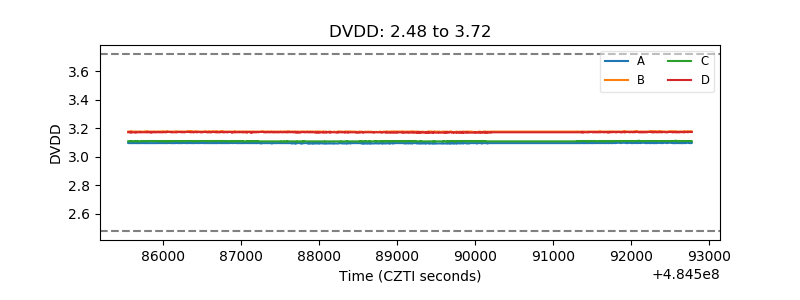 |
| Temperature 1 | 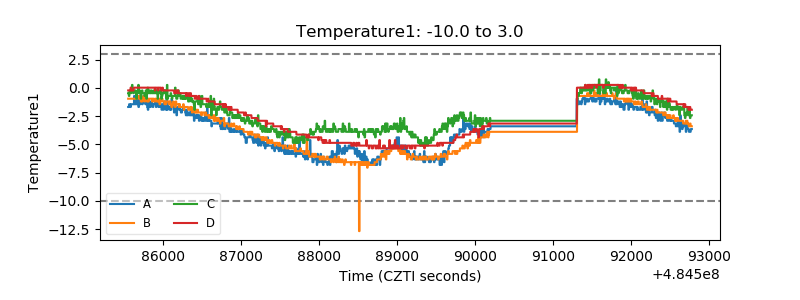 |
| Veto HV Monitor | 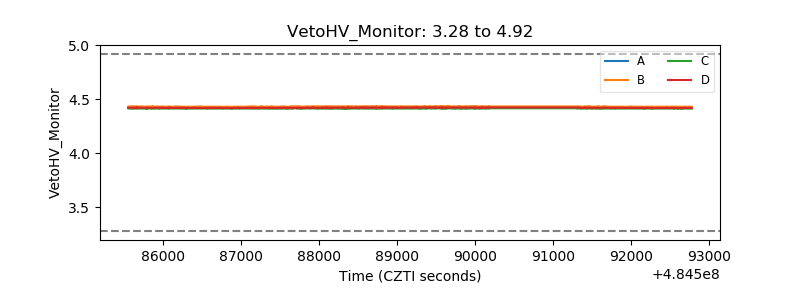 |
| Veto LLD | 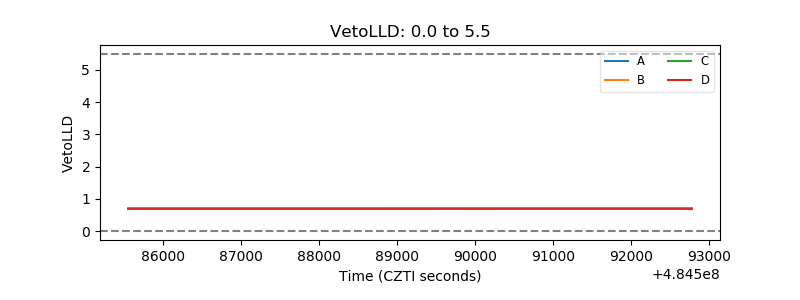 |
| Alpha Counter | 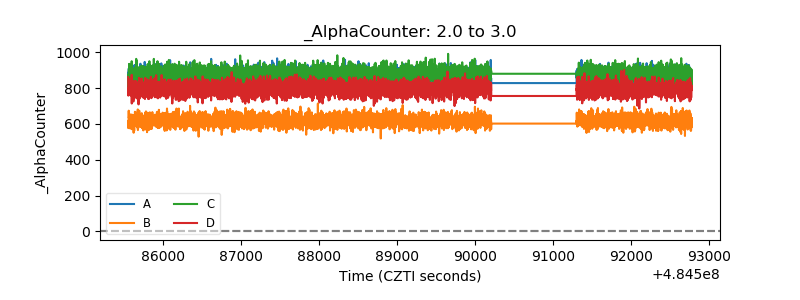 |
| _CPM_Rate | 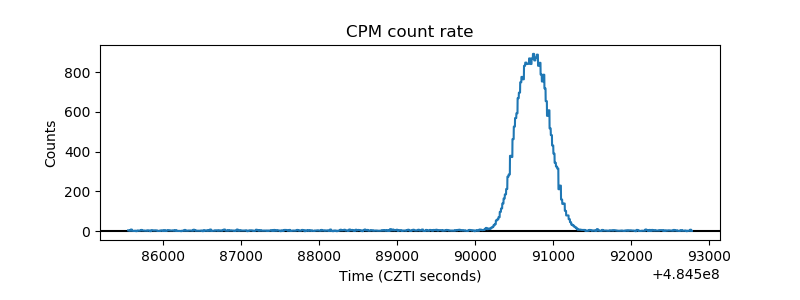 |
| CZT Counter | 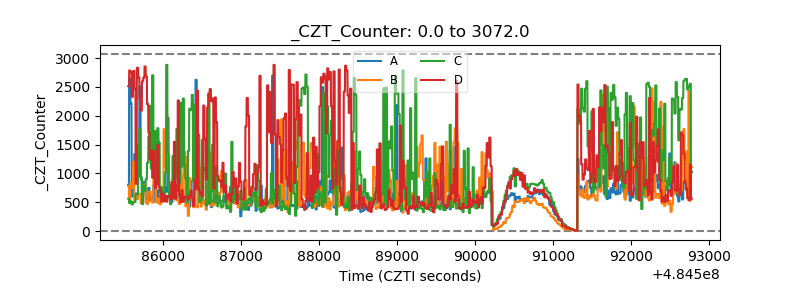 |
| +2.5 Volts monitor | 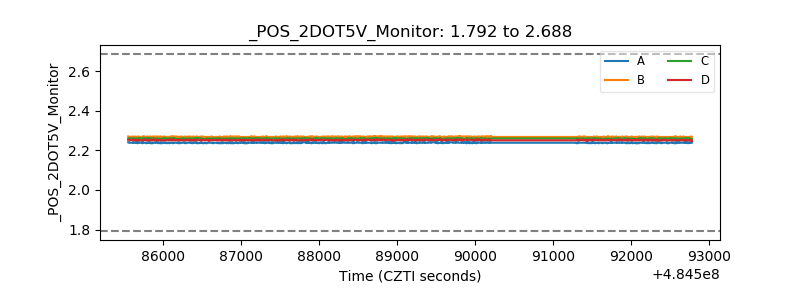 |
| +5 Volts monitor | 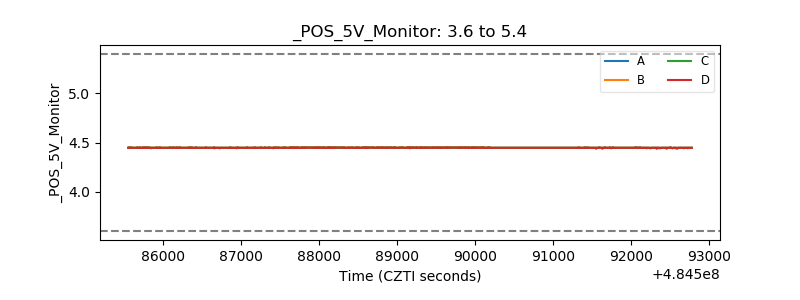 |
| _ROLL_ROT | 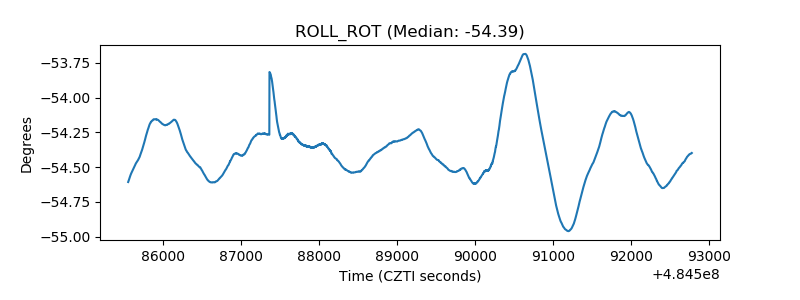 |
| _Roll_DEC | 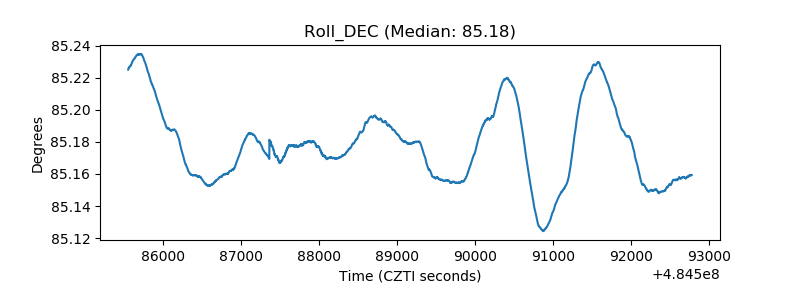 |
| _Roll_RA | 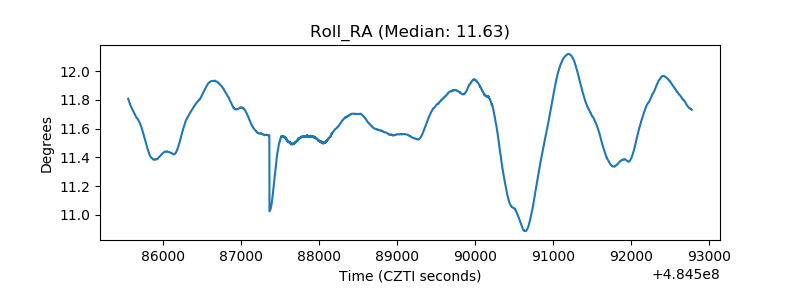 |
| Veto Counter | 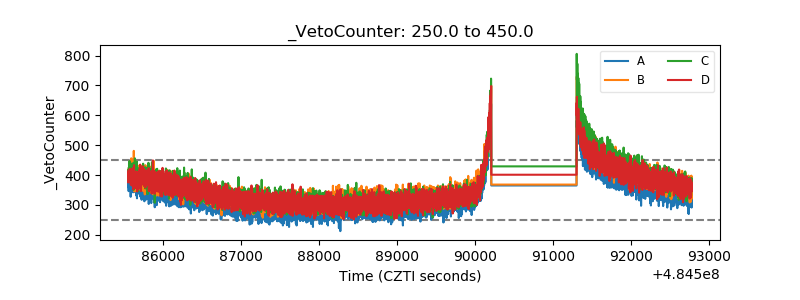 |