| Param | Original file | Final file |
|---|---|---|
| Filename | modeM0/AS1C09_011T06_9000006468_52017cztM0_level2.fits | modeM0/AS1C09_011T06_9000006468_52017cztM0_level2_quad_clean.evt |
| Size (bytes) | 737,853,120 | 85,737,600 |
| Size | 703.7 MB | 81.8 MB |
| Events in quadrant A | 4,594,984 | 612,568 |
| Events in quadrant B | 6,192,867 | 608,299 |
| Events in quadrant C | 9,020,371 | 440,847 |
| Events in quadrant D | 7,020,097 | 495,406 |
| Mode M0 | |||
|---|---|---|---|
| Quadrant | BADHDUFLAG | Total packets | Discarded packets |
| A | 0 | 18011 | 1 |
| B | 0 | 22809 | 1 |
| C | 0 | 31188 | 1 |
| D | 0 | 25291 | 5 |
| Mode M9 | |||
|---|---|---|---|
| Quadrant | BADHDUFLAG | Total packets | Discarded packets |
| A | 0 | 11 | 0 |
| B | 0 | 11 | 0 |
| C | 0 | 11 | 0 |
| D | 0 | 11 | 0 |
| Mode SS | |||
|---|---|---|---|
| Quadrant | BADHDUFLAG | Total packets | Discarded packets |
| A | 0 | 130 | 0 |
| B | 0 | 130 | 0 |
| C | 0 | 130 | 0 |
| D | 0 | 130 | 0 |
| Quadrant | Total seconds | Saturated seconds | Saturation percentage |
|---|---|---|---|
| A | 6274 | 177 | 2.821167% |
| B | 6274 | 749 | 11.938157% |
| C | 6274 | 2051 | 32.690469% |
| D | 6273 | 989 | 15.765981% |
Noise dominated data is calculated using 1-second bins in cleaned event files. If a bin has >2000 counts, and if more than 50% of those come from <1% of pixels, then it is considered to be noise-dominated and hence unusable.
| Quadrant | # 1 sec bins | Bins with >0 counts | Bins with >2000 counts | High rate bins dominated by noise | Noise dominated (total time) | Noise dominated (detector-on time) | Marked lightcurve |
|---|---|---|---|---|---|---|---|
| A | 7449 | 6275 | 114 | 114 | 1.53% | 1.82% | 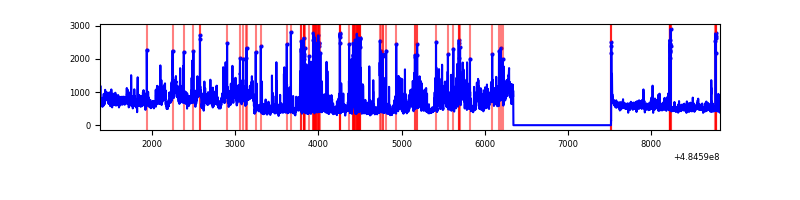 |
| B | 7449 | 6275 | 300 | 300 | 4.03% | 4.78% | 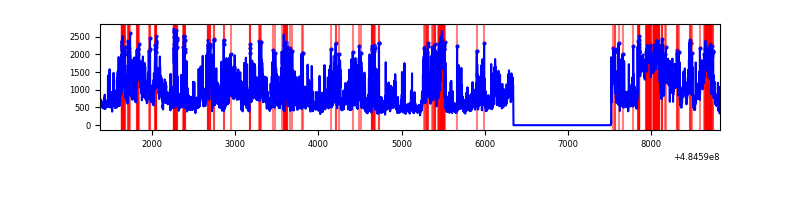 |
| C | 7449 | 6275 | 1986 | 1986 | 26.66% | 31.65% | 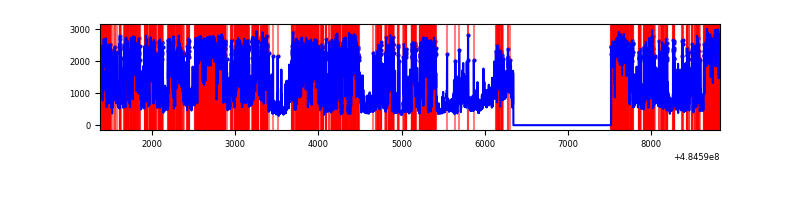 |
| D | 7448 | 6274 | 995 | 995 | 13.36% | 15.86% | 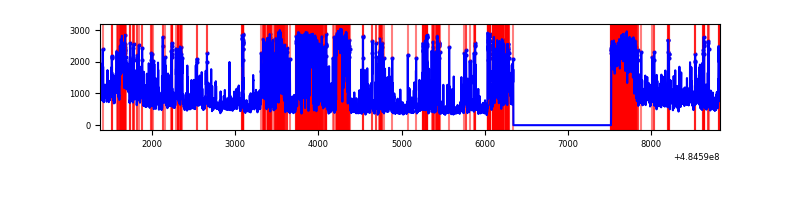 |
Top three noisy pixels from each quadrant. If the there are fewer than three noisy pixels in the level2.evt file, extra rows are filled as -1
| Pixel properties | Quadrant properties | ||||||
|---|---|---|---|---|---|---|---|
| Quadrant | DetID | PixID | Counts | Sigma | Mean | Median | Sigma |
| A | 3 | 95 | 479617 | 2849.29 | 670 | 655 | 168.1 |
| A | 4 | 95 | 399720 | 2373.99 | 670 | 655 | 168.1 |
| A | 3 | 14 | 395436 | 2348.5 | 670 | 655 | 168.1 |
| B | 7 | 0 | 975632 | 7219.1 | 643 | 622 | 135.1 |
| B | 12 | 18 | 789079 | 5837.84 | 643 | 622 | 135.1 |
| B | 5 | 185 | 512141 | 3787.35 | 643 | 622 | 135.1 |
| C | 15 | 224 | 5615671 | 35416.9 | 574 | 567 | 158.5 |
| C | 4 | 5 | 419182 | 2640.38 | 574 | 567 | 158.5 |
| C | 0 | 225 | 337590 | 2125.75 | 574 | 567 | 158.5 |
| D | 12 | 17 | 1783519 | 10095.07 | 617 | 589 | 176.6 |
| D | 8 | 176 | 1178035 | 6666.78 | 617 | 589 | 176.6 |
| D | 13 | 170 | 450925 | 2549.83 | 617 | 589 | 176.6 |
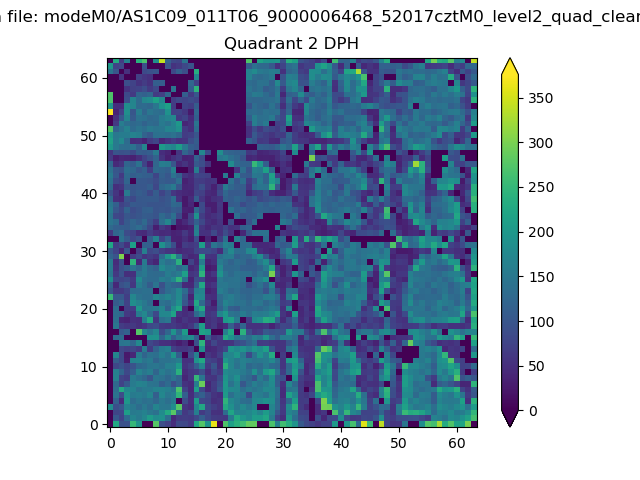
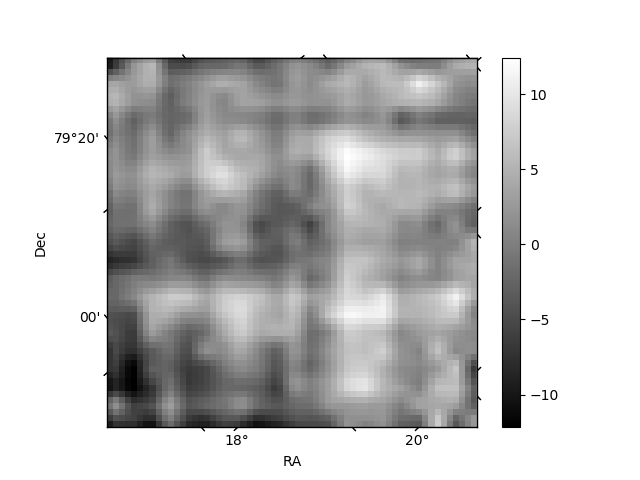
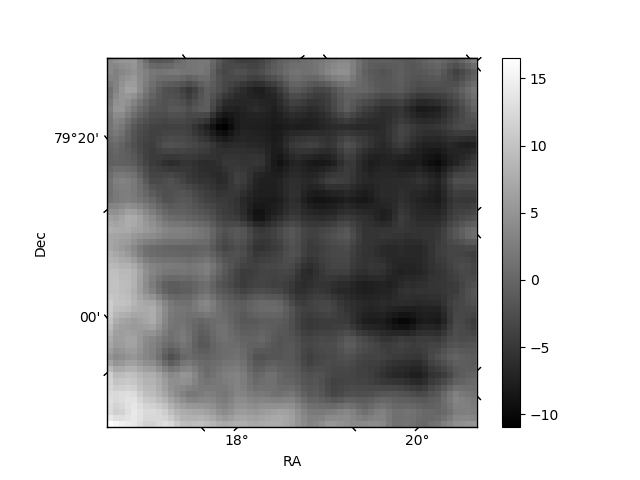
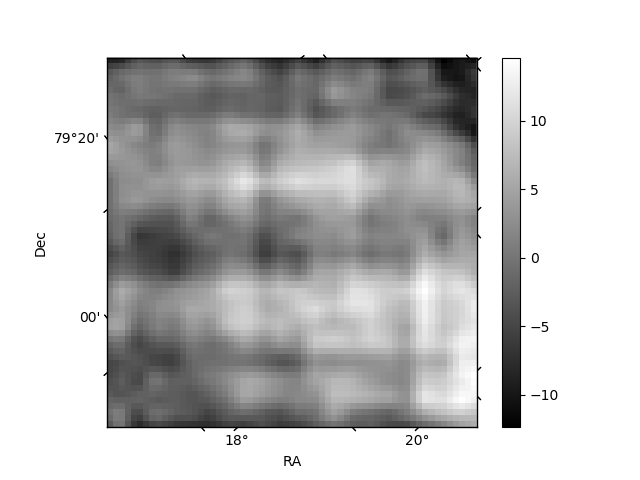
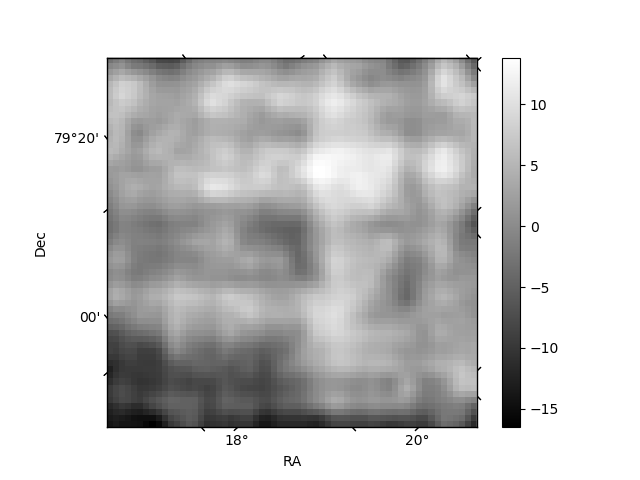
Histogram calculated using DETX and DETY for each event in the final _common_clean file
| Quadrant A | 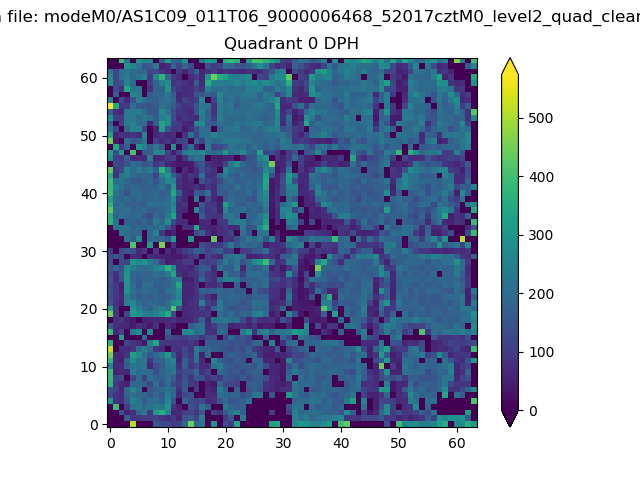 |
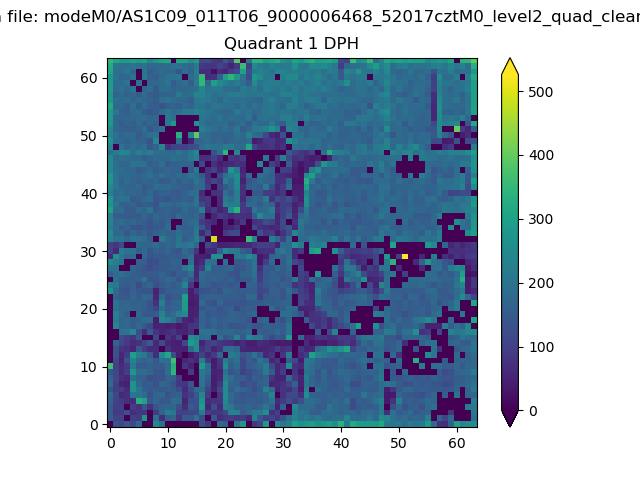 |
Quadrant B |
|---|---|---|---|
| Quadrant D | 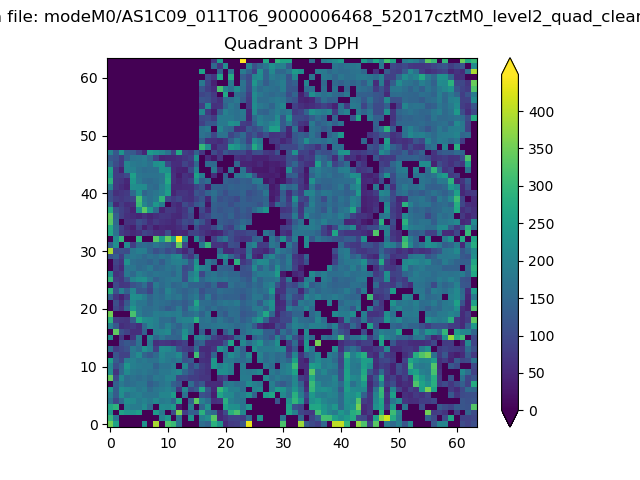 |
 |
Quadrant C |
| Plot type | Count rate plots | Images |
|---|---|---|
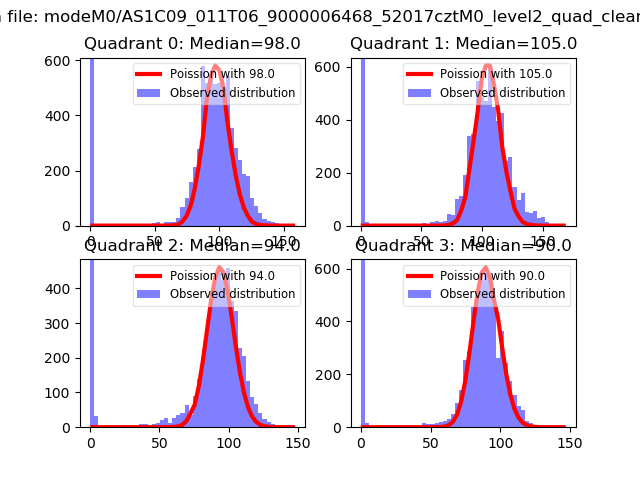
| Comparison with Poisson distribution Blue bars denote a histogram of data divided into 1 sec bins. Red curve is a Poisson curve with rate = median count rate of data. |
 |
 |
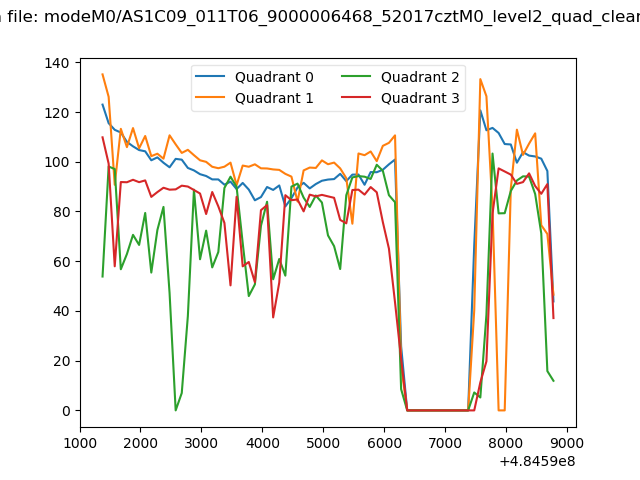
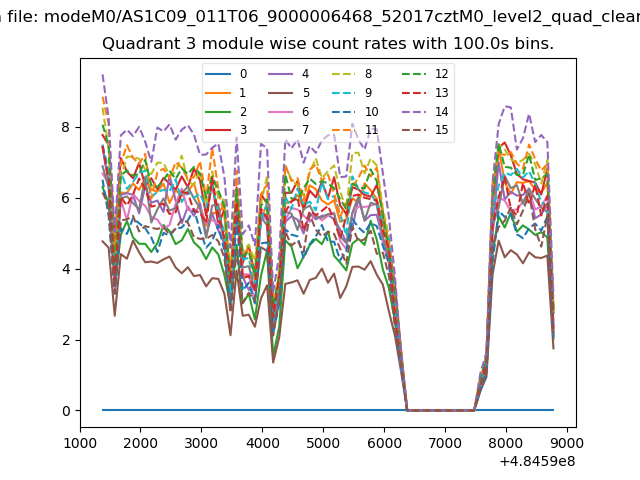
| Quadrant-wise count rates Data is divided into 100 sec bins |
 |
|
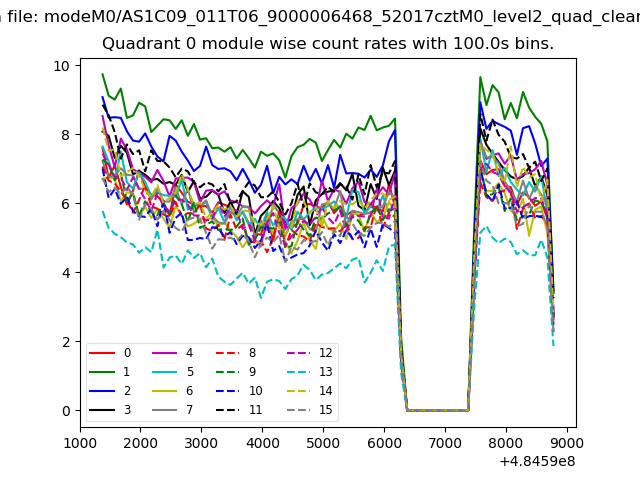
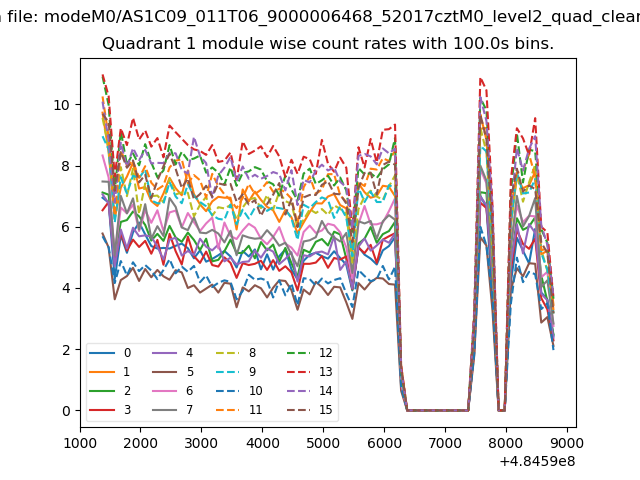
| Module-wise count rates for Quadrant A Data is divided into 100 sec bins |
 |
 |
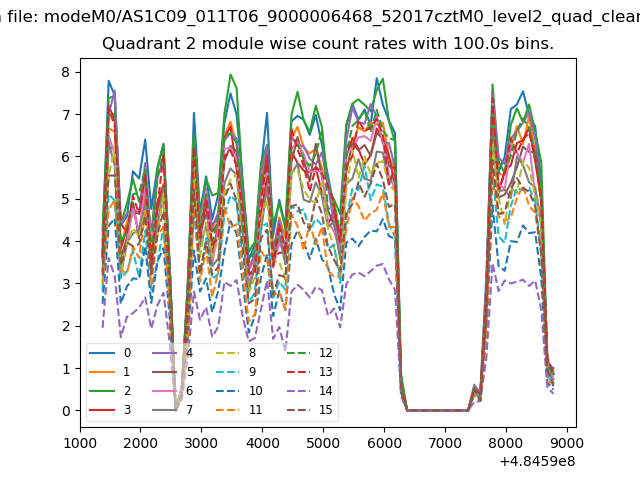
| Module-wise count rates for Quadrant B Data is divided into 100 sec bins |
 |
 |
| Module-wise count rates for Quadrant C Data is divided into 100 sec bins |
 |
 |
| Module-wise count rates for Quadrant D Data is divided into 100 sec bins |
 |
 |
| Parameter | Plot |
|---|---|
| CZT HV Monitor | 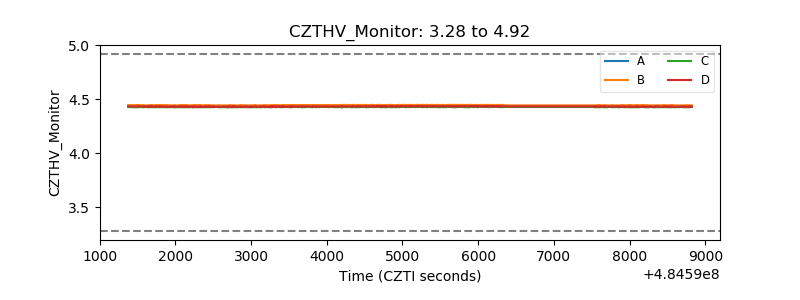 |
| D_VDD | 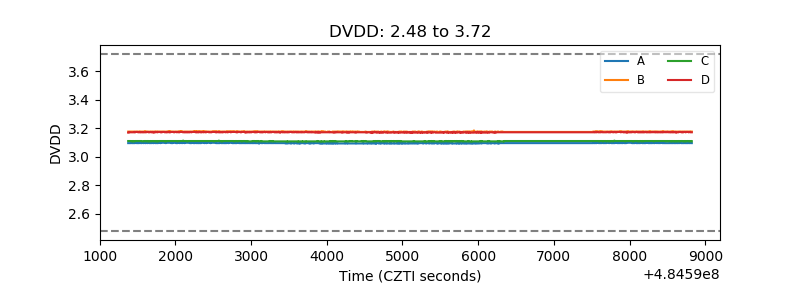 |
| Temperature 1 | 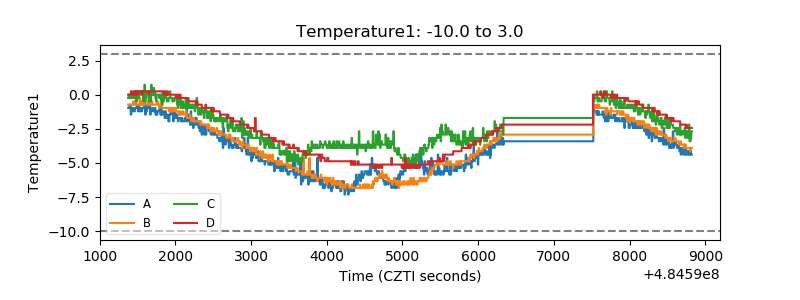 |
| Veto HV Monitor | 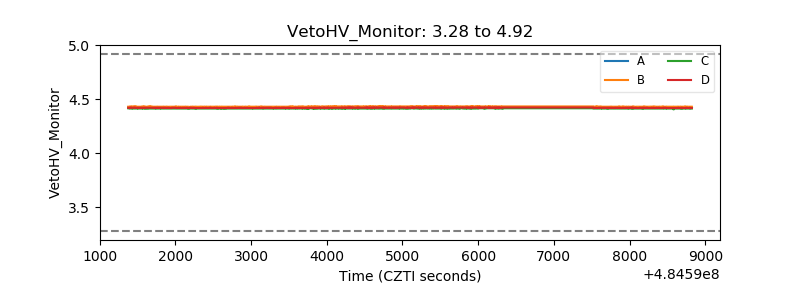 |
| Veto LLD | 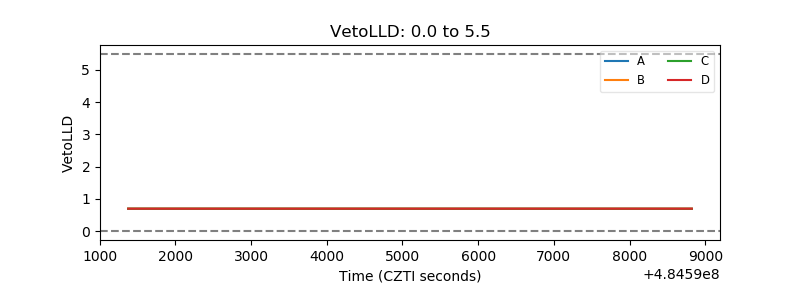 |
| Alpha Counter | 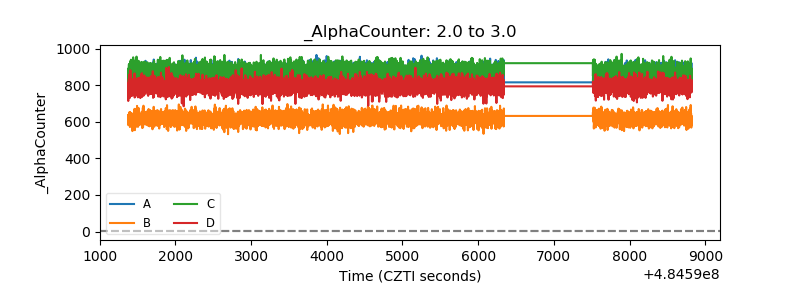 |
| _CPM_Rate | 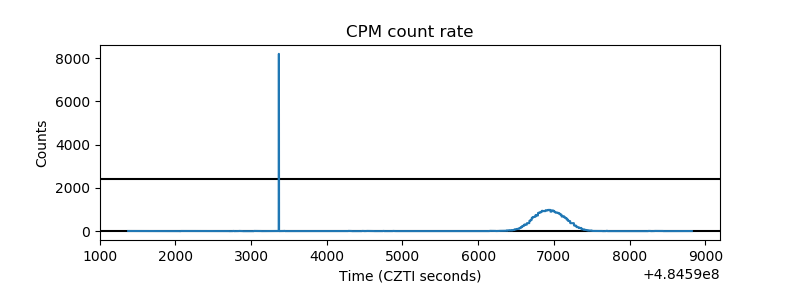 |
| CZT Counter |  |
| +2.5 Volts monitor | 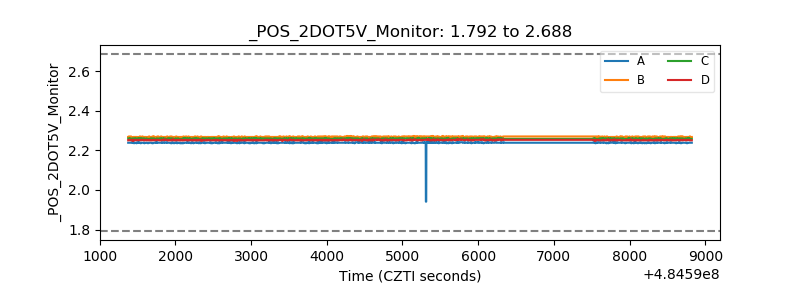 |
| +5 Volts monitor | 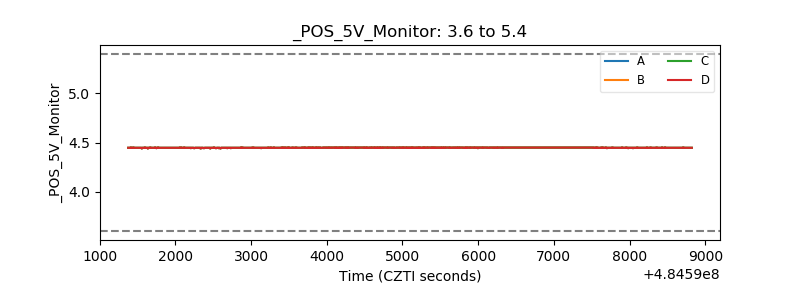 |
| _ROLL_ROT | 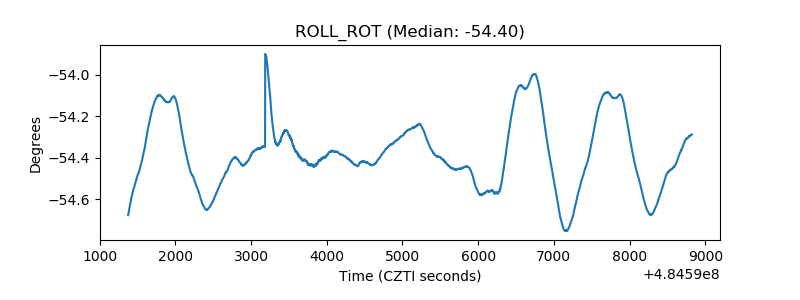 |
| _Roll_DEC | 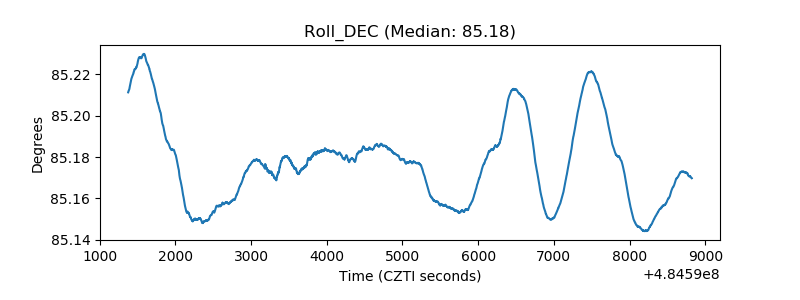 |
| _Roll_RA | 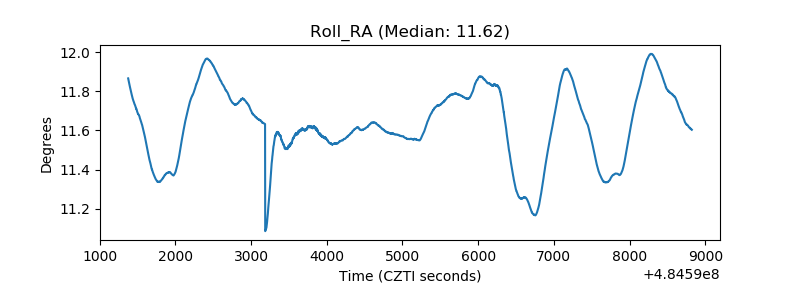 |
| Veto Counter | 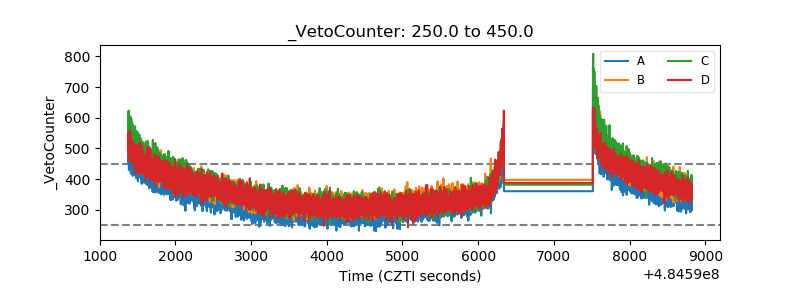 |