| Param | Original file | Final file |
|---|---|---|
| Filename | modeM0/AS1C09_011T06_9000006468_52018cztM0_level2.fits | modeM0/AS1C09_011T06_9000006468_52018cztM0_level2_quad_clean.evt |
| Size (bytes) | 860,558,400 | 79,464,960 |
| Size | 820.7 MB | 75.8 MB |
| Events in quadrant A | 6,107,590 | 543,605 |
| Events in quadrant B | 5,717,221 | 601,117 |
| Events in quadrant C | 9,627,193 | 419,556 |
| Events in quadrant D | 9,922,553 | 406,634 |
| Mode M0 | |||
|---|---|---|---|
| Quadrant | BADHDUFLAG | Total packets | Discarded packets |
| A | 0 | 22399 | 1 |
| B | 0 | 21370 | 1 |
| C | 0 | 32938 | 1 |
| D | 0 | 33868 | 8 |
| Mode M9 | |||
|---|---|---|---|
| Quadrant | BADHDUFLAG | Total packets | Discarded packets |
| A | 0 | 12 | 0 |
| B | 0 | 12 | 0 |
| C | 0 | 12 | 0 |
| D | 0 | 12 | 0 |
| Mode SS | |||
|---|---|---|---|
| Quadrant | BADHDUFLAG | Total packets | Discarded packets |
| A | 0 | 126 | 0 |
| B | 0 | 126 | 0 |
| C | 0 | 126 | 0 |
| D | 0 | 126 | 0 |
| Quadrant | Total seconds | Saturated seconds | Saturation percentage |
|---|---|---|---|
| A | 6230 | 925 | 14.847512% |
| B | 6231 | 754 | 12.100786% |
| C | 6231 | 2224 | 35.692505% |
| D | 6230 | 2000 | 32.102729% |
Noise dominated data is calculated using 1-second bins in cleaned event files. If a bin has >2000 counts, and if more than 50% of those come from <1% of pixels, then it is considered to be noise-dominated and hence unusable.
| Quadrant | # 1 sec bins | Bins with >0 counts | Bins with >2000 counts | High rate bins dominated by noise | Noise dominated (total time) | Noise dominated (detector-on time) | Marked lightcurve |
|---|---|---|---|---|---|---|---|
| A | 7425 | 6231 | 625 | 625 | 8.42% | 10.03% | 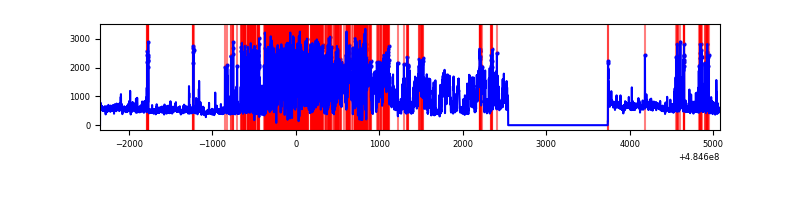 |
| B | 7426 | 6232 | 375 | 375 | 5.05% | 6.02% | 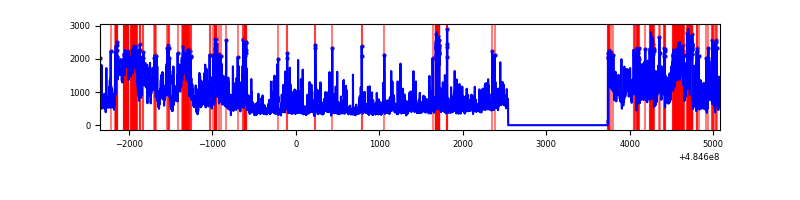 |
| C | 7426 | 6232 | 2223 | 2223 | 29.94% | 35.67% | 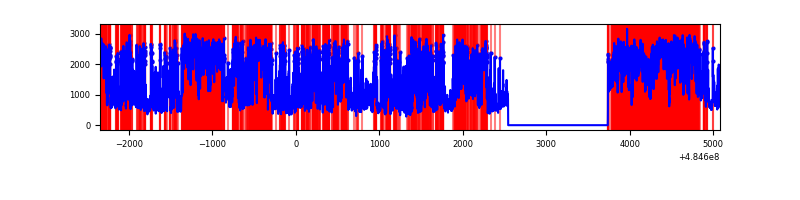 |
| D | 7425 | 6231 | 2221 | 2221 | 29.91% | 35.64% | 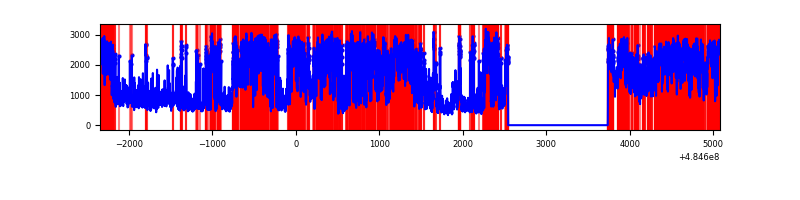 |
Top three noisy pixels from each quadrant. If the there are fewer than three noisy pixels in the level2.evt file, extra rows are filled as -1
| Pixel properties | Quadrant properties | ||||||
|---|---|---|---|---|---|---|---|
| Quadrant | DetID | PixID | Counts | Sigma | Mean | Median | Sigma |
| A | 2 | 48 | 1824836 | 11885.89 | 611 | 597 | 153.5 |
| A | 4 | 95 | 1294408 | 8429.87 | 611 | 597 | 153.5 |
| A | 4 | 3 | 222208 | 1443.91 | 611 | 597 | 153.5 |
| B | 5 | 185 | 1038648 | 7796.64 | 632 | 611 | 133.1 |
| B | 12 | 18 | 836411 | 6277.65 | 632 | 611 | 133.1 |
| B | 7 | 0 | 361237 | 2708.64 | 632 | 611 | 133.1 |
| C | 15 | 224 | 4717045 | 29654.55 | 571 | 566 | 159.0 |
| C | 4 | 5 | 1150668 | 7231.19 | 571 | 566 | 159.0 |
| C | 9 | 38 | 631387 | 3966.25 | 571 | 566 | 159.0 |
| D | 6 | 42 | 2097164 | 13047.81 | 560 | 534 | 160.7 |
| D | 12 | 17 | 1822215 | 11336.74 | 560 | 534 | 160.7 |
| D | 15 | 94 | 1311292 | 8157.15 | 560 | 534 | 160.7 |
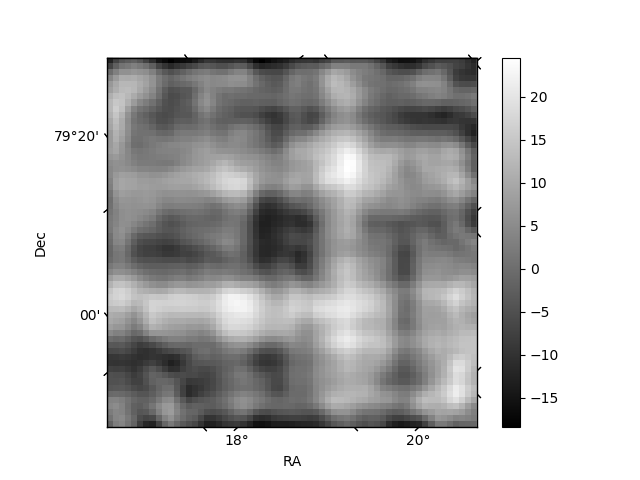
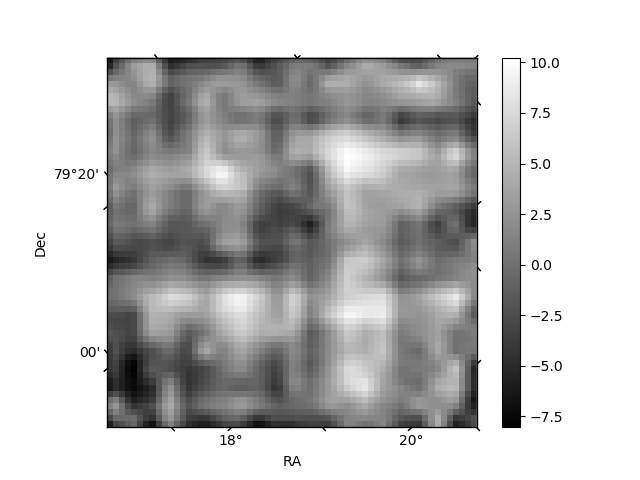
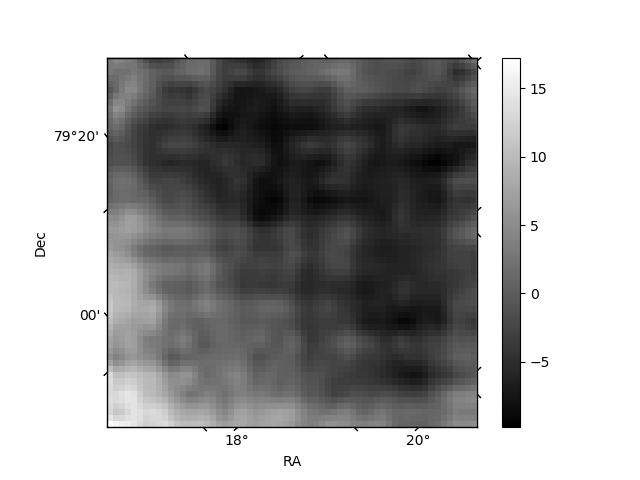
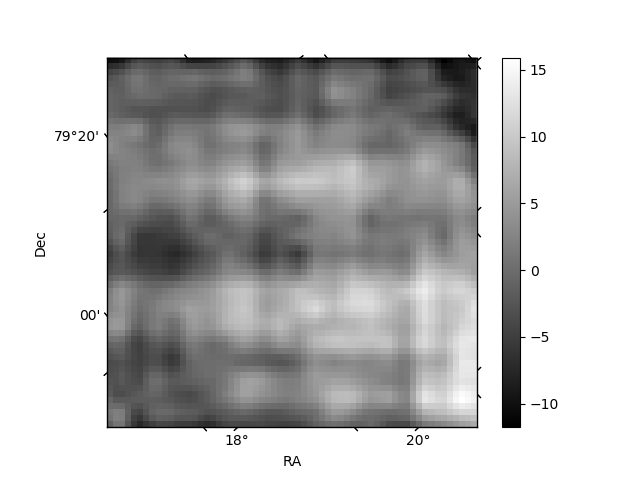
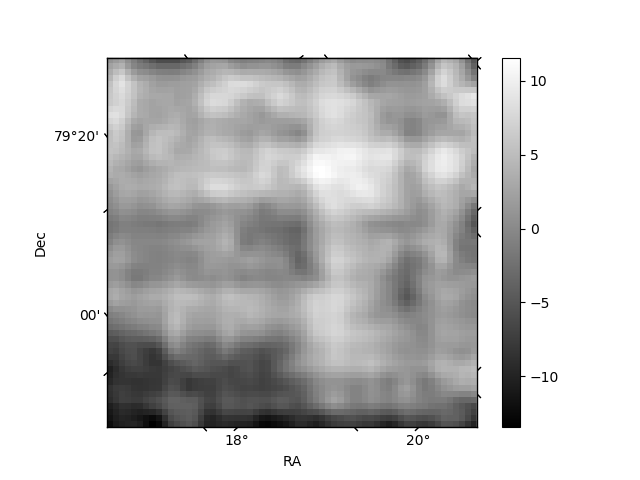
Histogram calculated using DETX and DETY for each event in the final _common_clean file
| Quadrant A | 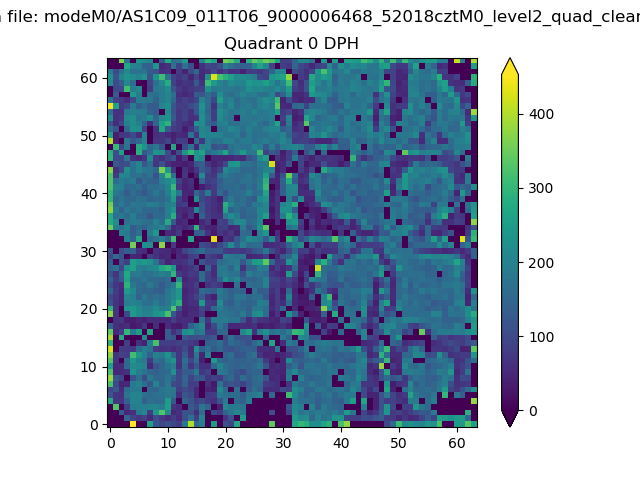 |
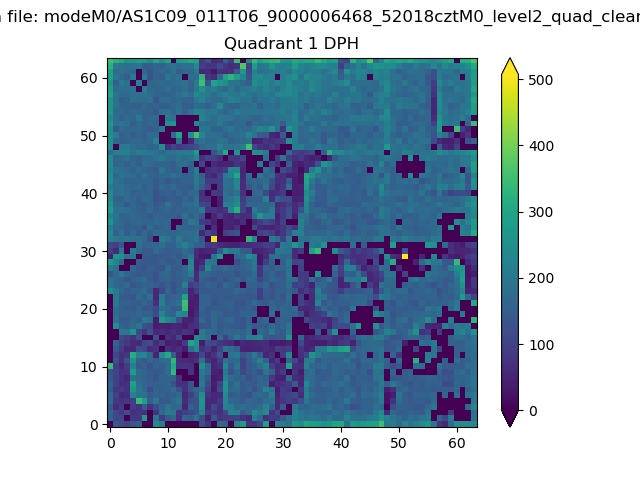 |
Quadrant B |
|---|---|---|---|
| Quadrant D | 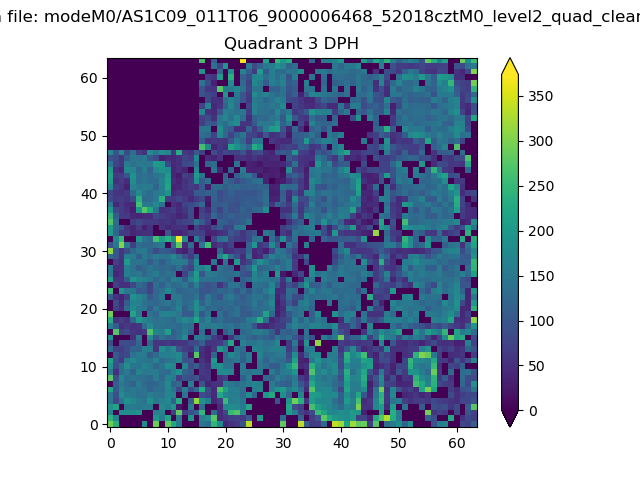 |
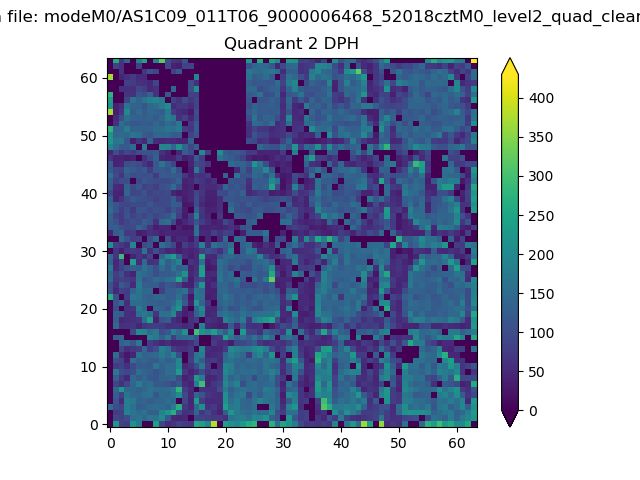 |
Quadrant C |
| Plot type | Count rate plots | Images |
|---|---|---|
| Comparison with Poisson distribution Blue bars denote a histogram of data divided into 1 sec bins. Red curve is a Poisson curve with rate = median count rate of data. |
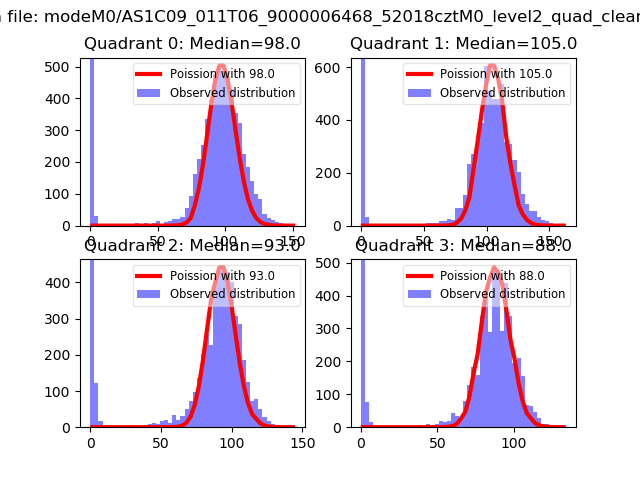 |
 |
| Quadrant-wise count rates Data is divided into 100 sec bins |
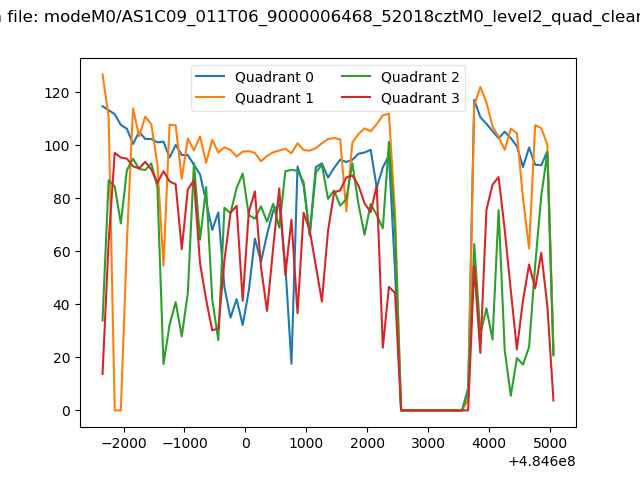 |
|
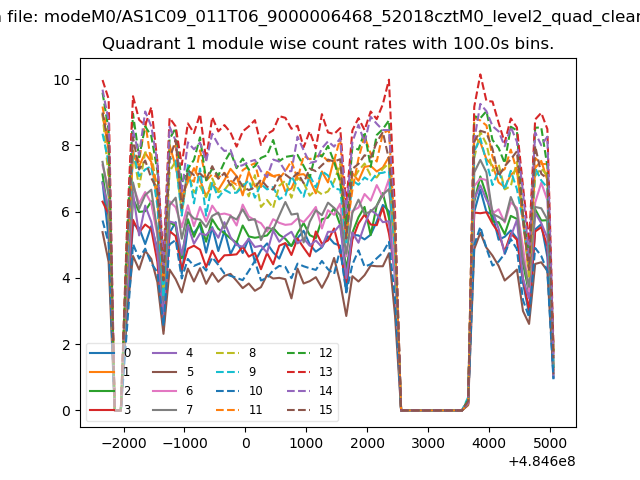
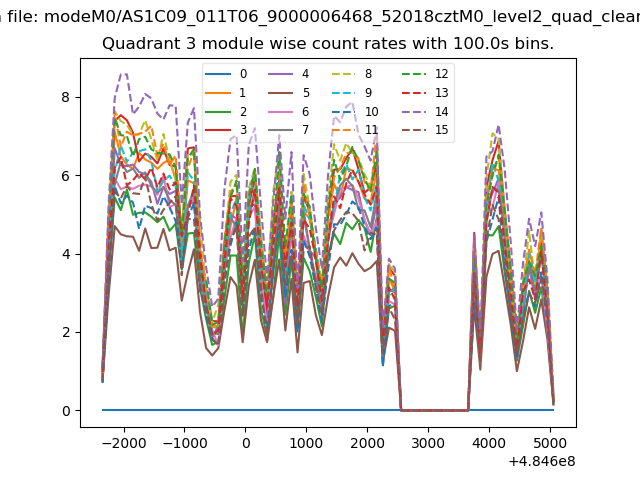
| Module-wise count rates for Quadrant A Data is divided into 100 sec bins |
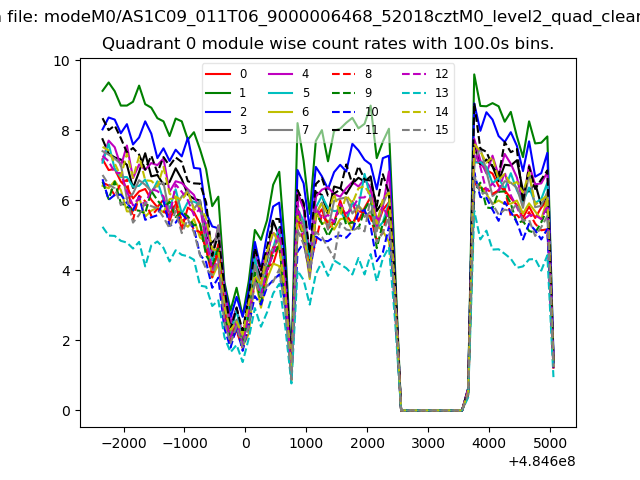 |
 |
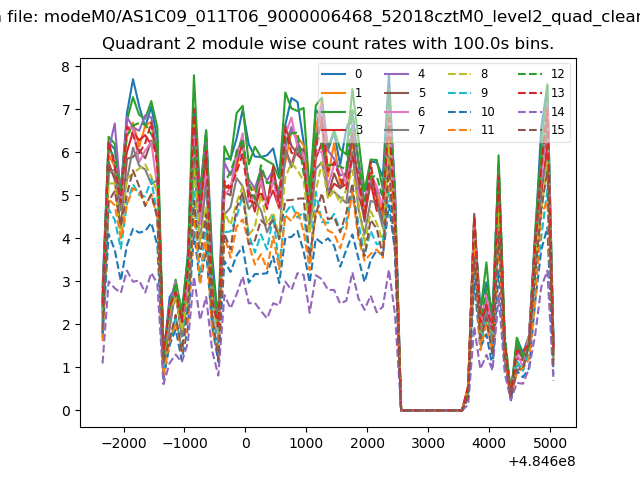
| Module-wise count rates for Quadrant B Data is divided into 100 sec bins |
 |
 |
| Module-wise count rates for Quadrant C Data is divided into 100 sec bins |
 |
 |
| Module-wise count rates for Quadrant D Data is divided into 100 sec bins |
 |
 |
| Parameter | Plot |
|---|---|
| CZT HV Monitor | 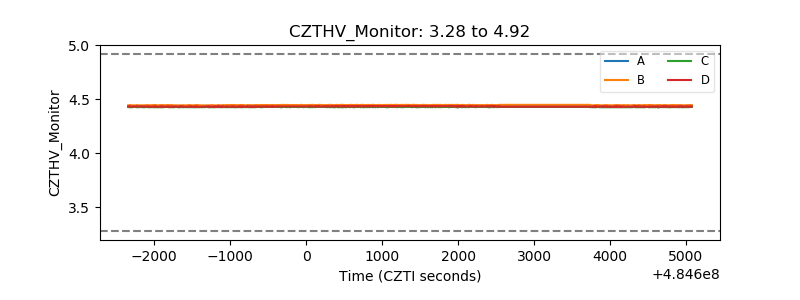 |
| D_VDD | 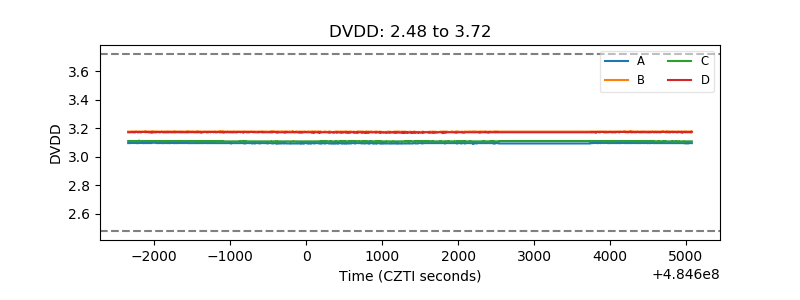 |
| Temperature 1 | 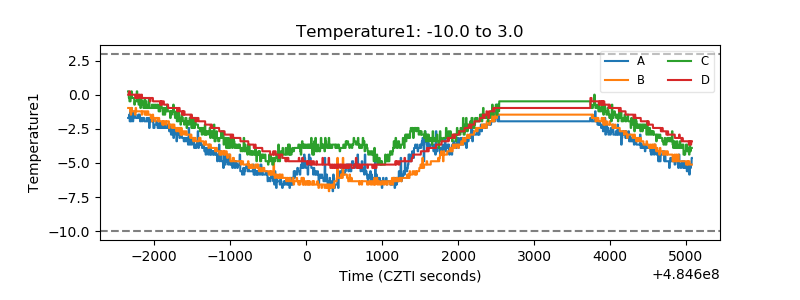 |
| Veto HV Monitor | 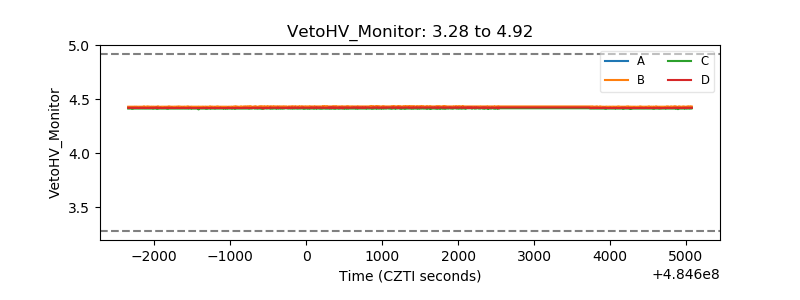 |
| Veto LLD | 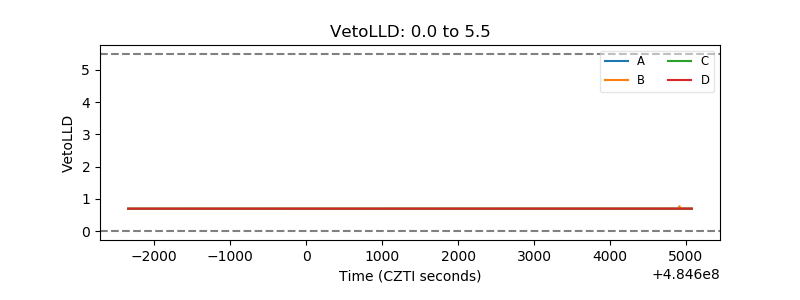 |
| Alpha Counter | 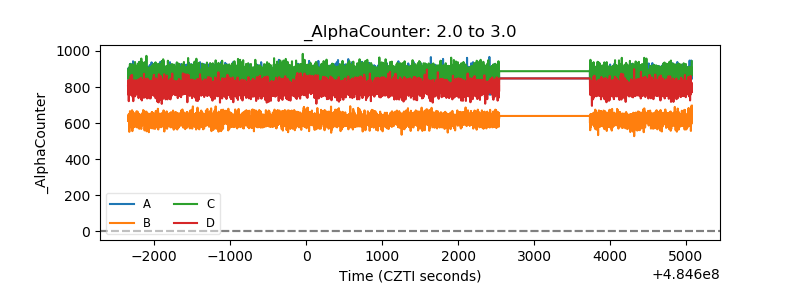 |
| _CPM_Rate | 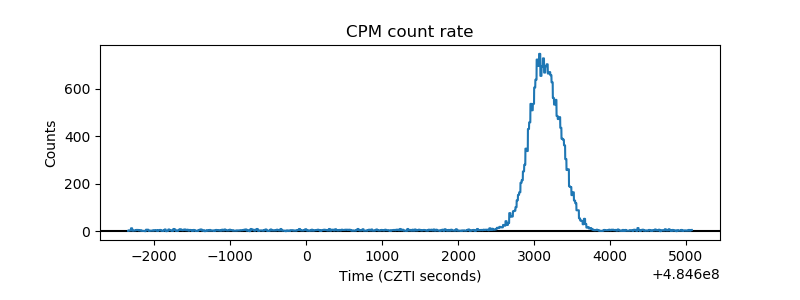 |
| CZT Counter | 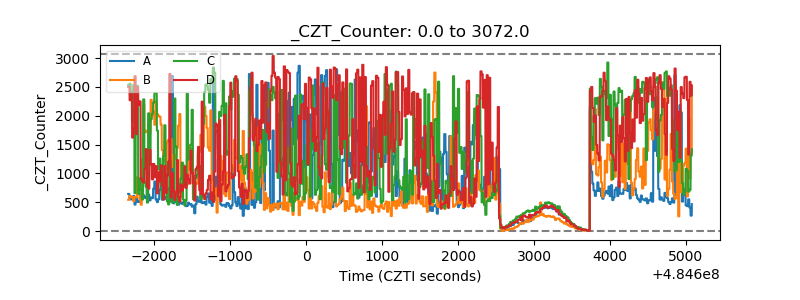 |
| +2.5 Volts monitor | 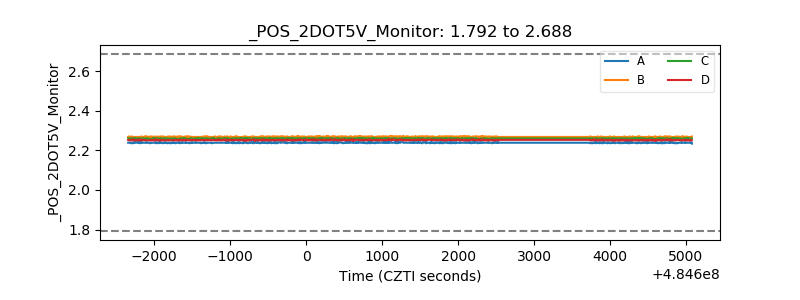 |
| +5 Volts monitor | 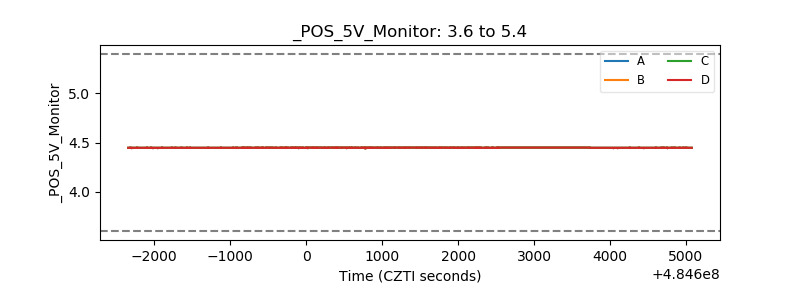 |
| _ROLL_ROT | 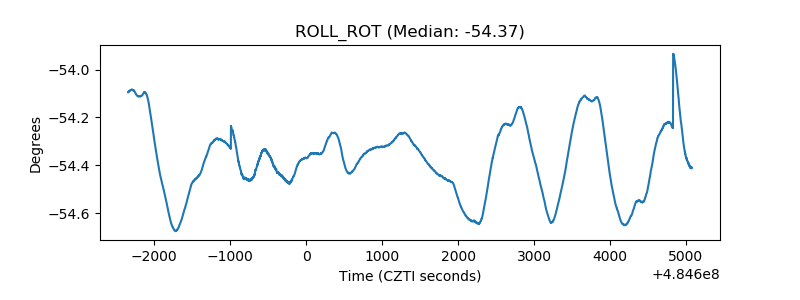 |
| _Roll_DEC | 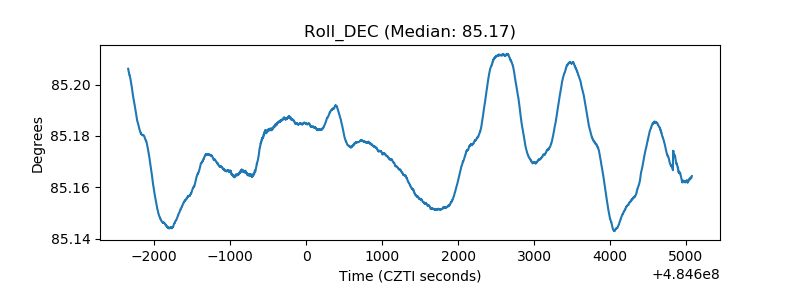 |
| _Roll_RA | 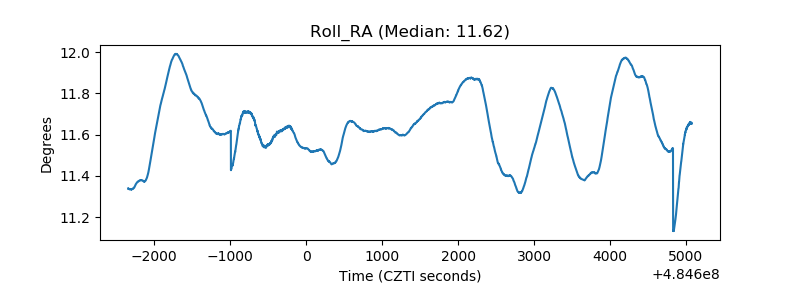 |
| Veto Counter | 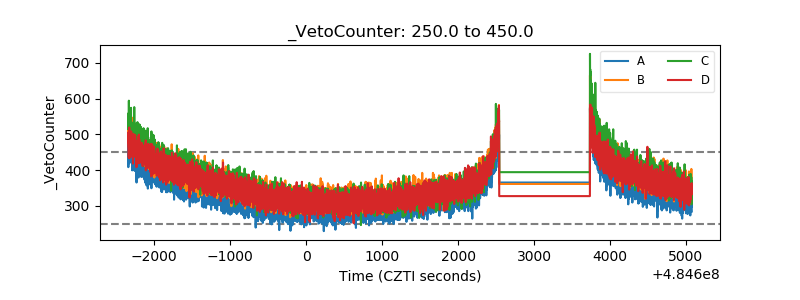 |