| Param | Original file | Final file |
|---|---|---|
| Filename | modeM0/AS1C09_011T06_9000006468_52036cztM0_level2.fits | modeM0/AS1C09_011T06_9000006468_52036cztM0_level2_quad_clean.evt |
| Size (bytes) | 949,527,360 | 97,488,000 |
| Size | 905.5 MB | 93.0 MB |
| Events in quadrant A | 5,120,284 | 703,858 |
| Events in quadrant B | 7,386,336 | 702,833 |
| Events in quadrant C | 8,893,247 | 587,498 |
| Events in quadrant D | 13,140,773 | 409,819 |
| Mode M0 | |||
|---|---|---|---|
| Quadrant | BADHDUFLAG | Total packets | Discarded packets |
| A | 0 | 20743 | 0 |
| B | 0 | 27507 | 0 |
| C | 0 | 31991 | 1 |
| D | 0 | 44604 | 0 |
| Mode SS | |||
|---|---|---|---|
| Quadrant | BADHDUFLAG | Total packets | Discarded packets |
| A | 0 | 158 | 0 |
| B | 0 | 158 | 0 |
| C | 0 | 158 | 0 |
| D | 0 | 158 | 0 |
| Quadrant | Total seconds | Saturated seconds | Saturation percentage |
|---|---|---|---|
| A | 7869 | 293 | 3.723472% |
| B | 7869 | 1028 | 13.063922% |
| C | 7868 | 1656 | 21.047280% |
| D | 7868 | 3156 | 40.111845% |
Noise dominated data is calculated using 1-second bins in cleaned event files. If a bin has >2000 counts, and if more than 50% of those come from <1% of pixels, then it is considered to be noise-dominated and hence unusable.
| Quadrant | # 1 sec bins | Bins with >0 counts | Bins with >2000 counts | High rate bins dominated by noise | Noise dominated (total time) | Noise dominated (detector-on time) | Marked lightcurve |
|---|---|---|---|---|---|---|---|
| A | 7870 | 7870 | 257 | 257 | 3.27% | 3.27% | 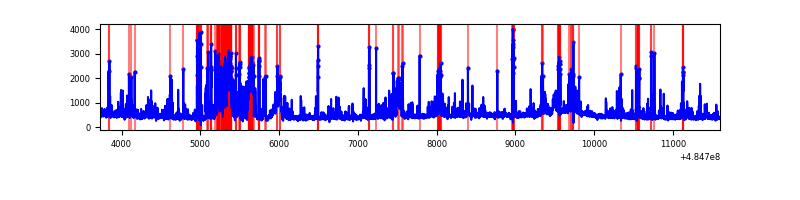 |
| B | 7870 | 7870 | 567 | 567 | 7.20% | 7.20% | 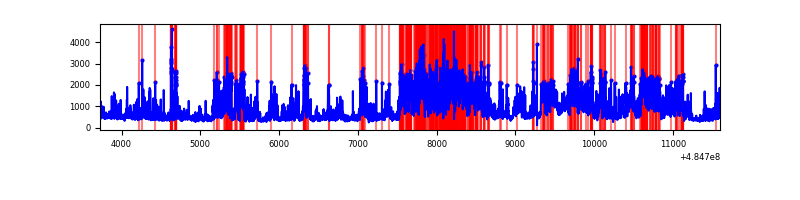 |
| C | 7869 | 7869 | 1333 | 1333 | 16.94% | 16.94% | 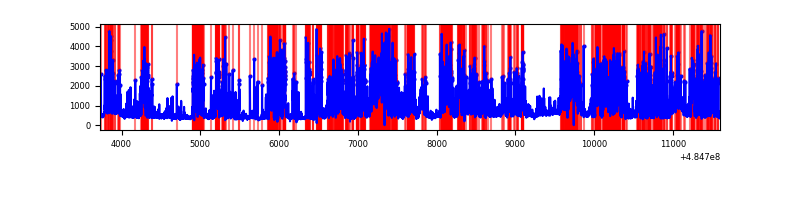 |
| D | 7869 | 7869 | 3026 | 3026 | 38.45% | 38.45% | 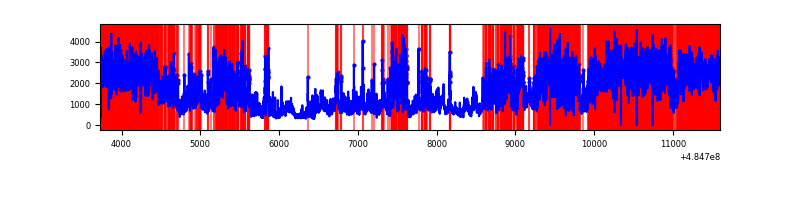 |
Top three noisy pixels from each quadrant. If the there are fewer than three noisy pixels in the level2.evt file, extra rows are filled as -1
| Pixel properties | Quadrant properties | ||||||
|---|---|---|---|---|---|---|---|
| Quadrant | DetID | PixID | Counts | Sigma | Mean | Median | Sigma |
| A | 8 | 43 | 563106 | 2844.4 | 794 | 773 | 197.7 |
| A | 4 | 95 | 279061 | 1407.64 | 794 | 773 | 197.7 |
| A | 3 | 114 | 244469 | 1232.67 | 794 | 773 | 197.7 |
| B | 7 | 0 | 2939659 | 17903.14 | 779 | 752 | 164.2 |
| B | 10 | 128 | 612128 | 3724.36 | 779 | 752 | 164.2 |
| B | 4 | 170 | 123986 | 750.71 | 779 | 752 | 164.2 |
| C | 15 | 224 | 3469760 | 17218.83 | 727 | 722 | 201.5 |
| C | 4 | 5 | 970094 | 4811.55 | 727 | 722 | 201.5 |
| C | 13 | 3 | 569974 | 2825.52 | 727 | 722 | 201.5 |
| D | 15 | 94 | 4861689 | 26607.45 | 631 | 601 | 182.7 |
| D | 6 | 42 | 3414437 | 18685.83 | 631 | 601 | 182.7 |
| D | 12 | 0 | 1125783 | 6158.75 | 631 | 601 | 182.7 |
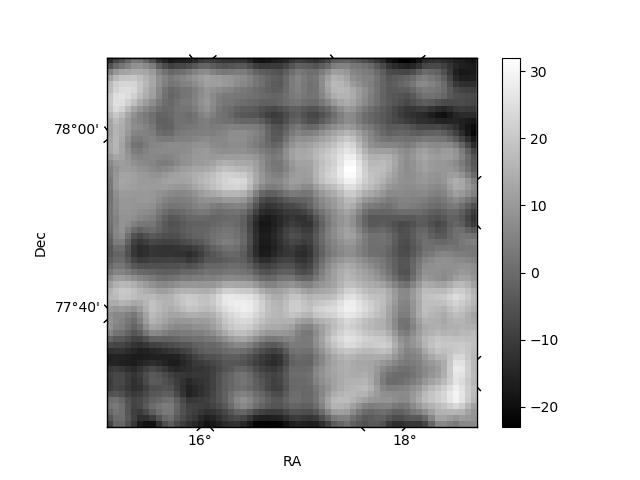
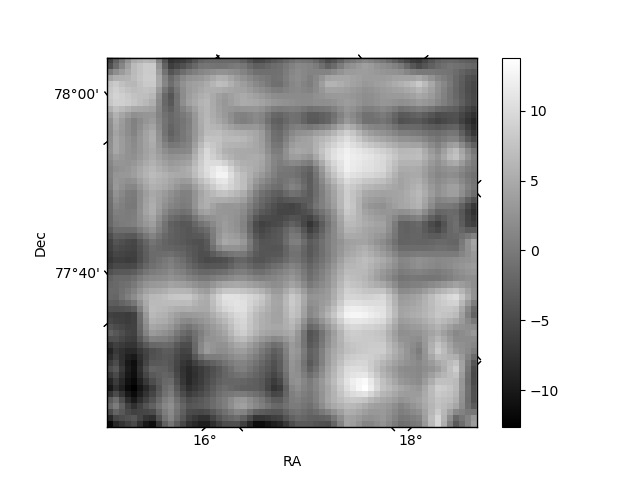
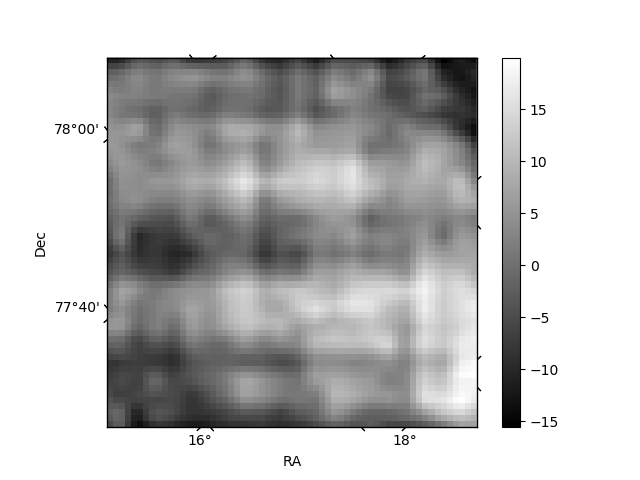
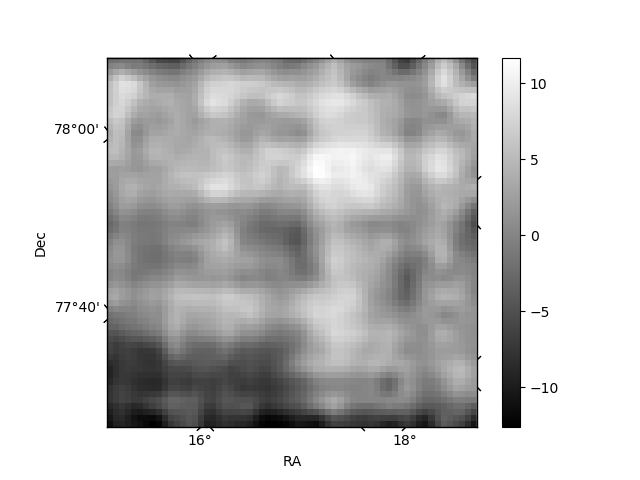
Histogram calculated using DETX and DETY for each event in the final _common_clean file
| Quadrant A | 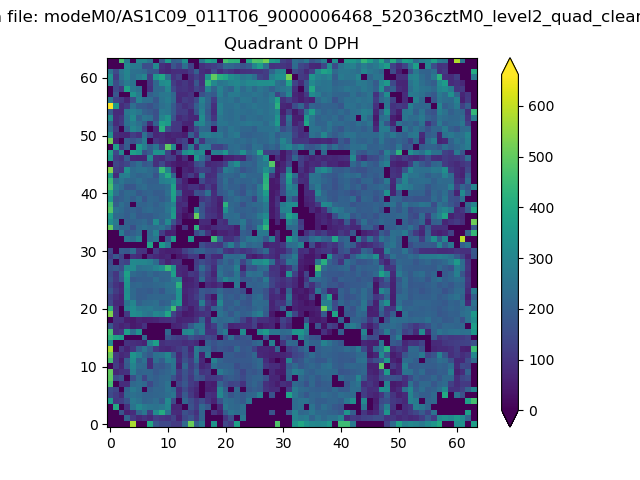 |
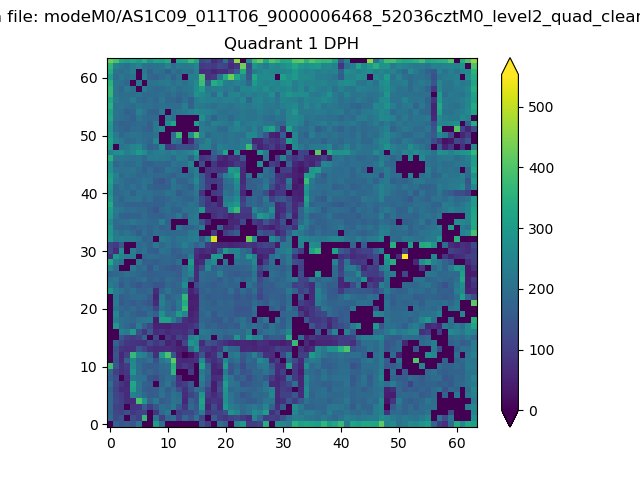 |
Quadrant B |
|---|---|---|---|
| Quadrant D | 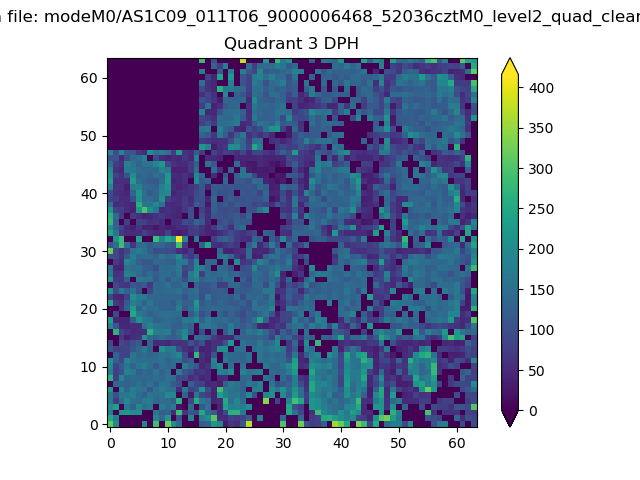 |
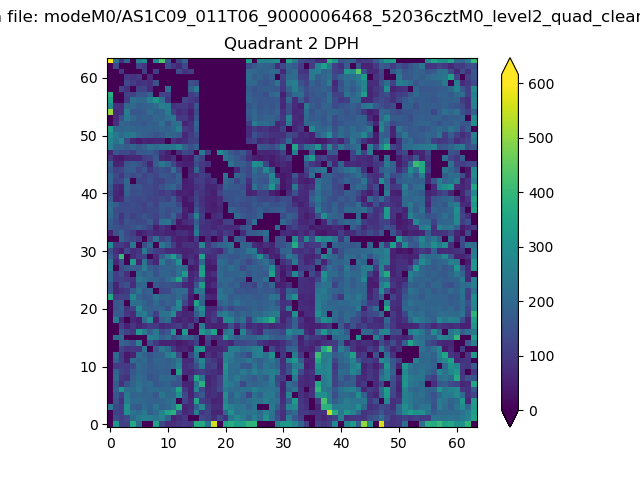 |
Quadrant C |
| Plot type | Count rate plots | Images |
|---|---|---|
| Comparison with Poisson distribution Blue bars denote a histogram of data divided into 1 sec bins. Red curve is a Poisson curve with rate = median count rate of data. |
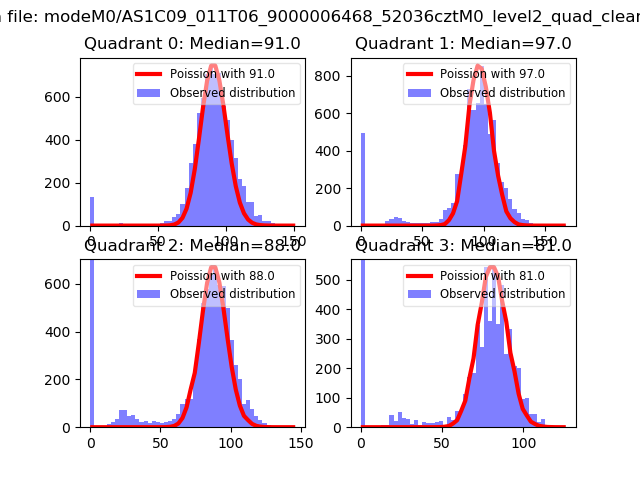 |
 |
| Quadrant-wise count rates Data is divided into 100 sec bins |
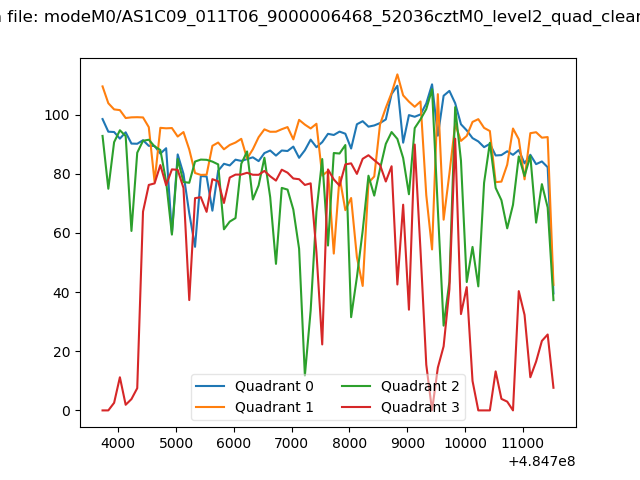 |
|
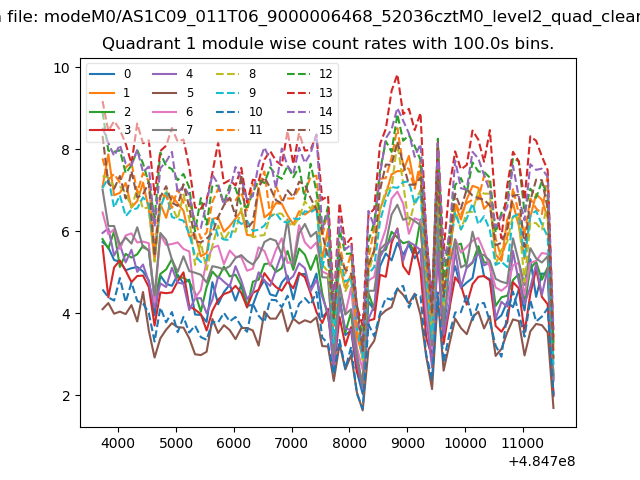
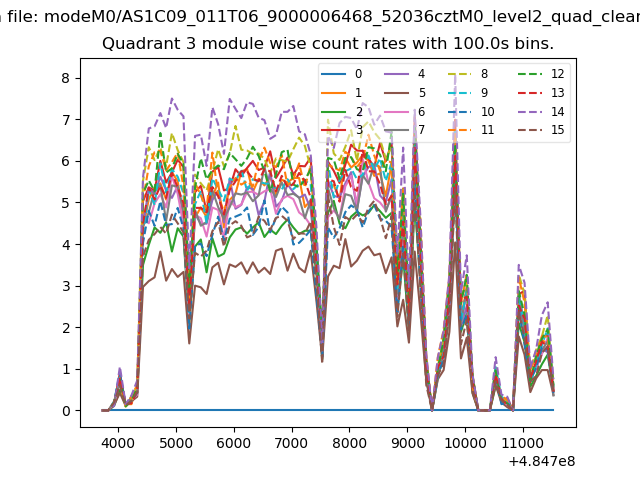
| Module-wise count rates for Quadrant A Data is divided into 100 sec bins |
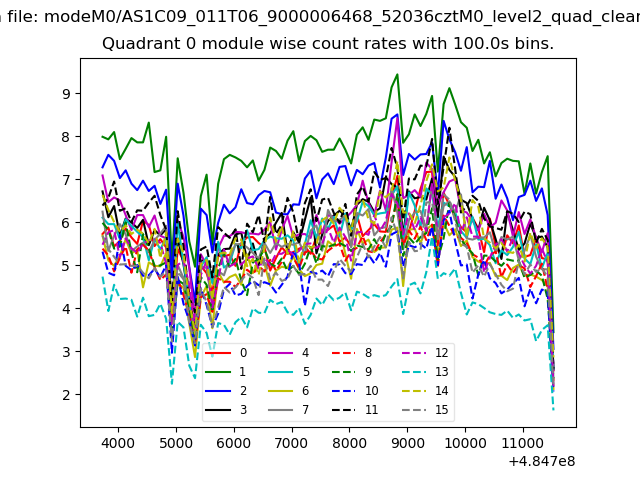 |
 |
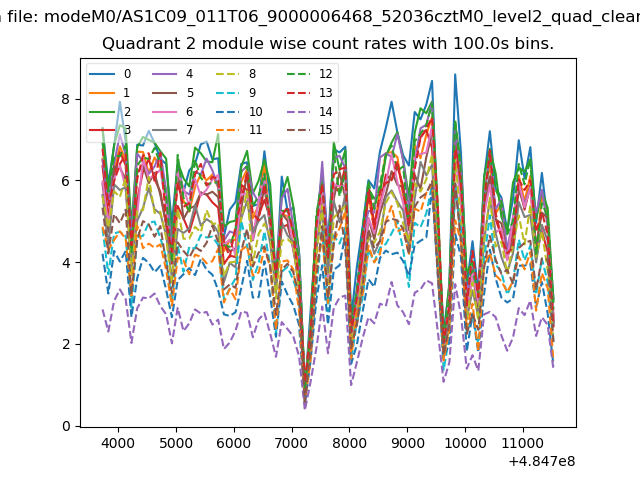
| Module-wise count rates for Quadrant B Data is divided into 100 sec bins |
 |
 |
| Module-wise count rates for Quadrant C Data is divided into 100 sec bins |
 |
 |
| Module-wise count rates for Quadrant D Data is divided into 100 sec bins |
 |
 |
| Parameter | Plot |
|---|---|
| CZT HV Monitor | 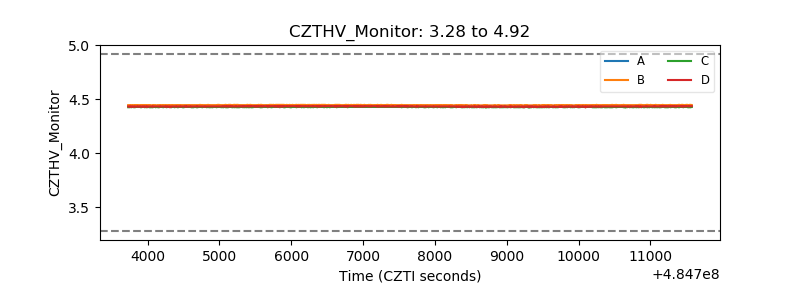 |
| D_VDD | 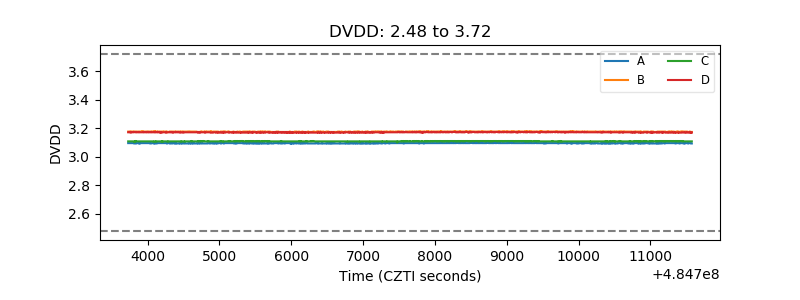 |
| Temperature 1 | 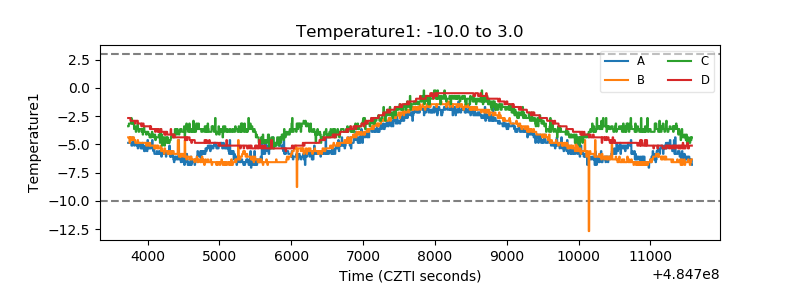 |
| Veto HV Monitor | 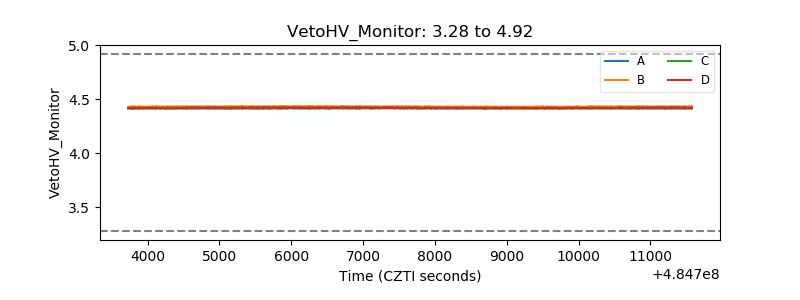 |
| Veto LLD | 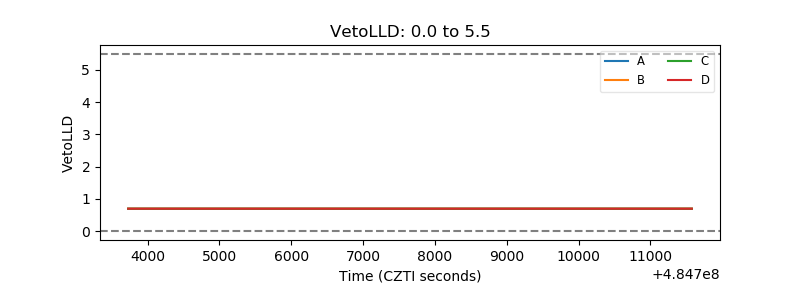 |
| Alpha Counter | 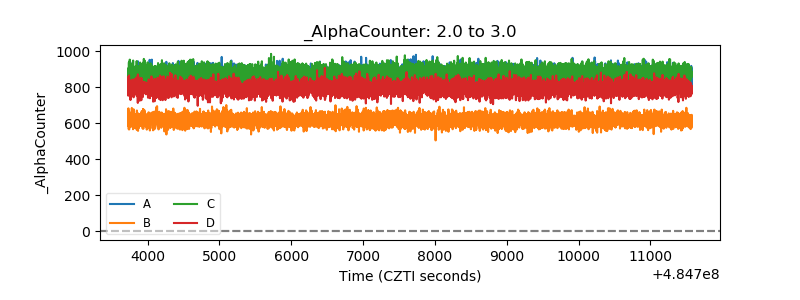 |
| _CPM_Rate | 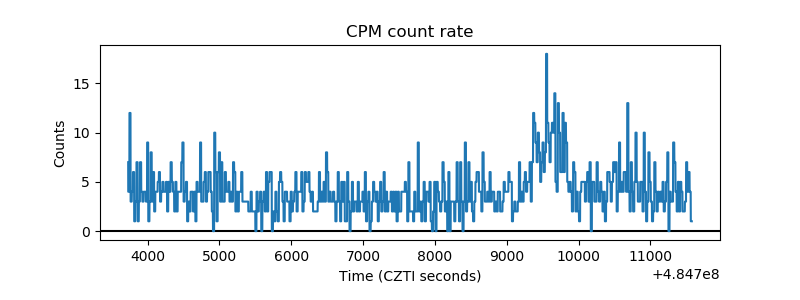 |
| CZT Counter | 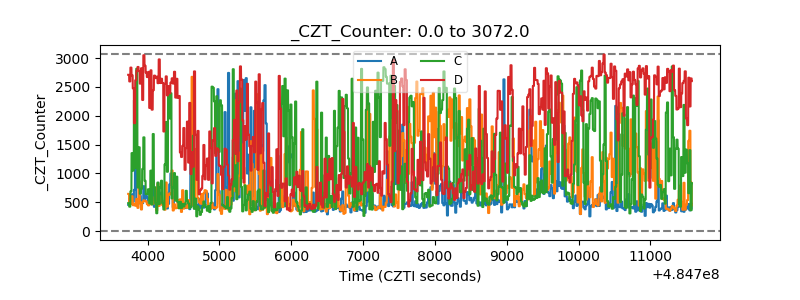 |
| +2.5 Volts monitor | 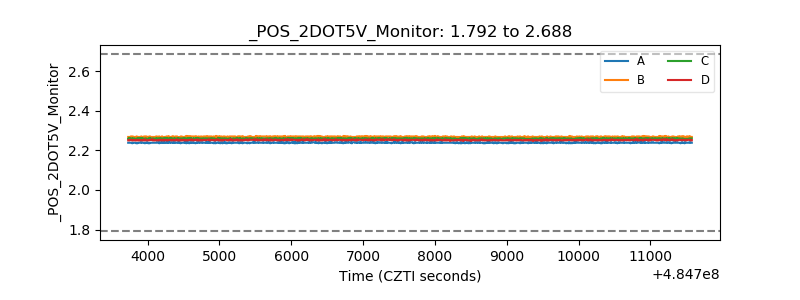 |
| +5 Volts monitor | 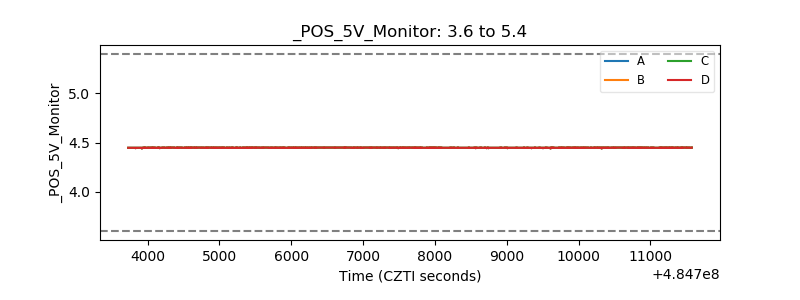 |
| _ROLL_ROT | 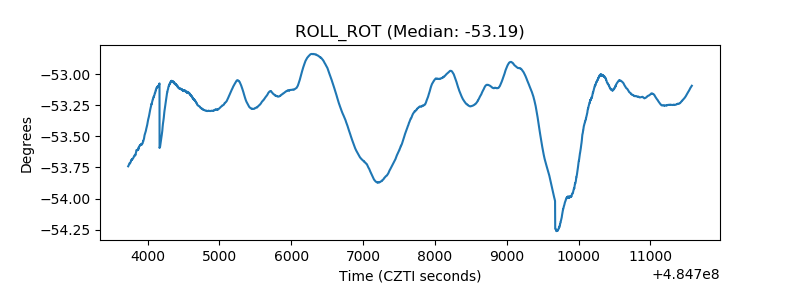 |
| _Roll_DEC | 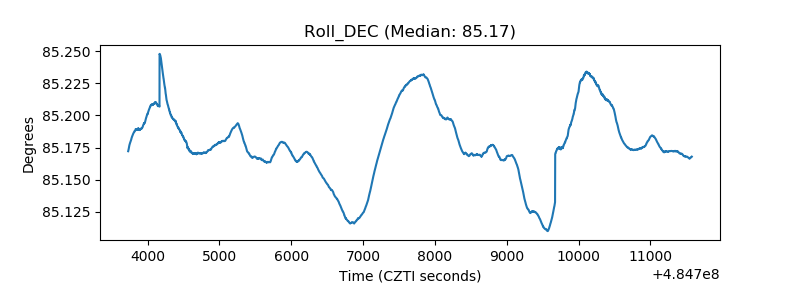 |
| _Roll_RA | 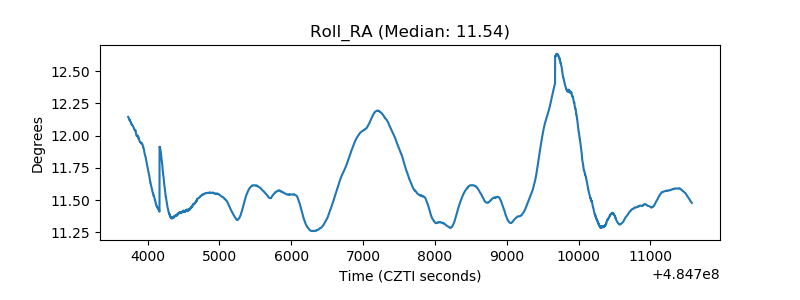 |
| Veto Counter | 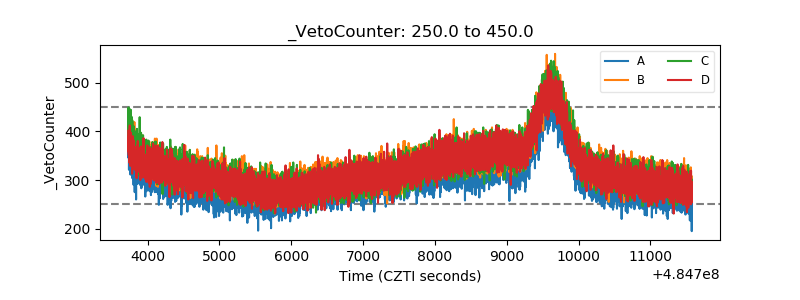 |