| Param | Original file | Final file |
|---|---|---|
| Filename | modeM0/AS1C09_011T06_9000006468_52050cztM0_level2.fits | modeM0/AS1C09_011T06_9000006468_52050cztM0_level2_quad_clean.evt |
| Size (bytes) | 1,042,778,880 | 79,427,520 |
| Size | 994.5 MB | 75.7 MB |
| Events in quadrant A | 3,916,624 | 672,668 |
| Events in quadrant B | 5,559,400 | 694,946 |
| Events in quadrant C | 10,271,056 | 484,338 |
| Events in quadrant D | 18,284,557 | 41,286 |
| Mode M0 | |||
|---|---|---|---|
| Quadrant | BADHDUFLAG | Total packets | Discarded packets |
| A | 0 | 16961 | 2 |
| B | 0 | 21627 | 2 |
| C | 0 | 35693 | 2 |
| D | 0 | 59418 | 2 |
| Mode M9 | |||
|---|---|---|---|
| Quadrant | BADHDUFLAG | Total packets | Discarded packets |
| A | 0 | 4 | 0 |
| B | 0 | 4 | 0 |
| C | 0 | 4 | 0 |
| D | 0 | 4 | 0 |
| Mode SS | |||
|---|---|---|---|
| Quadrant | BADHDUFLAG | Total packets | Discarded packets |
| A | 0 | 148 | 0 |
| B | 0 | 148 | 0 |
| C | 0 | 148 | 0 |
| D | 0 | 148 | 0 |
| Quadrant | Total seconds | Saturated seconds | Saturation percentage |
|---|---|---|---|
| A | 7351 | 101 | 1.373963% |
| B | 7351 | 521 | 7.087471% |
| C | 7351 | 2164 | 29.438172% |
| D | 7351 | 6895 | 93.796762% |
Noise dominated data is calculated using 1-second bins in cleaned event files. If a bin has >2000 counts, and if more than 50% of those come from <1% of pixels, then it is considered to be noise-dominated and hence unusable.
| Quadrant | # 1 sec bins | Bins with >0 counts | Bins with >2000 counts | High rate bins dominated by noise | Noise dominated (total time) | Noise dominated (detector-on time) | Marked lightcurve |
|---|---|---|---|---|---|---|---|
| A | 7756 | 7353 | 58 | 58 | 0.75% | 0.79% | 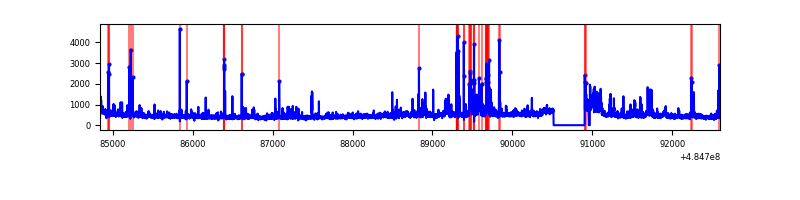 |
| B | 7756 | 7353 | 263 | 263 | 3.39% | 3.58% | 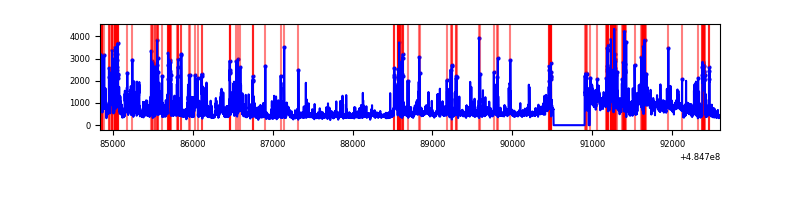 |
| C | 7756 | 7352 | 1783 | 1783 | 22.99% | 24.25% | 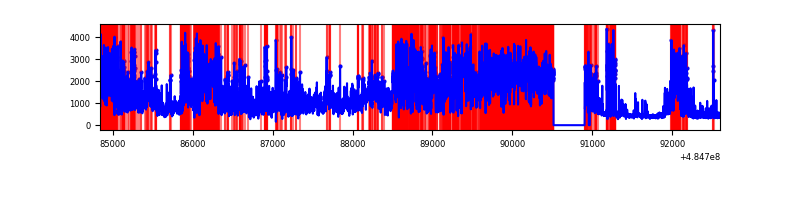 |
| D | 7755 | 7350 | 6558 | 6558 | 84.56% | 89.22% | 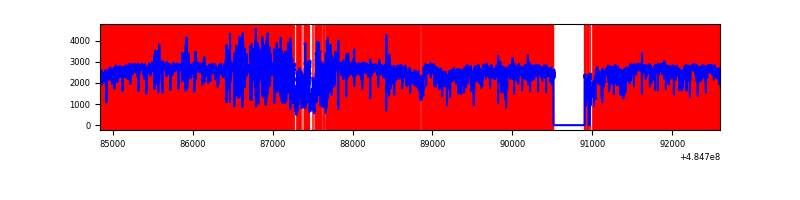 |
Top three noisy pixels from each quadrant. If the there are fewer than three noisy pixels in the level2.evt file, extra rows are filled as -1
| Pixel properties | Quadrant properties | ||||||
|---|---|---|---|---|---|---|---|
| Quadrant | DetID | PixID | Counts | Sigma | Mean | Median | Sigma |
| A | 5 | 17 | 148562 | 787.01 | 750 | 732 | 187.8 |
| A | 3 | 79 | 102432 | 541.42 | 750 | 732 | 187.8 |
| A | 4 | 3 | 88367 | 466.54 | 750 | 732 | 187.8 |
| B | 5 | 172 | 1174374 | 7591.39 | 735 | 710 | 154.6 |
| B | 0 | 171 | 218013 | 1405.54 | 735 | 710 | 154.6 |
| B | 5 | 185 | 216672 | 1396.86 | 735 | 710 | 154.6 |
| C | 15 | 224 | 3695947 | 21490.32 | 620 | 614 | 172.0 |
| C | 9 | 38 | 2891930 | 16814.54 | 620 | 614 | 172.0 |
| C | 4 | 5 | 809958 | 4706.76 | 620 | 614 | 172.0 |
| D | 15 | 94 | 10873064 | 209591.0 | 167 | 159 | 51.9 |
| D | 6 | 42 | 5397970 | 104050.63 | 167 | 159 | 51.9 |
| D | 8 | 176 | 267107 | 5145.81 | 167 | 159 | 51.9 |
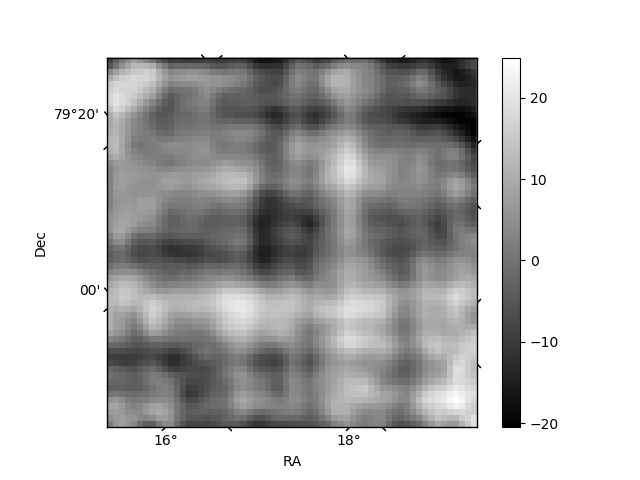
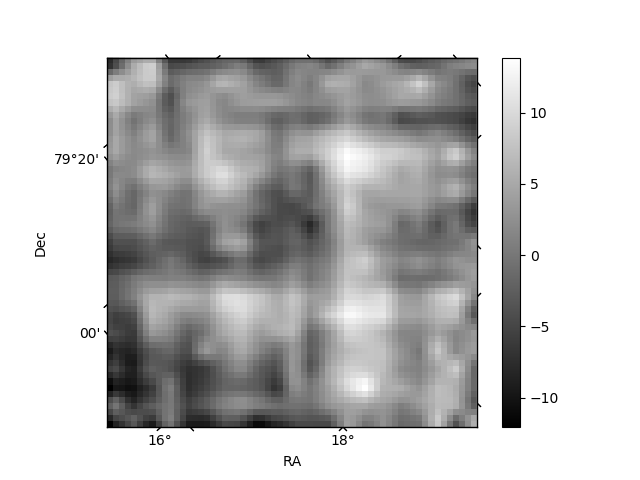
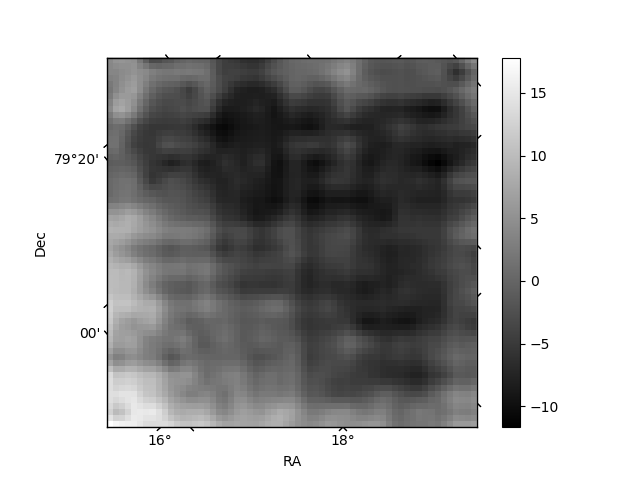
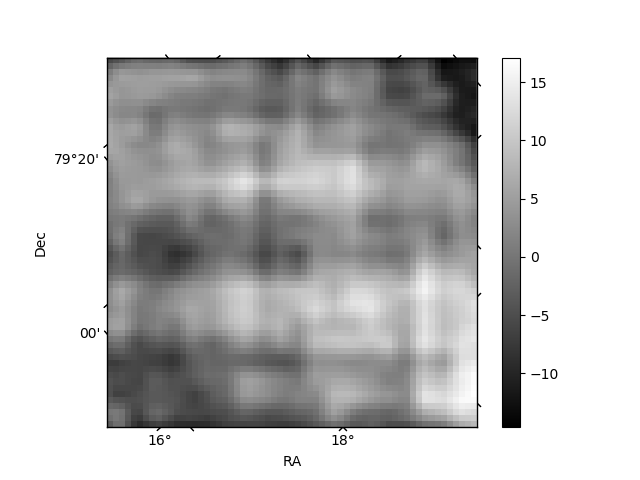
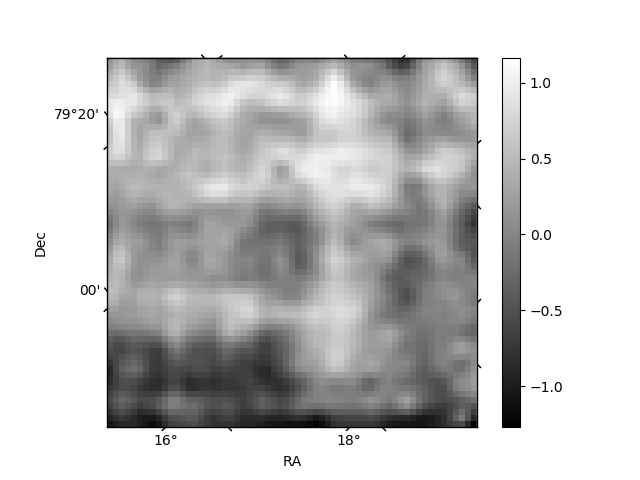
Histogram calculated using DETX and DETY for each event in the final _common_clean file
| Quadrant A | 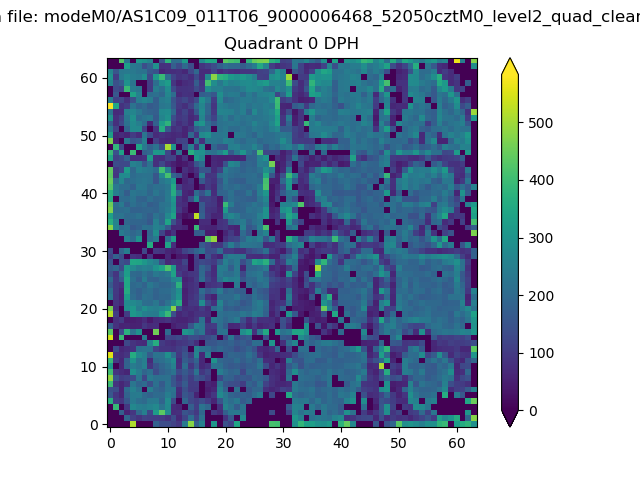 |
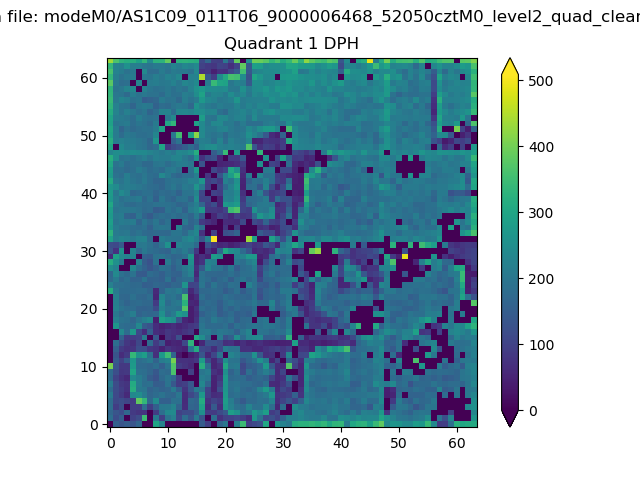 |
Quadrant B |
|---|---|---|---|
| Quadrant D | 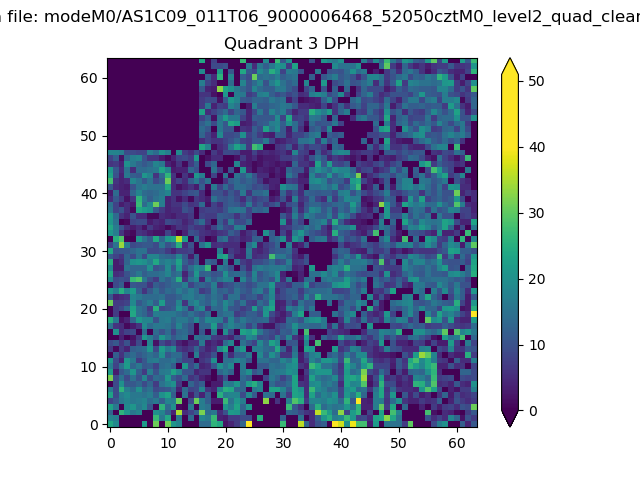 |
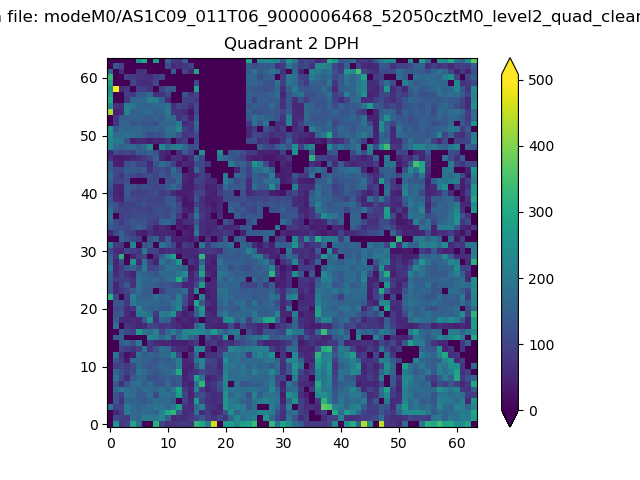 |
Quadrant C |
| Plot type | Count rate plots | Images |
|---|---|---|
| Comparison with Poisson distribution Blue bars denote a histogram of data divided into 1 sec bins. Red curve is a Poisson curve with rate = median count rate of data. |
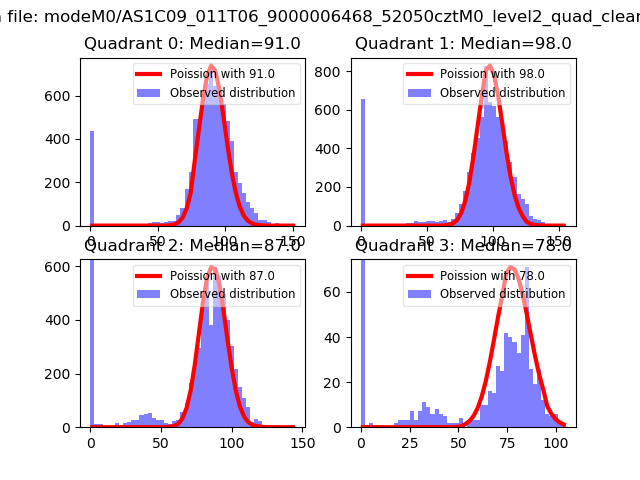 |
 |
| Quadrant-wise count rates Data is divided into 100 sec bins |
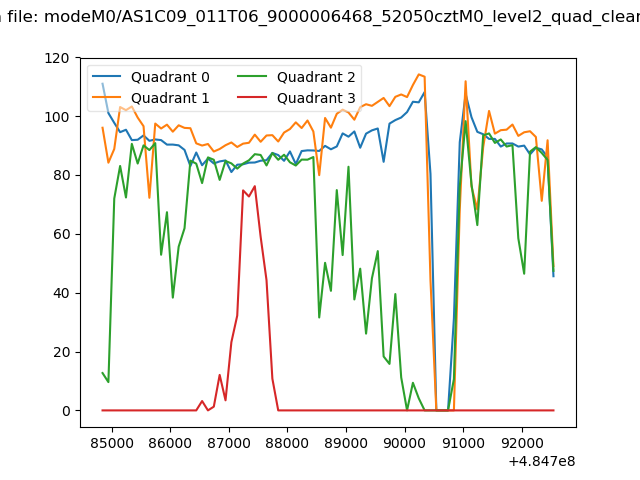 |
|
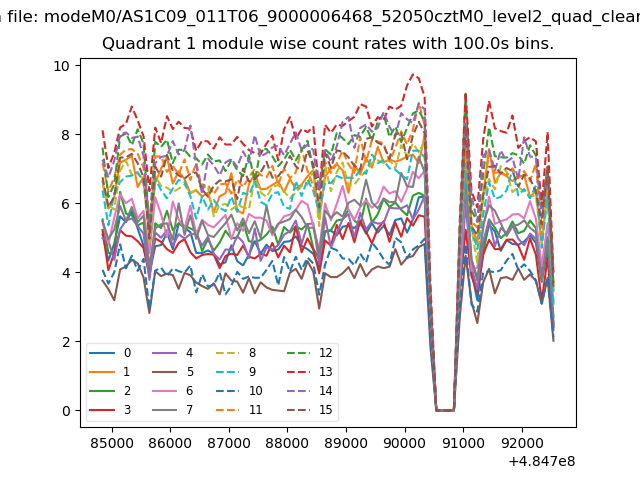
| Module-wise count rates for Quadrant A Data is divided into 100 sec bins |
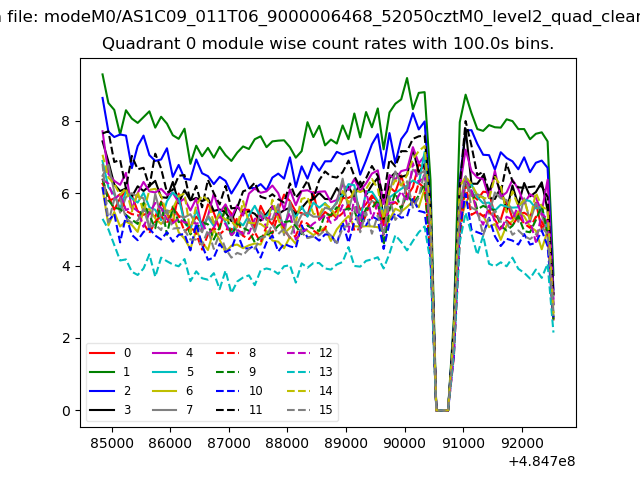 |
 |
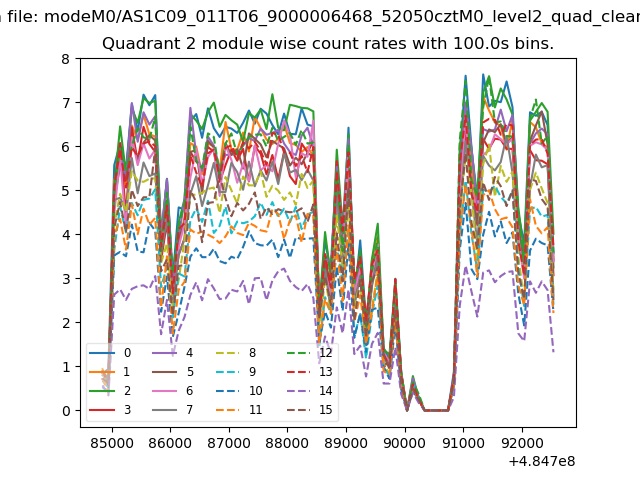
| Module-wise count rates for Quadrant B Data is divided into 100 sec bins |
 |
 |
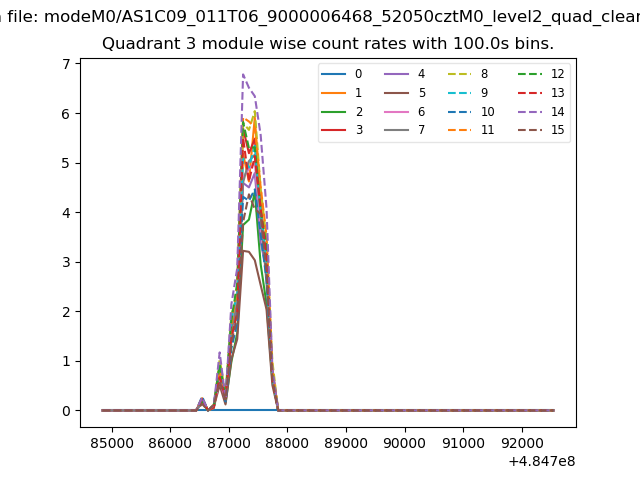
| Module-wise count rates for Quadrant C Data is divided into 100 sec bins |
 |
 |
| Module-wise count rates for Quadrant D Data is divided into 100 sec bins |
 |
 |
| Parameter | Plot |
|---|---|
| CZT HV Monitor | 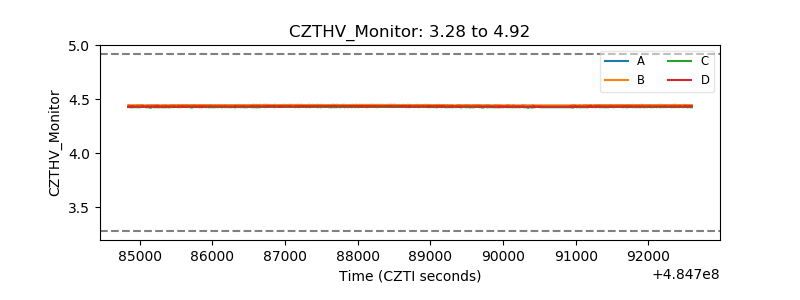 |
| D_VDD | 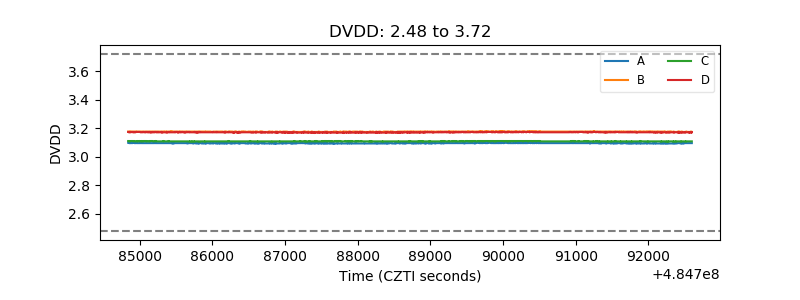 |
| Temperature 1 | 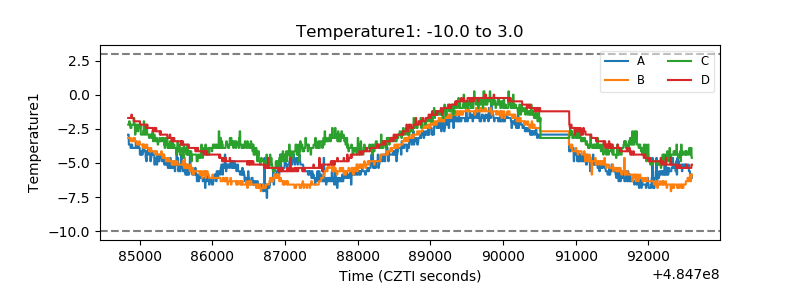 |
| Veto HV Monitor | 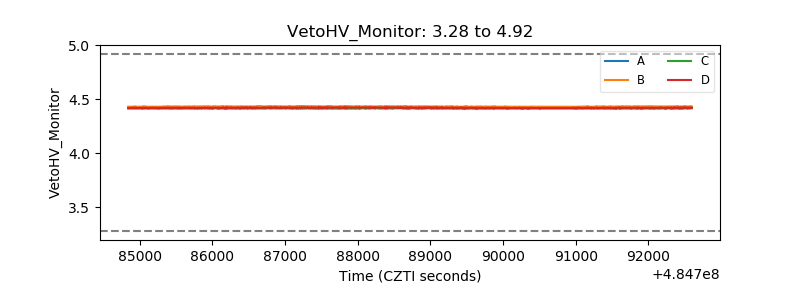 |
| Veto LLD | 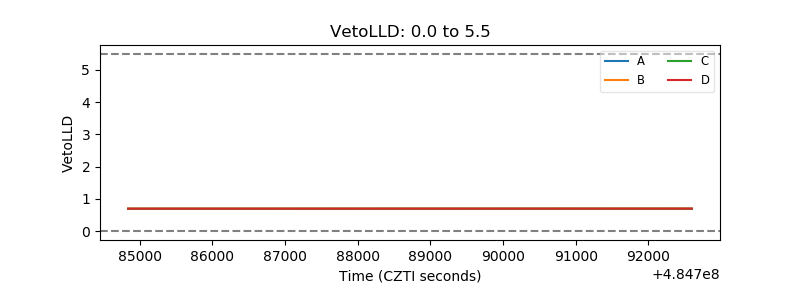 |
| Alpha Counter | 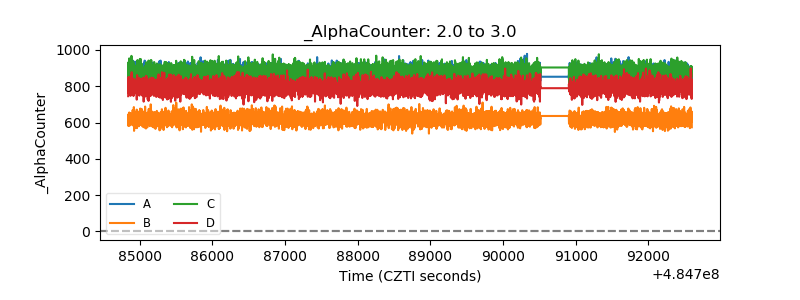 |
| _CPM_Rate | 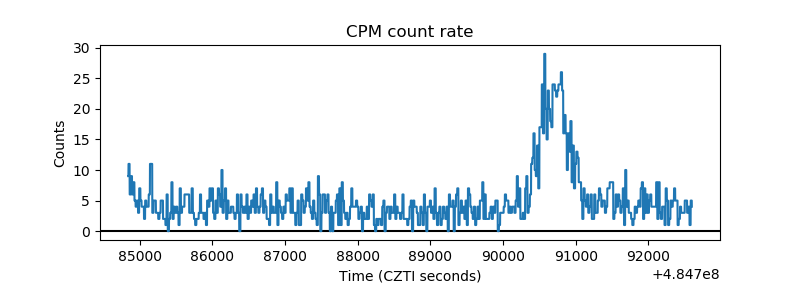 |
| CZT Counter | 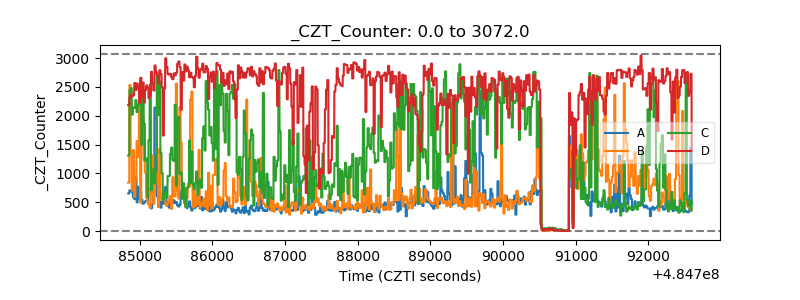 |
| +2.5 Volts monitor | 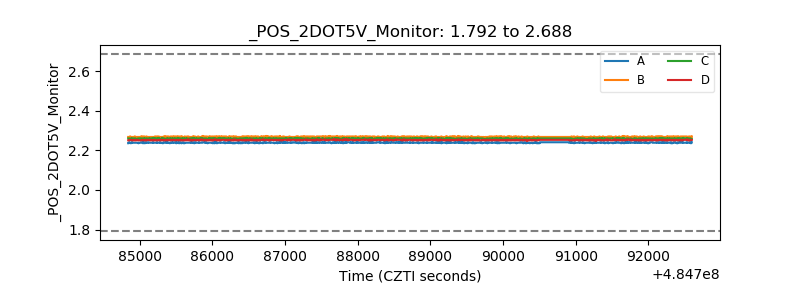 |
| +5 Volts monitor | 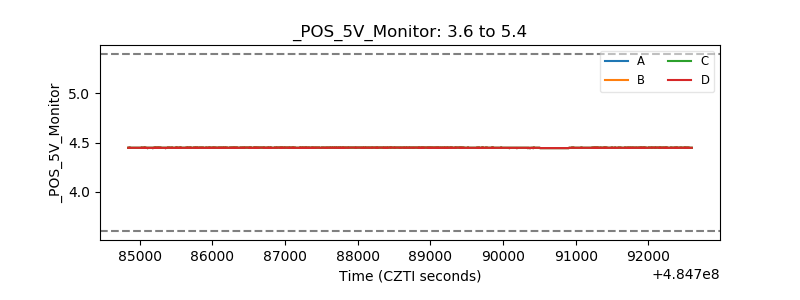 |
| _ROLL_ROT | 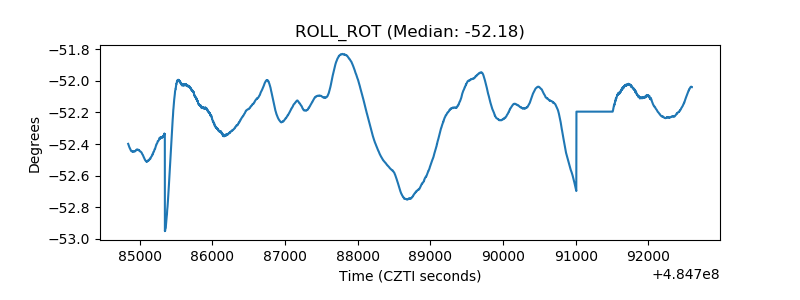 |
| _Roll_DEC | 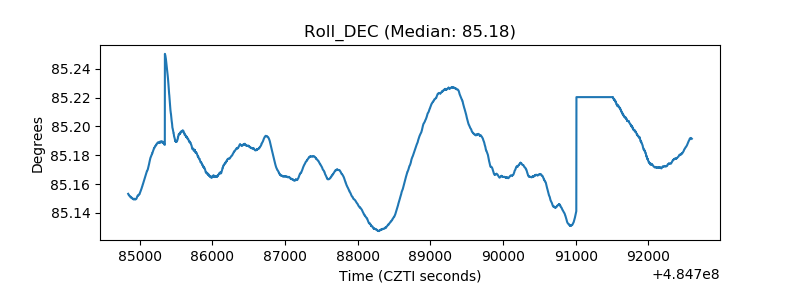 |
| _Roll_RA | 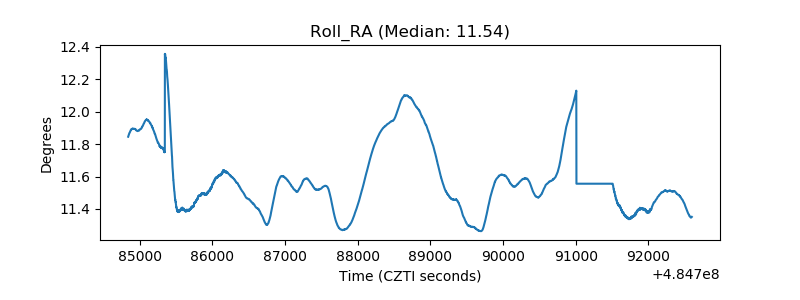 |
| Veto Counter | 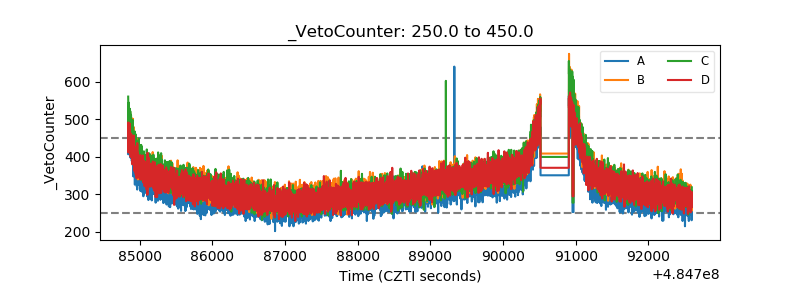 |