| Param | Original file | Final file |
|---|---|---|
| Filename | modeM0/AS1C09_011T06_9000006468_52051cztM0_level2.fits | modeM0/AS1C09_011T06_9000006468_52051cztM0_level2_quad_clean.evt |
| Size (bytes) | 982,647,360 | 80,297,280 |
| Size | 937.1 MB | 76.6 MB |
| Events in quadrant A | 4,071,221 | 669,602 |
| Events in quadrant B | 7,276,880 | 588,423 |
| Events in quadrant C | 4,932,110 | 648,761 |
| Events in quadrant D | 19,513,846 | 3,502 |
| Mode M0 | |||
|---|---|---|---|
| Quadrant | BADHDUFLAG | Total packets | Discarded packets |
| A | 0 | 17670 | 0 |
| B | 0 | 26877 | 0 |
| C | 0 | 20117 | 0 |
| D | 0 | 63089 | 2 |
| Mode SS | |||
|---|---|---|---|
| Quadrant | BADHDUFLAG | Total packets | Discarded packets |
| A | 0 | 150 | 0 |
| B | 0 | 150 | 0 |
| C | 0 | 150 | 0 |
| D | 0 | 150 | 0 |
| Quadrant | Total seconds | Saturated seconds | Saturation percentage |
|---|---|---|---|
| A | 7481 | 179 | 2.392728% |
| B | 7482 | 1572 | 21.010425% |
| C | 7482 | 323 | 4.317028% |
| D | 7481 | 7453 | 99.625718% |
Noise dominated data is calculated using 1-second bins in cleaned event files. If a bin has >2000 counts, and if more than 50% of those come from <1% of pixels, then it is considered to be noise-dominated and hence unusable.
| Quadrant | # 1 sec bins | Bins with >0 counts | Bins with >2000 counts | High rate bins dominated by noise | Noise dominated (total time) | Noise dominated (detector-on time) | Marked lightcurve |
|---|---|---|---|---|---|---|---|
| A | 7481 | 7481 | 140 | 140 | 1.87% | 1.87% | 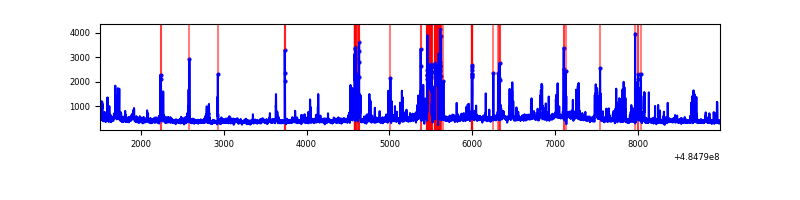 |
| B | 7481 | 7481 | 1005 | 1005 | 13.43% | 13.43% | 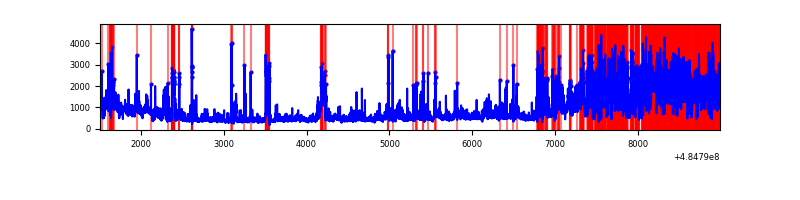 |
| C | 7482 | 7482 | 285 | 285 | 3.81% | 3.81% | 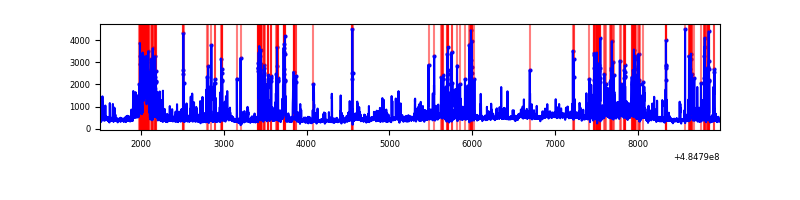 |
| D | 7480 | 7480 | 7284 | 7284 | 97.38% | 97.38% | 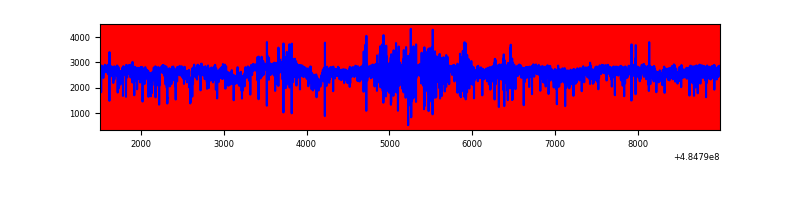 |
Top three noisy pixels from each quadrant. If the there are fewer than three noisy pixels in the level2.evt file, extra rows are filled as -1
| Pixel properties | Quadrant properties | ||||||
|---|---|---|---|---|---|---|---|
| Quadrant | DetID | PixID | Counts | Sigma | Mean | Median | Sigma |
| A | 15 | 174 | 292436 | 1555.82 | 741 | 722 | 187.5 |
| A | 8 | 43 | 102004 | 540.17 | 741 | 722 | 187.5 |
| A | 8 | 247 | 99222 | 525.34 | 741 | 722 | 187.5 |
| B | 12 | 32 | 2055005 | 14369.93 | 668 | 643 | 143.0 |
| B | 8 | 3 | 1146035 | 8011.83 | 668 | 643 | 143.0 |
| B | 5 | 172 | 531594 | 3713.92 | 668 | 643 | 143.0 |
| C | 15 | 224 | 982024 | 4873.76 | 731 | 724 | 201.3 |
| C | 1 | 242 | 431902 | 2141.5 | 731 | 724 | 201.3 |
| C | 15 | 230 | 120945 | 597.09 | 731 | 724 | 201.3 |
| D | 15 | 94 | 16690661 | 354895.61 | 145 | 137 | 47.0 |
| D | 6 | 42 | 1260449 | 26798.39 | 145 | 137 | 47.0 |
| D | 0 | 18 | 277968 | 5907.6 | 145 | 137 | 47.0 |
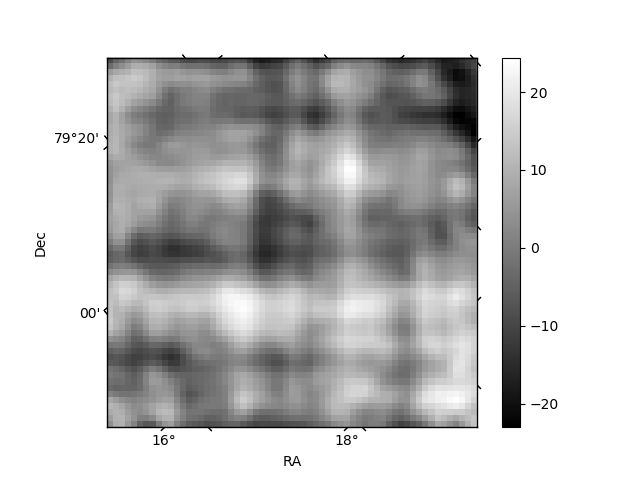
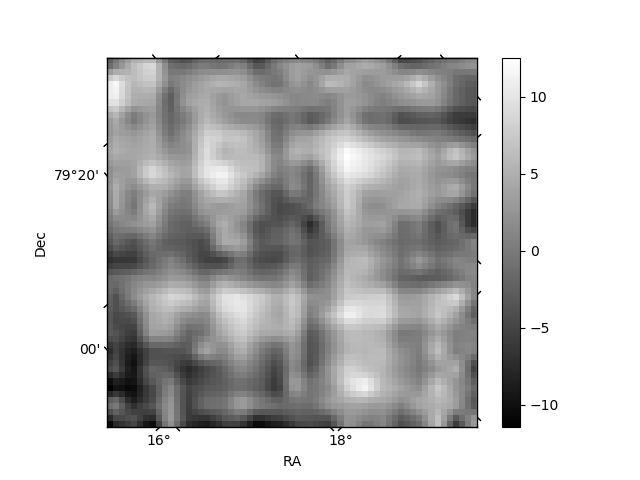
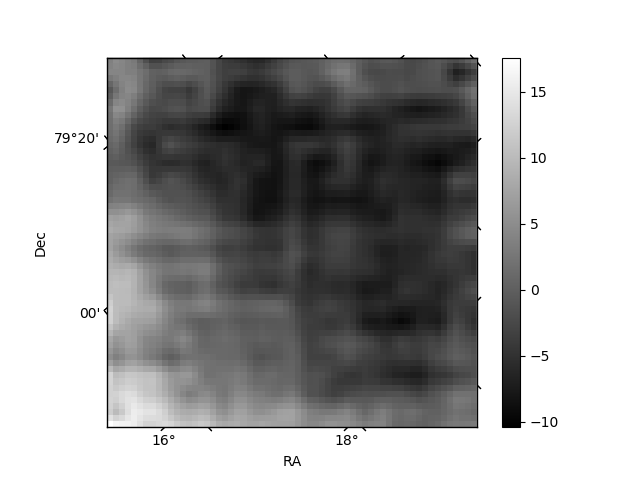
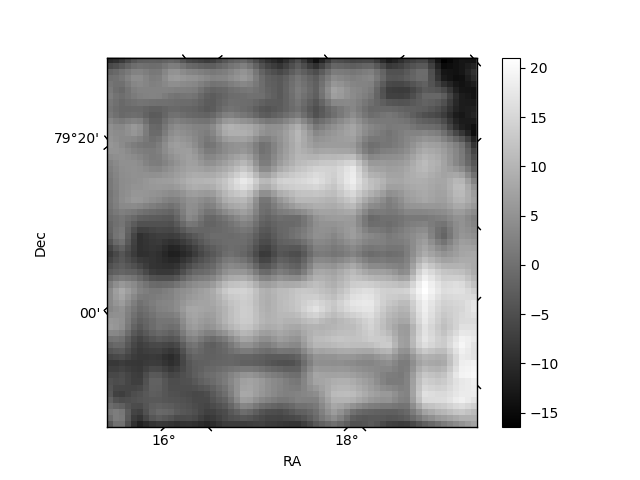
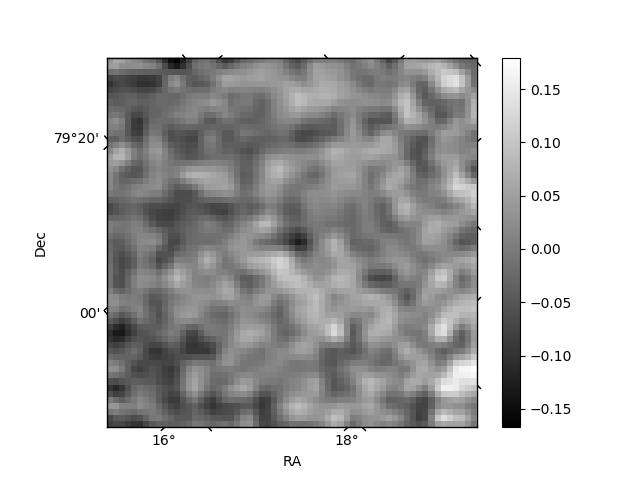
Histogram calculated using DETX and DETY for each event in the final _common_clean file
| Quadrant A | 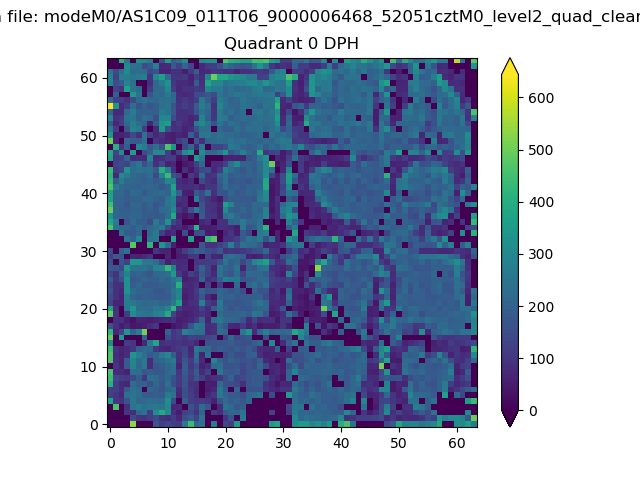 |
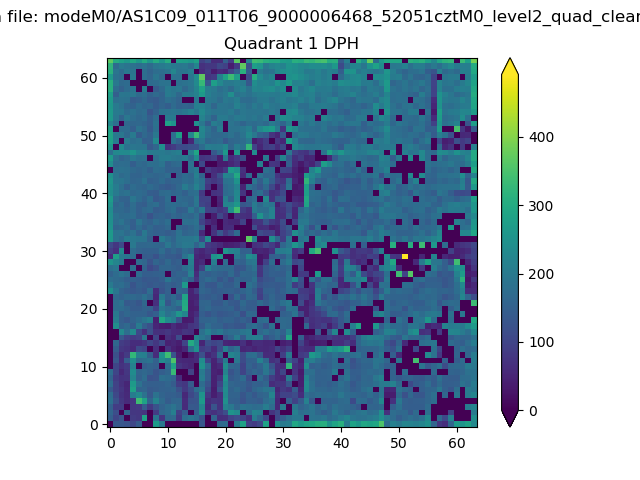 |
Quadrant B |
|---|---|---|---|
| Quadrant D | 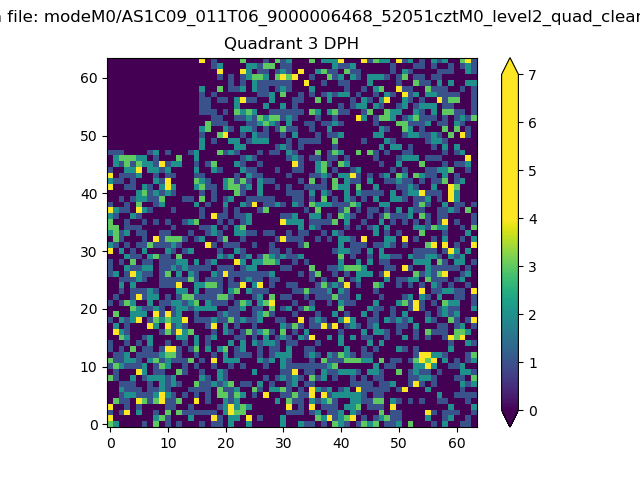 |
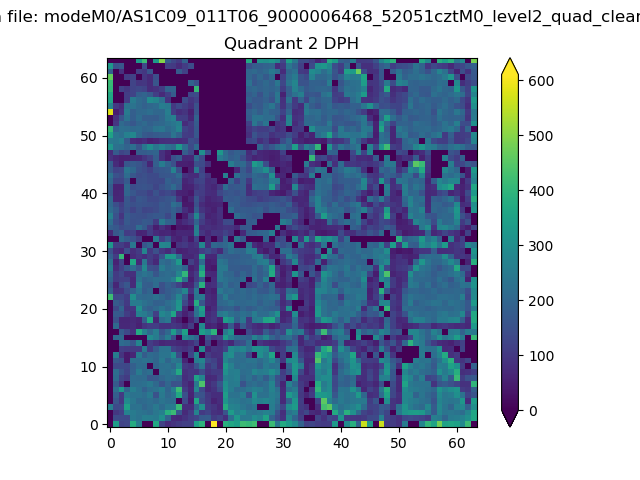 |
Quadrant C |
| Plot type | Count rate plots | Images |
|---|---|---|
| Comparison with Poisson distribution Blue bars denote a histogram of data divided into 1 sec bins. Red curve is a Poisson curve with rate = median count rate of data. |
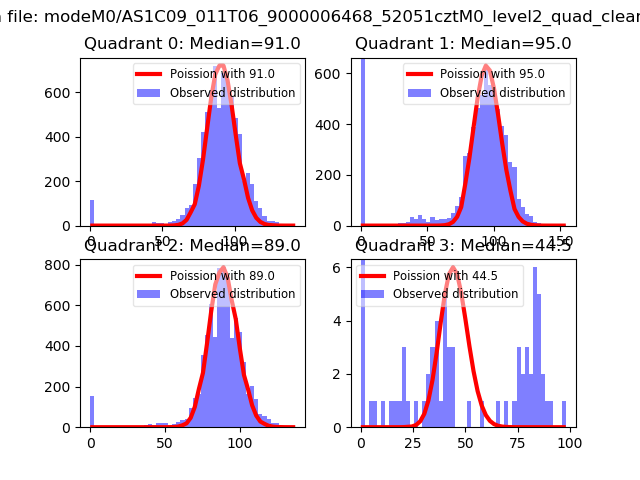 |
 |
| Quadrant-wise count rates Data is divided into 100 sec bins |
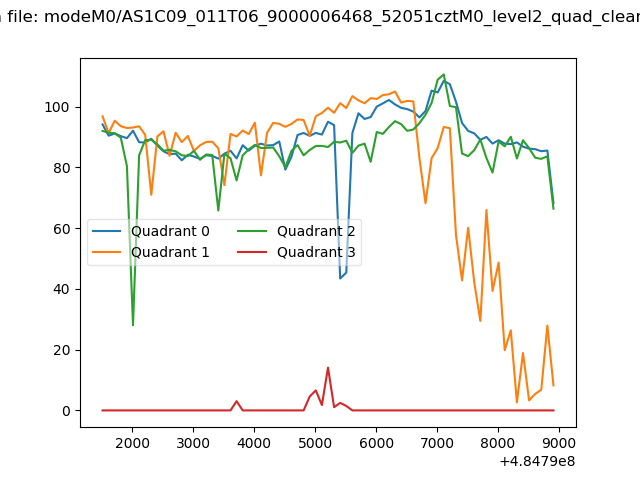 |
|
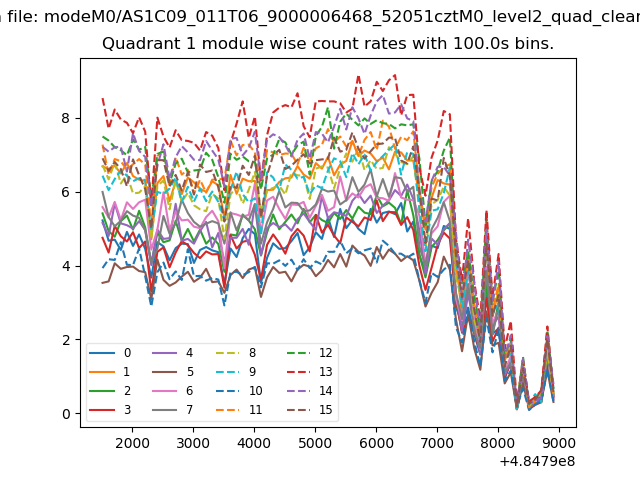
| Module-wise count rates for Quadrant A Data is divided into 100 sec bins |
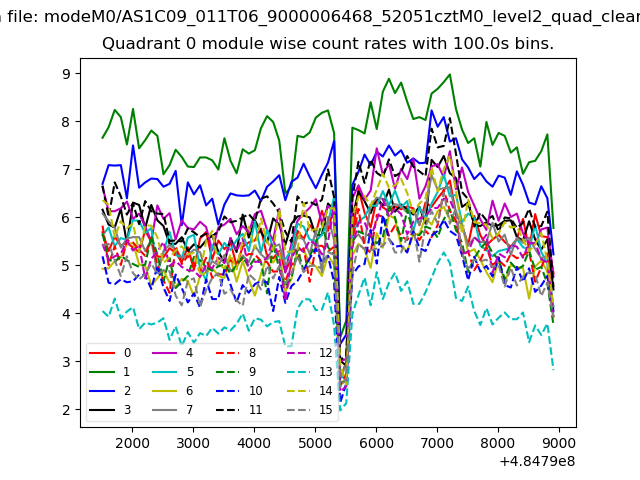 |
 |
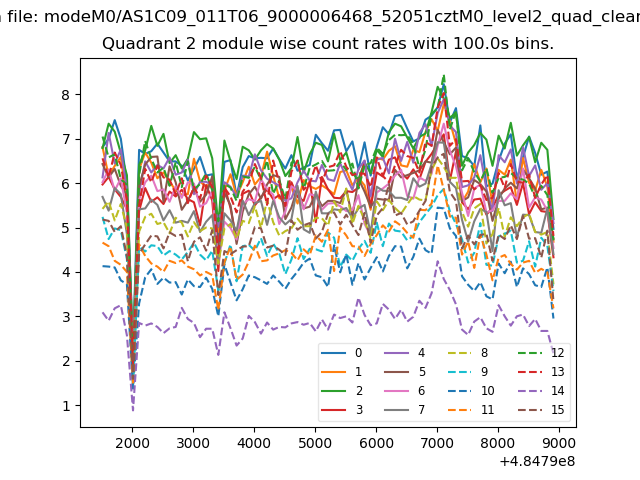
| Module-wise count rates for Quadrant B Data is divided into 100 sec bins |
 |
 |
| Module-wise count rates for Quadrant C Data is divided into 100 sec bins |
 |
 |
| Module-wise count rates for Quadrant D Data is divided into 100 sec bins |
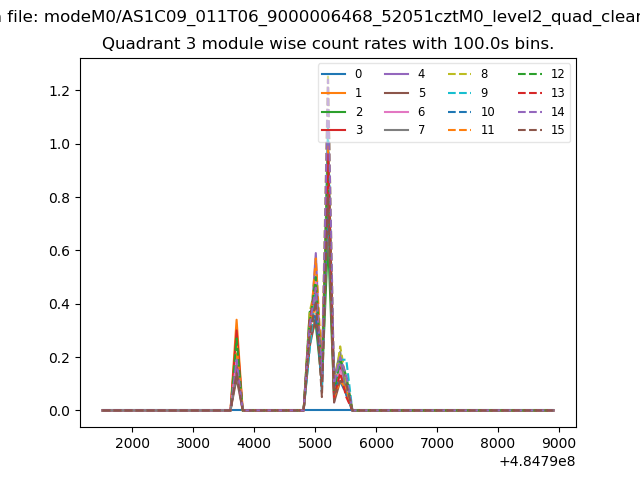 |
 |
| Parameter | Plot |
|---|---|
| CZT HV Monitor | 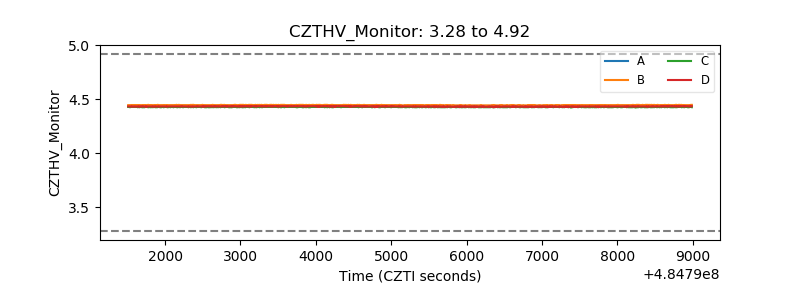 |
| D_VDD | 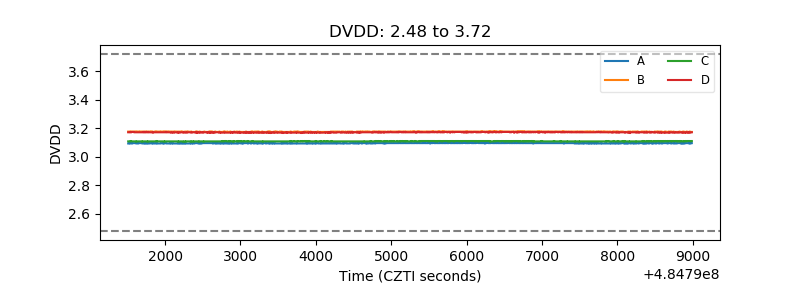 |
| Temperature 1 | 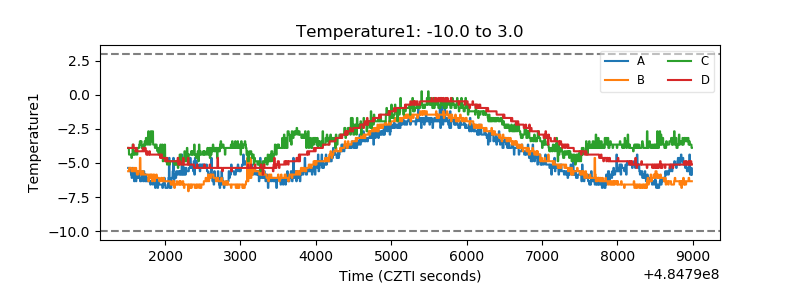 |
| Veto HV Monitor | 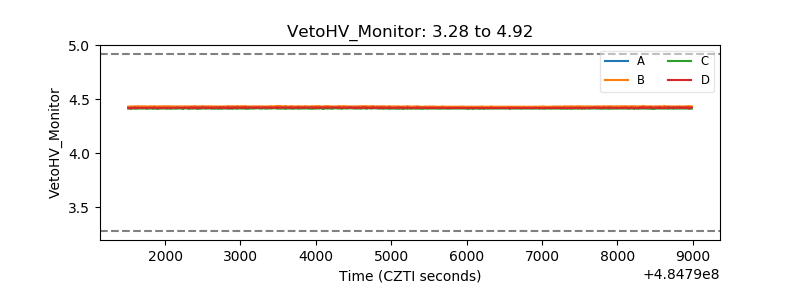 |
| Veto LLD | 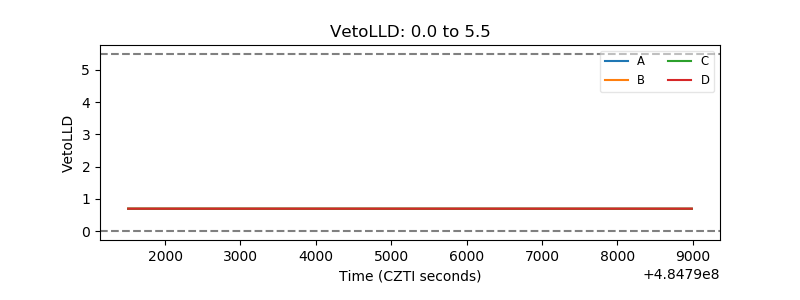 |
| Alpha Counter | 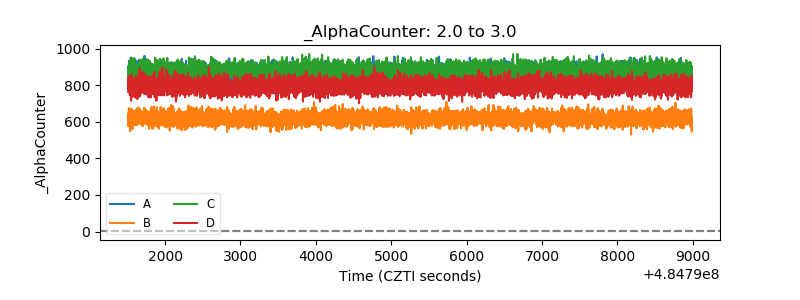 |
| _CPM_Rate | 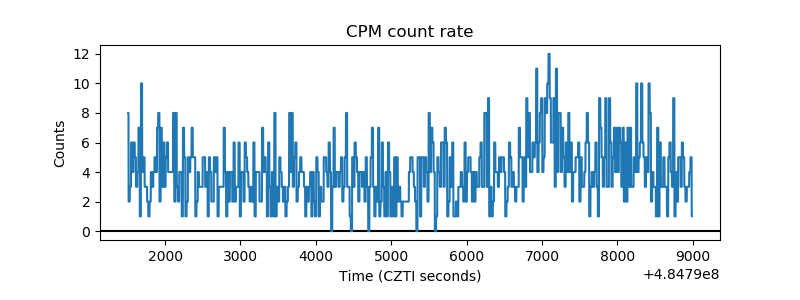 |
| CZT Counter | 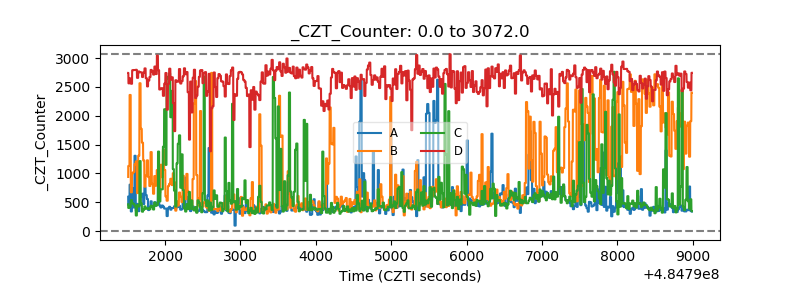 |
| +2.5 Volts monitor | 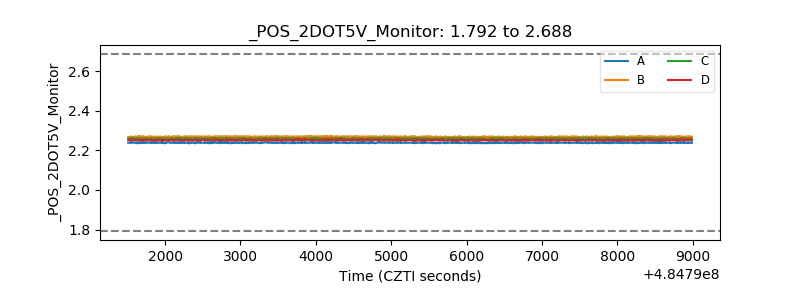 |
| +5 Volts monitor | 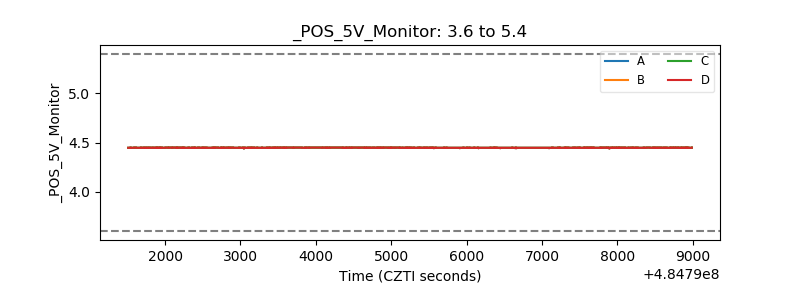 |
| _ROLL_ROT | 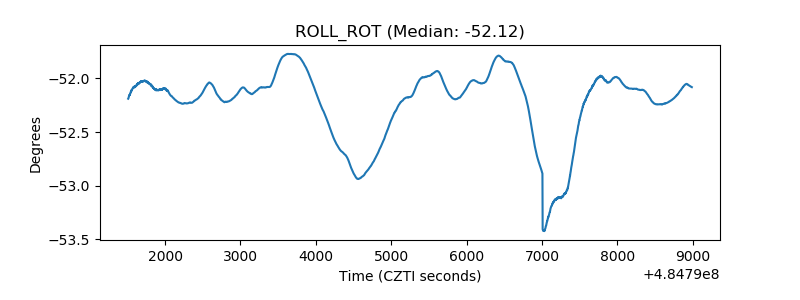 |
| _Roll_DEC | 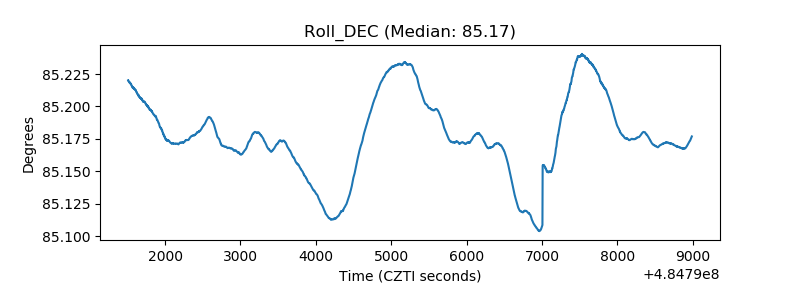 |
| _Roll_RA | 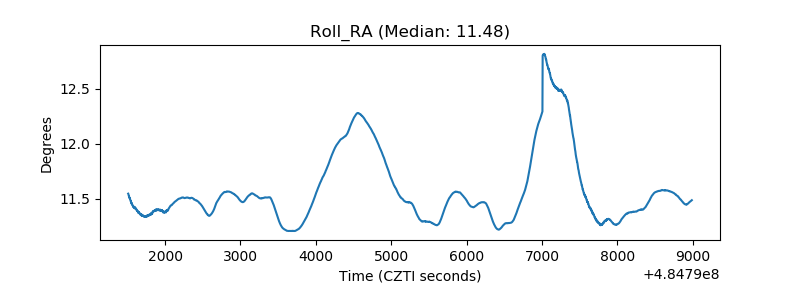 |
| Veto Counter | 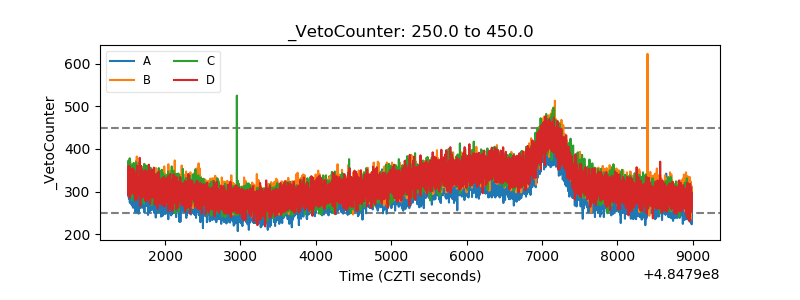 |