| Param | Original file | Final file |
|---|---|---|
| Filename | modeM0/AS1C09_011T06_9000006468_52052cztM0_level2.fits | modeM0/AS1C09_011T06_9000006468_52052cztM0_level2_quad_clean.evt |
| Size (bytes) | 1,045,684,800 | 53,985,600 |
| Size | 997.2 MB | 51.5 MB |
| Events in quadrant A | 3,814,675 | 578,372 |
| Events in quadrant B | 12,894,113 | 20,522 |
| Events in quadrant C | 4,372,160 | 565,593 |
| Events in quadrant D | 17,118,905 | 12,679 |
| Mode M0 | |||
|---|---|---|---|
| Quadrant | BADHDUFLAG | Total packets | Discarded packets |
| A | 0 | 16668 | 606 |
| B | 0 | 44997 | 2249 |
| C | 0 | 18470 | 751 |
| D | 0 | 58097 | 2766 |
| Mode SS | |||
|---|---|---|---|
| Quadrant | BADHDUFLAG | Total packets | Discarded packets |
| A | 0 | 138 | 8 |
| B | 0 | 136 | 6 |
| C | 0 | 137 | 5 |
| D | 0 | 139 | 7 |
| Quadrant | Total seconds | Saturated seconds | Saturation percentage |
|---|---|---|---|
| A | 6600 | 236 | 3.575758% |
| B | 6525 | 6337 | 97.118774% |
| C | 6576 | 313 | 4.759732% |
| D | 6520 | 6401 | 98.174847% |
Noise dominated data is calculated using 1-second bins in cleaned event files. If a bin has >2000 counts, and if more than 50% of those come from <1% of pixels, then it is considered to be noise-dominated and hence unusable.
| Quadrant | # 1 sec bins | Bins with >0 counts | Bins with >2000 counts | High rate bins dominated by noise | Noise dominated (total time) | Noise dominated (detector-on time) | Marked lightcurve |
|---|---|---|---|---|---|---|---|
| A | 6650 | 6633 | 213 | 213 | 3.20% | 3.21% | 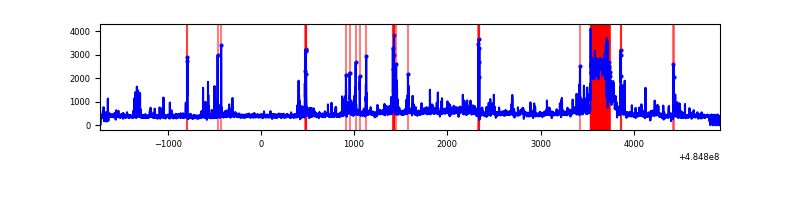 |
| B | 6630 | 6552 | 3349 | 3349 | 50.51% | 51.11% | 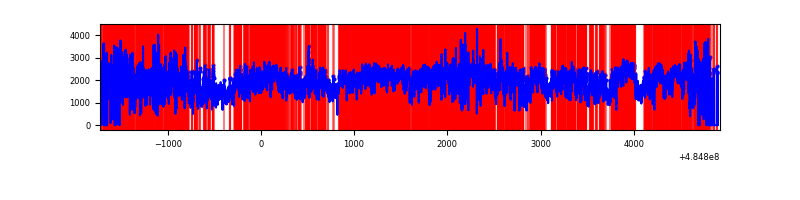 |
| C | 6648 | 6611 | 251 | 251 | 3.78% | 3.80% | 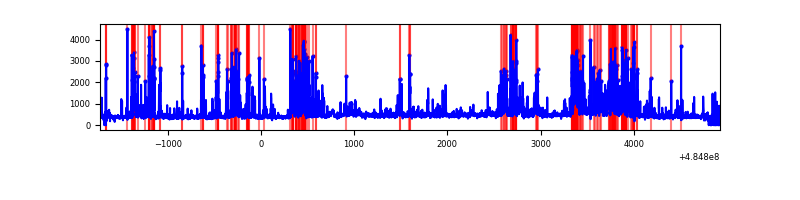 |
| D | 6630 | 6537 | 6218 | 6218 | 93.79% | 95.12% | 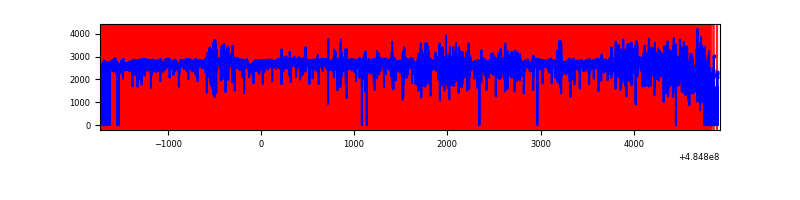 |
Top three noisy pixels from each quadrant. If the there are fewer than three noisy pixels in the level2.evt file, extra rows are filled as -1
| Pixel properties | Quadrant properties | ||||||
|---|---|---|---|---|---|---|---|
| Quadrant | DetID | PixID | Counts | Sigma | Mean | Median | Sigma |
| A | 3 | 95 | 556288 | 3379.55 | 653 | 636 | 164.4 |
| A | 4 | 3 | 209912 | 1272.84 | 653 | 636 | 164.4 |
| A | 5 | 240 | 91335 | 551.64 | 653 | 636 | 164.4 |
| B | 12 | 32 | 11072237 | 533360.73 | 89 | 86 | 20.8 |
| B | 8 | 3 | 1358890 | 65455.46 | 89 | 86 | 20.8 |
| B | 10 | 254 | 30277 | 1454.34 | 89 | 86 | 20.8 |
| C | 15 | 224 | 879893 | 4885.23 | 644 | 639 | 180.0 |
| C | 1 | 242 | 487763 | 2706.51 | 644 | 639 | 180.0 |
| C | 13 | 3 | 168414 | 932.18 | 644 | 639 | 180.0 |
| D | 15 | 94 | 10727745 | 168730.91 | 205 | 194 | 63.6 |
| D | 6 | 42 | 2326862 | 36595.57 | 205 | 194 | 63.6 |
| D | 12 | 1 | 1038607 | 16332.93 | 205 | 194 | 63.6 |
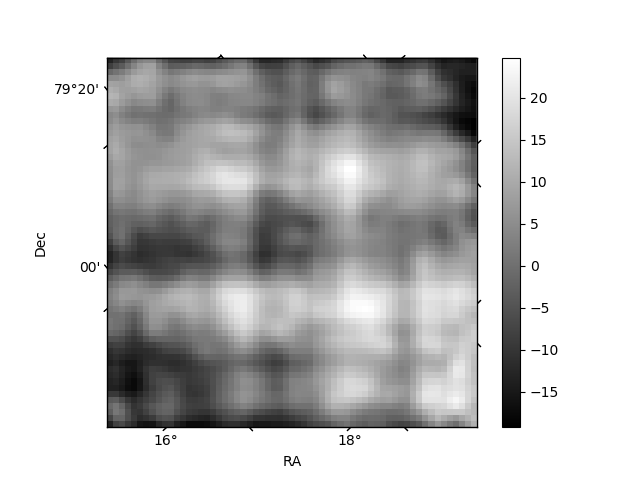
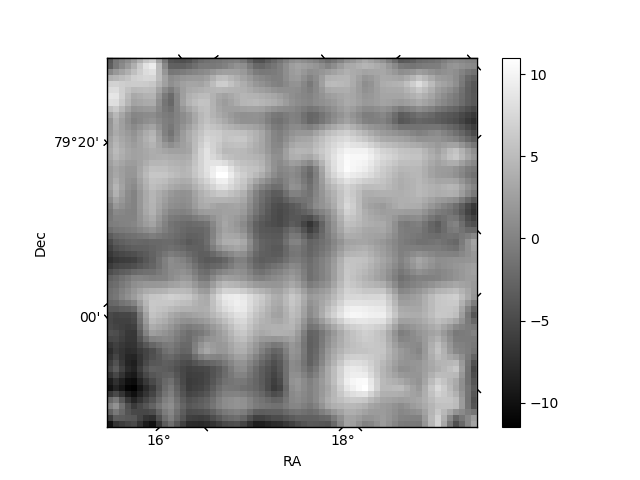
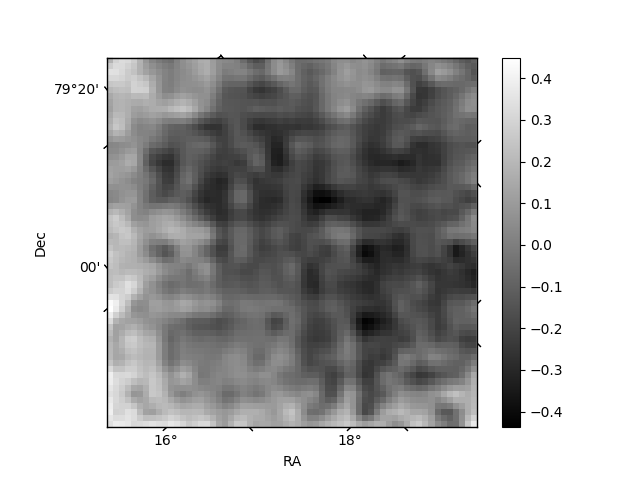
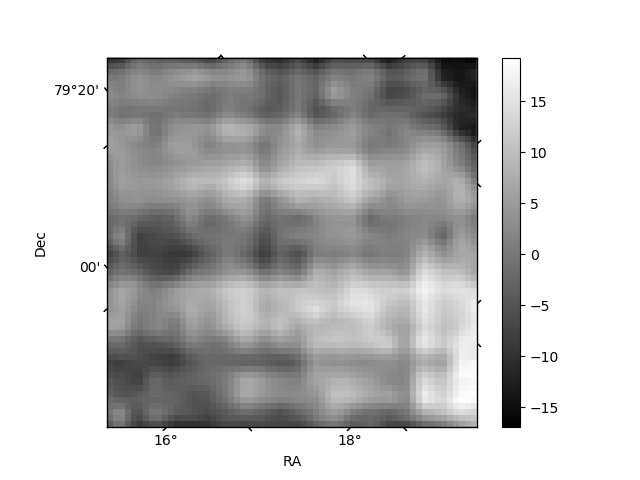
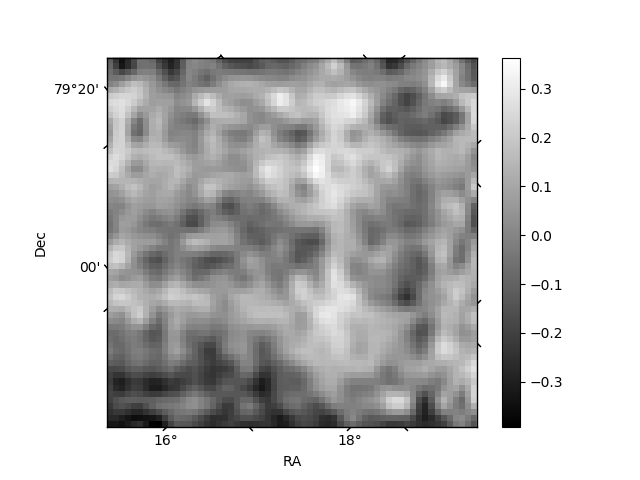
Histogram calculated using DETX and DETY for each event in the final _common_clean file
| Quadrant A | 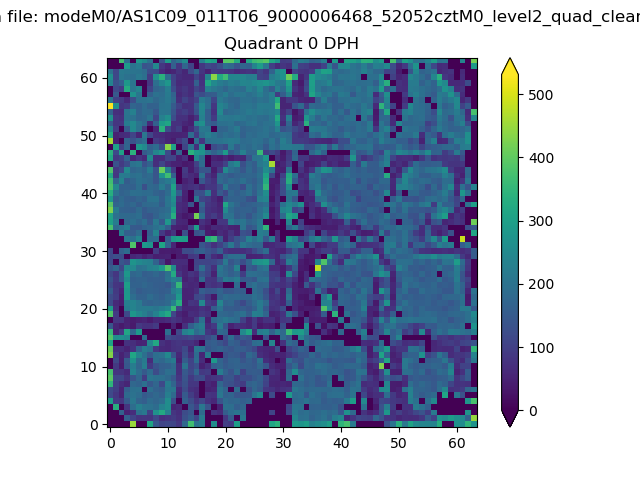 |
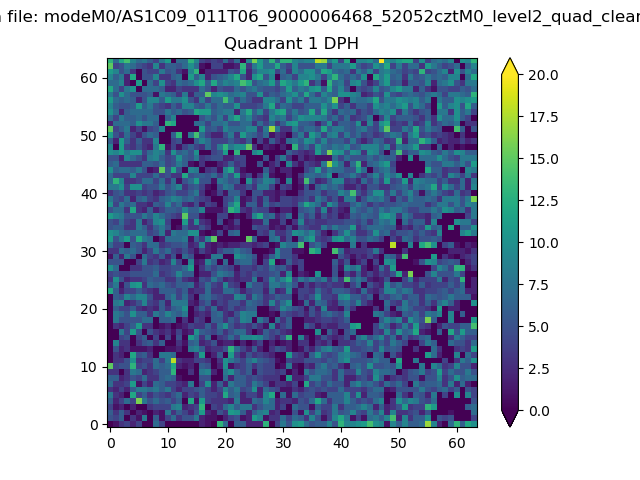 |
Quadrant B |
|---|---|---|---|
| Quadrant D | 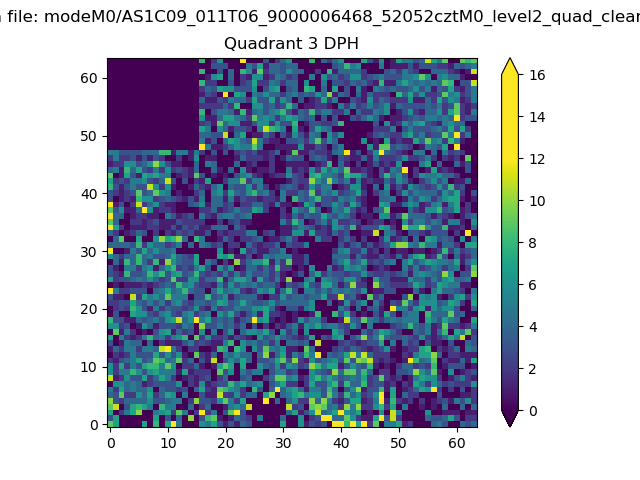 |
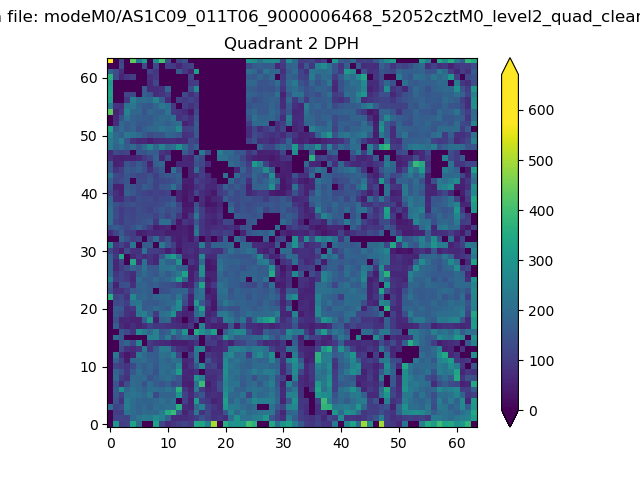 |
Quadrant C |
| Plot type | Count rate plots | Images |
|---|---|---|
| Comparison with Poisson distribution Blue bars denote a histogram of data divided into 1 sec bins. Red curve is a Poisson curve with rate = median count rate of data. |
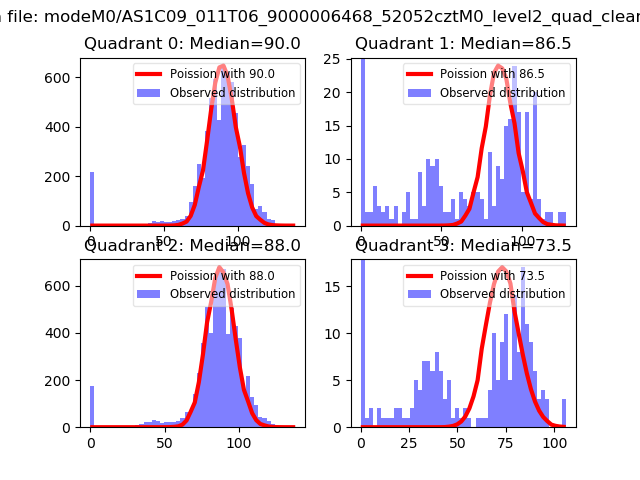 |
 |
| Quadrant-wise count rates Data is divided into 100 sec bins |
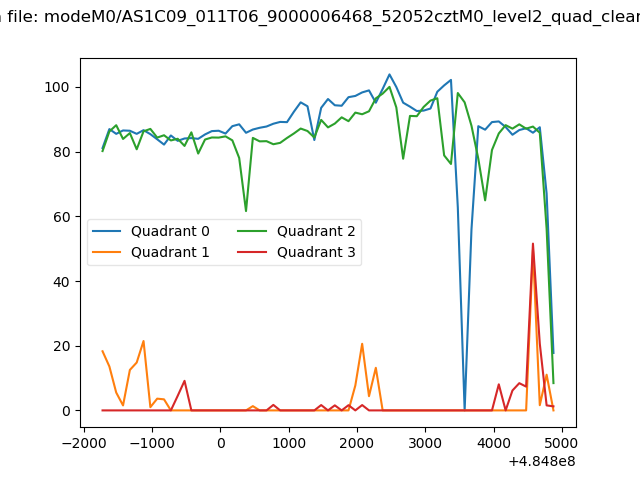 |
|
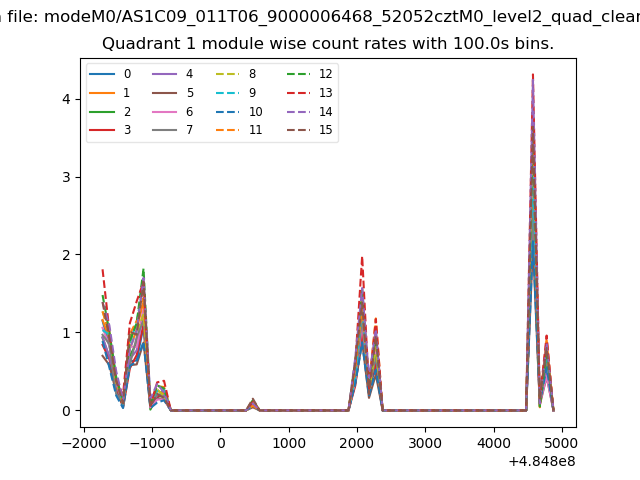
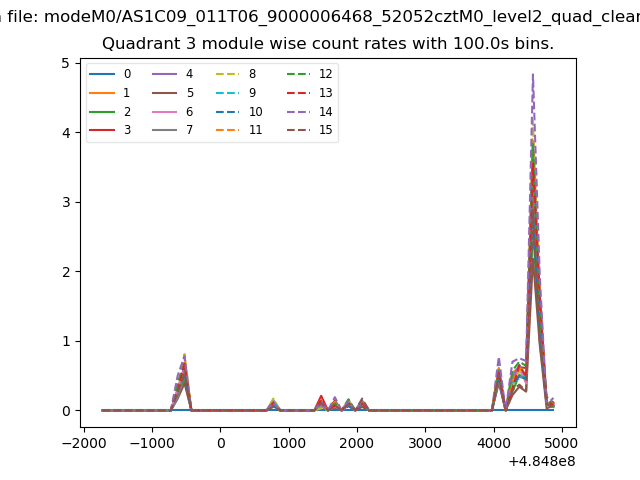
| Module-wise count rates for Quadrant A Data is divided into 100 sec bins |
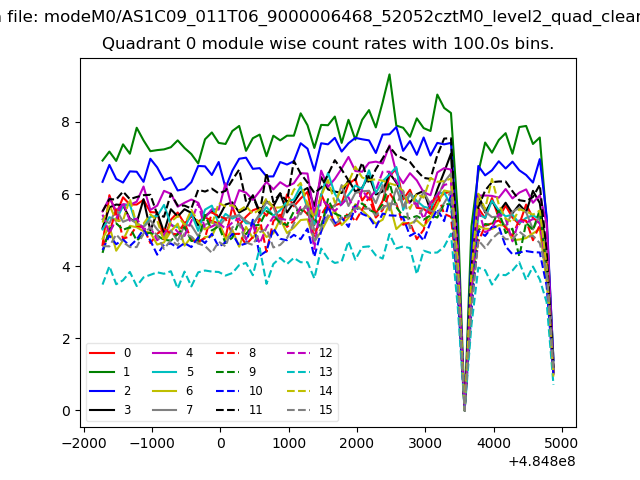 |
 |
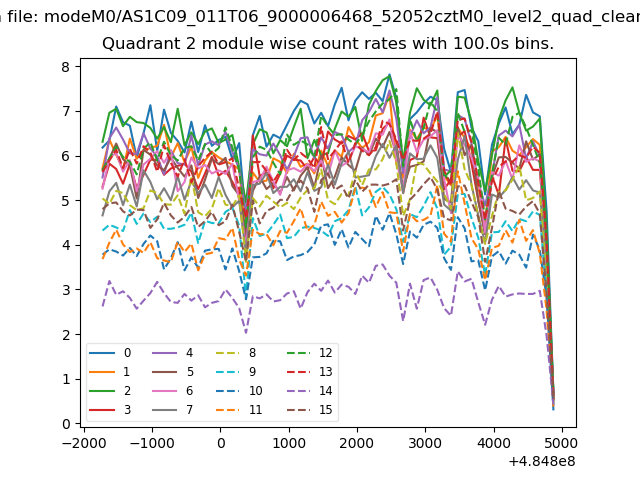
| Module-wise count rates for Quadrant B Data is divided into 100 sec bins |
 |
 |
| Module-wise count rates for Quadrant C Data is divided into 100 sec bins |
 |
 |
| Module-wise count rates for Quadrant D Data is divided into 100 sec bins |
 |
 |
| Parameter | Plot |
|---|---|
| CZT HV Monitor | 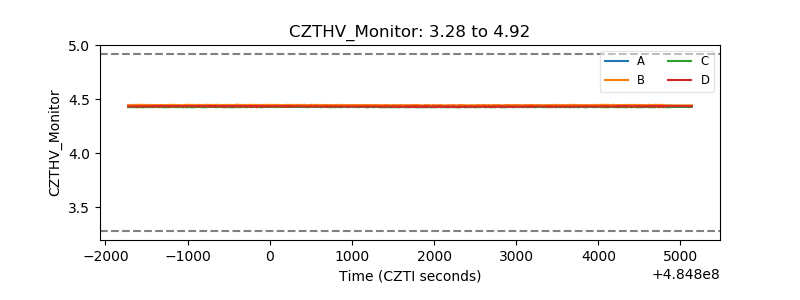 |
| D_VDD | 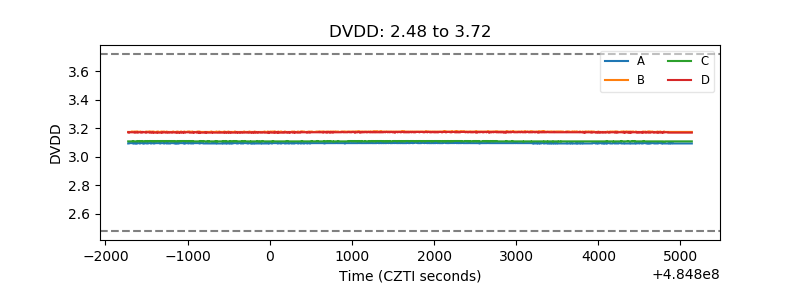 |
| Temperature 1 | 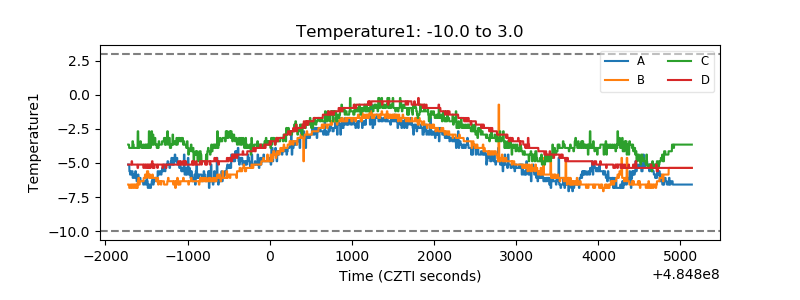 |
| Veto HV Monitor |  |
| Veto LLD | 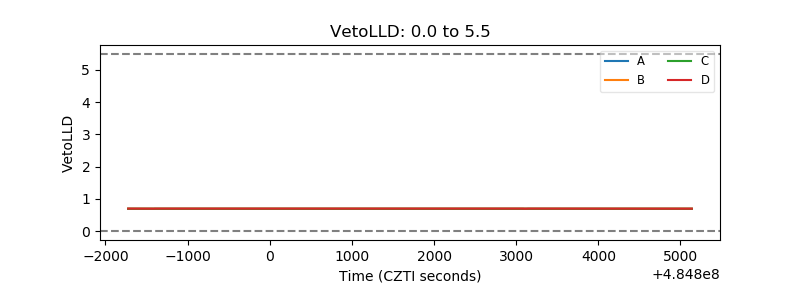 |
| Alpha Counter | 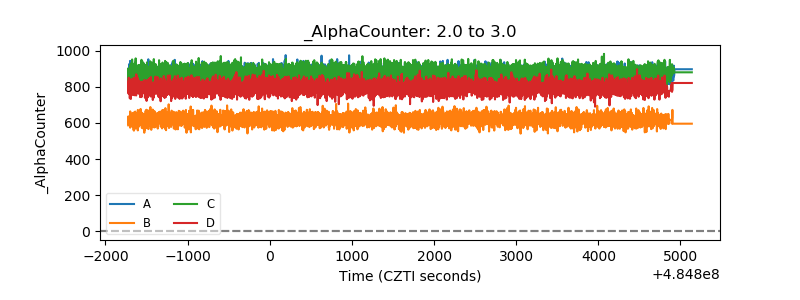 |
| _CPM_Rate | 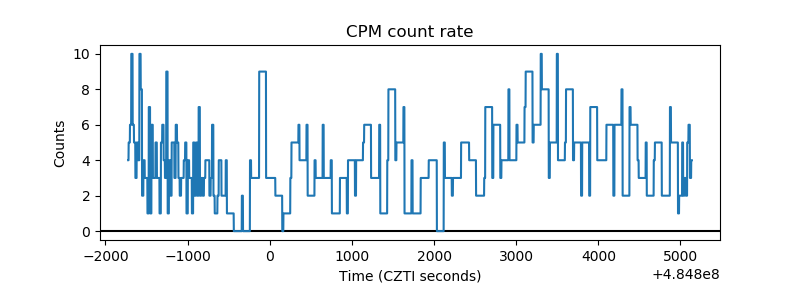 |
| CZT Counter | 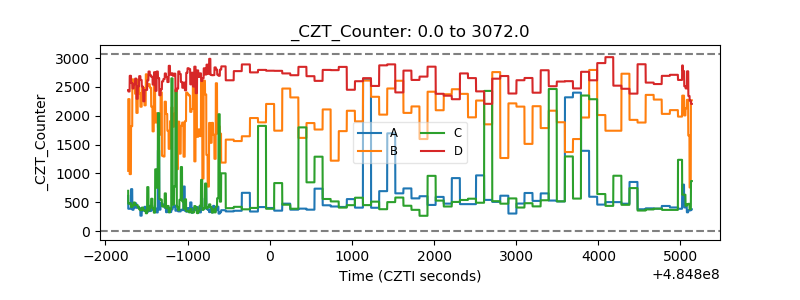 |
| +2.5 Volts monitor | 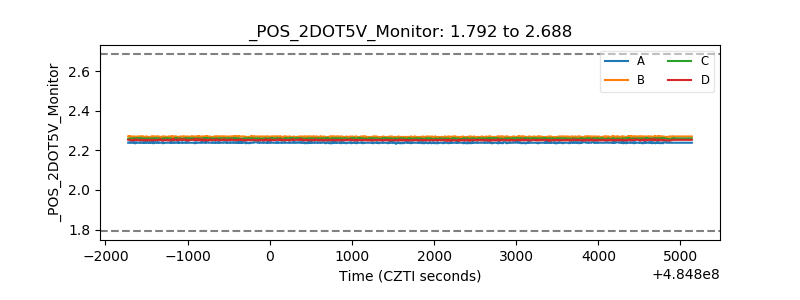 |
| +5 Volts monitor | 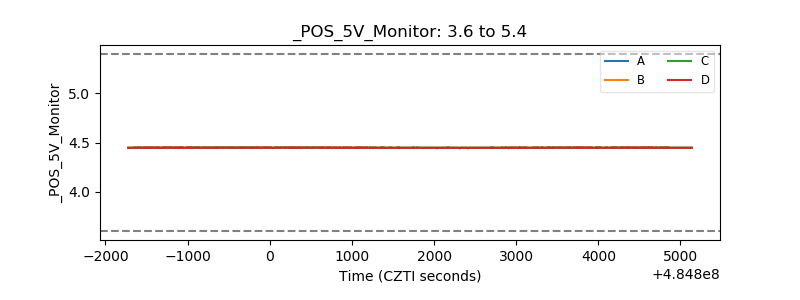 |
| _ROLL_ROT | 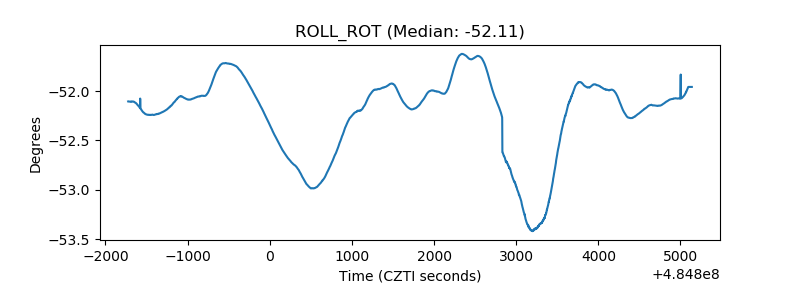 |
| _Roll_DEC | 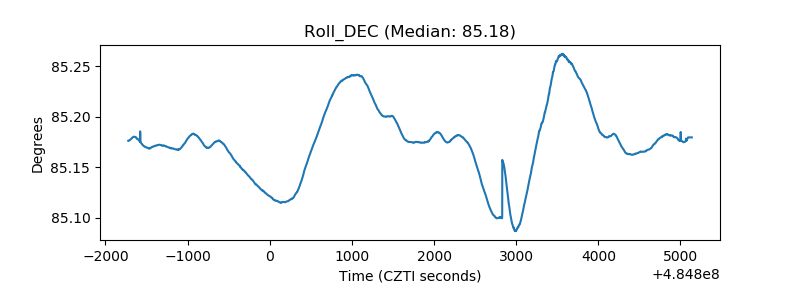 |
| _Roll_RA | 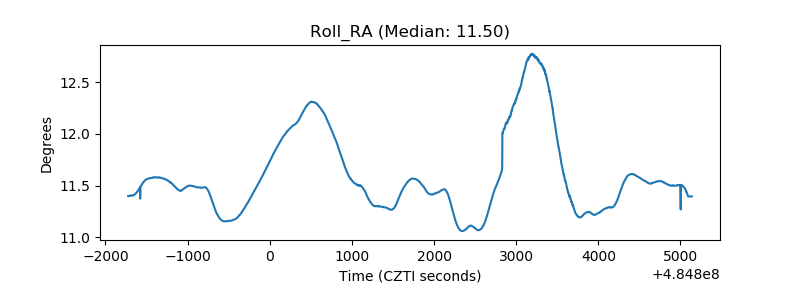 |
| Veto Counter | 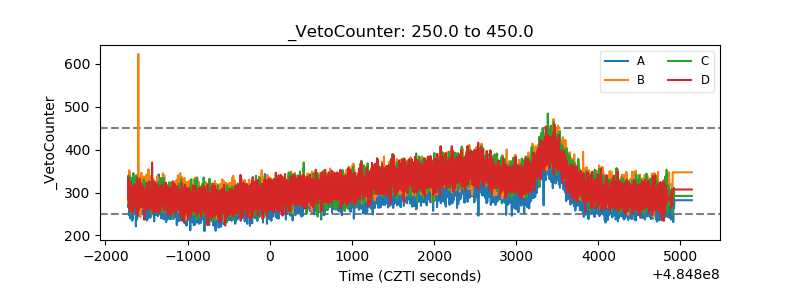 |