| Param | Original file | Final file |
|---|---|---|
| Filename | modeM0/AS1C09_011T06_9000006468_52056cztM0_level2.fits | modeM0/AS1C09_011T06_9000006468_52056cztM0_level2_quad_clean.evt |
| Size (bytes) | 761,163,840 | 69,782,400 |
| Size | 725.9 MB | 66.5 MB |
| Events in quadrant A | 3,801,770 | 550,353 |
| Events in quadrant B | 5,199,971 | 566,202 |
| Events in quadrant C | 3,551,047 | 531,146 |
| Events in quadrant D | 15,145,207 | 34,243 |
| Mode M0 | |||
|---|---|---|---|
| Quadrant | BADHDUFLAG | Total packets | Discarded packets |
| A | 0 | 17364 | 1857 |
| B | 0 | 22062 | 2171 |
| C | 0 | 17094 | 1954 |
| D | 0 | 57767 | 8717 |
| Mode M9 | |||
|---|---|---|---|
| Quadrant | BADHDUFLAG | Total packets | Discarded packets |
| A | 0 | 7 | 0 |
| B | 0 | 7 | 0 |
| C | 0 | 7 | 0 |
| D | 0 | 7 | 0 |
| Mode SS | |||
|---|---|---|---|
| Quadrant | BADHDUFLAG | Total packets | Discarded packets |
| A | 0 | 142 | 12 |
| B | 0 | 142 | 12 |
| C | 0 | 141 | 11 |
| D | 0 | 142 | 12 |
| Quadrant | Total seconds | Saturated seconds | Saturation percentage |
|---|---|---|---|
| A | 6229 | 203 | 3.258950% |
| B | 6227 | 596 | 9.571222% |
| C | 6224 | 179 | 2.875964% |
| D | 5916 | 5599 | 94.641650% |
Noise dominated data is calculated using 1-second bins in cleaned event files. If a bin has >2000 counts, and if more than 50% of those come from <1% of pixels, then it is considered to be noise-dominated and hence unusable.
| Quadrant | # 1 sec bins | Bins with >0 counts | Bins with >2000 counts | High rate bins dominated by noise | Noise dominated (total time) | Noise dominated (detector-on time) | Marked lightcurve |
|---|---|---|---|---|---|---|---|
| A | 7679 | 6405 | 102 | 102 | 1.33% | 1.59% | 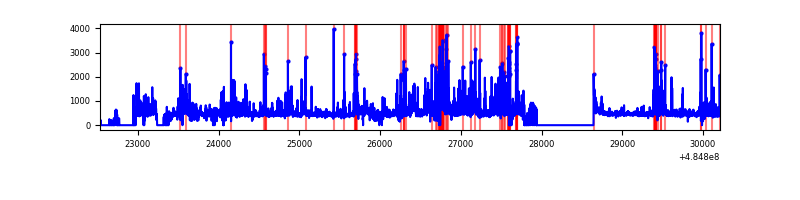 |
| B | 7678 | 6396 | 352 | 352 | 4.58% | 5.50% | 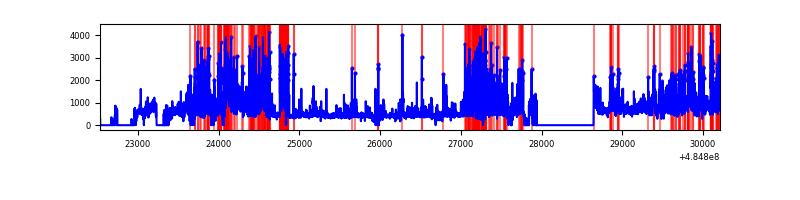 |
| C | 7575 | 6390 | 114 | 114 | 1.50% | 1.78% | 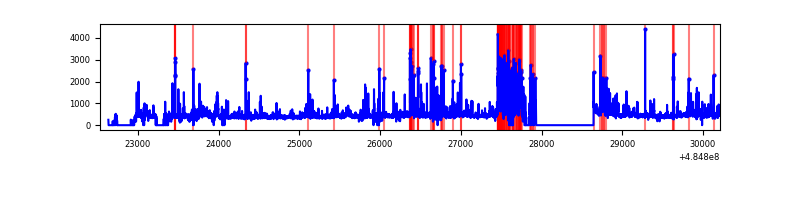 |
| D | 7246 | 6010 | 5271 | 5271 | 72.74% | 87.70% | 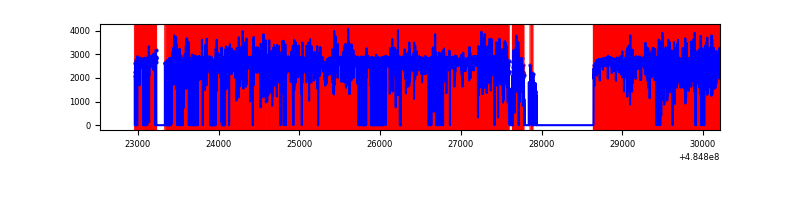 |
Top three noisy pixels from each quadrant. If the there are fewer than three noisy pixels in the level2.evt file, extra rows are filled as -1
| Pixel properties | Quadrant properties | ||||||
|---|---|---|---|---|---|---|---|
| Quadrant | DetID | PixID | Counts | Sigma | Mean | Median | Sigma |
| A | 8 | 9 | 243270 | 1508.89 | 641 | 623 | 160.8 |
| A | 3 | 14 | 231923 | 1438.33 | 641 | 623 | 160.8 |
| A | 4 | 249 | 156191 | 967.4 | 641 | 623 | 160.8 |
| B | 8 | 3 | 939303 | 7092.79 | 617 | 596 | 132.3 |
| B | 12 | 32 | 732390 | 5529.37 | 617 | 596 | 132.3 |
| B | 5 | 185 | 296226 | 2233.76 | 617 | 596 | 132.3 |
| C | 15 | 224 | 742920 | 4391.28 | 616 | 611 | 169.0 |
| C | 13 | 3 | 75664 | 443.99 | 616 | 611 | 169.0 |
| C | 12 | 252 | 59433 | 347.97 | 616 | 611 | 169.0 |
| D | 15 | 94 | 6459208 | 85673.0 | 262 | 250 | 75.4 |
| D | 6 | 42 | 4086551 | 54201.57 | 262 | 250 | 75.4 |
| D | 12 | 17 | 1737181 | 23039.02 | 262 | 250 | 75.4 |
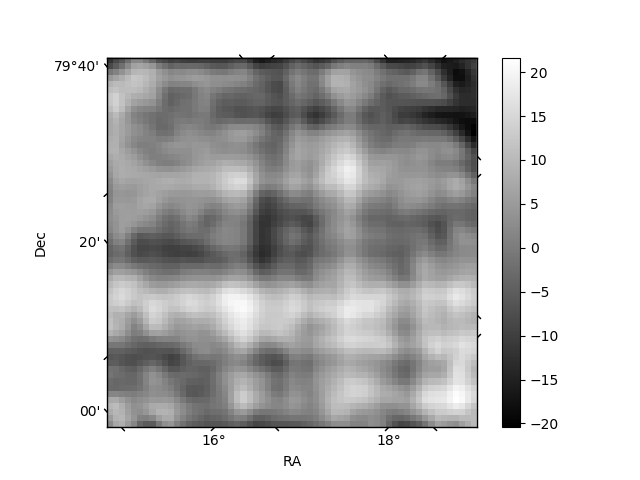
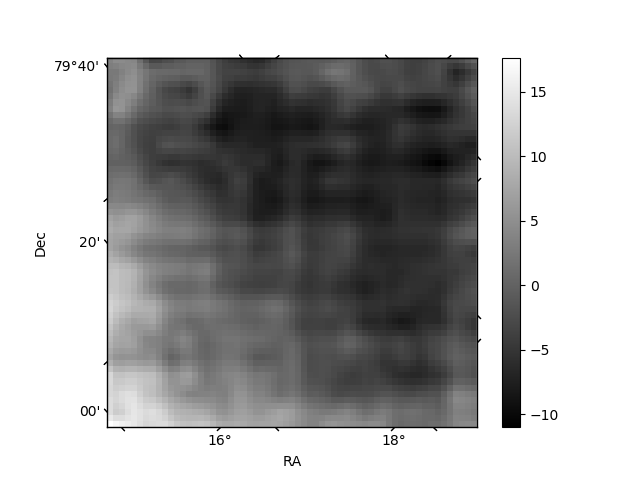
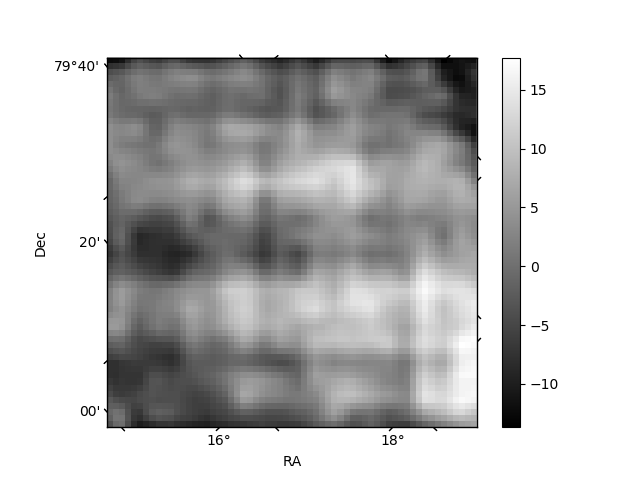
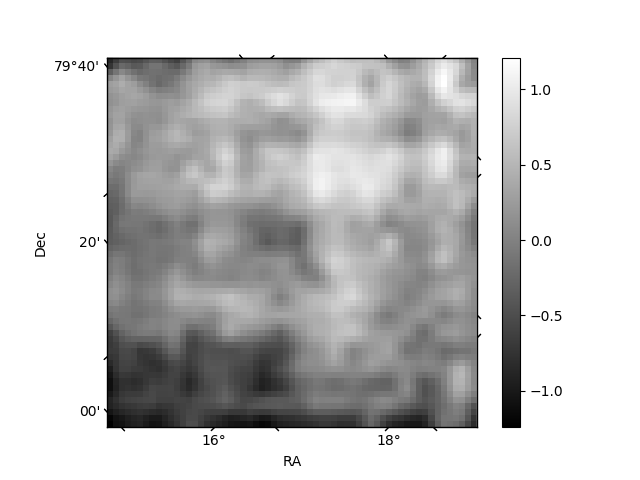
Histogram calculated using DETX and DETY for each event in the final _common_clean file
| Quadrant A | 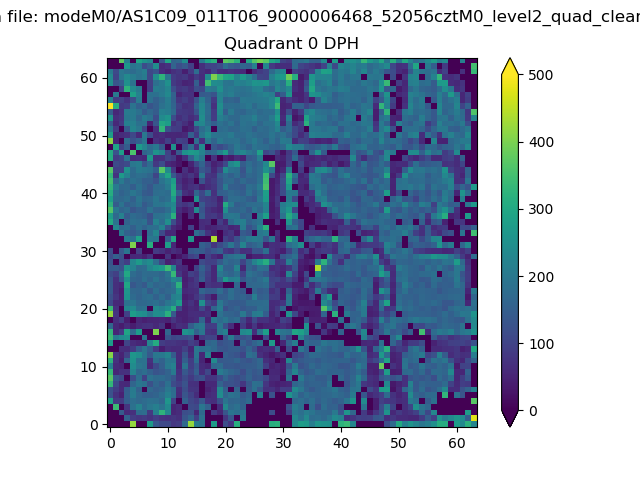 |
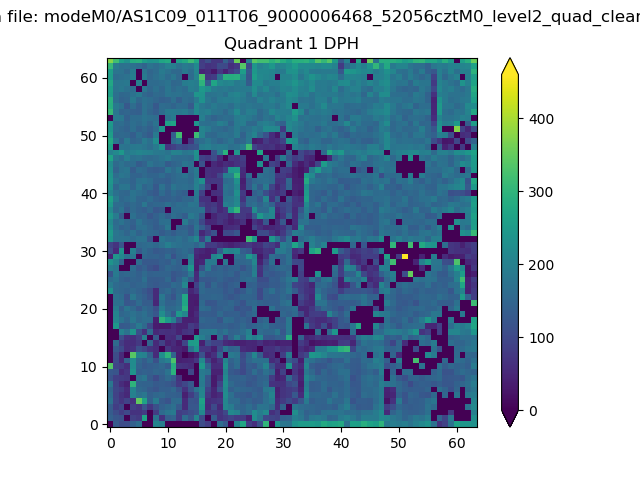 |
Quadrant B |
|---|---|---|---|
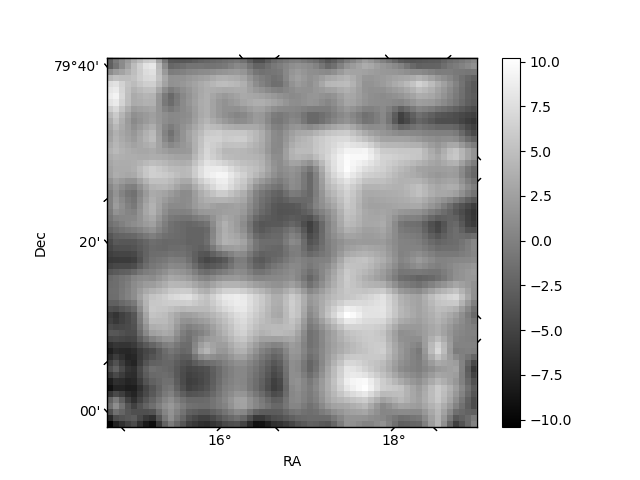
| Quadrant D |  |
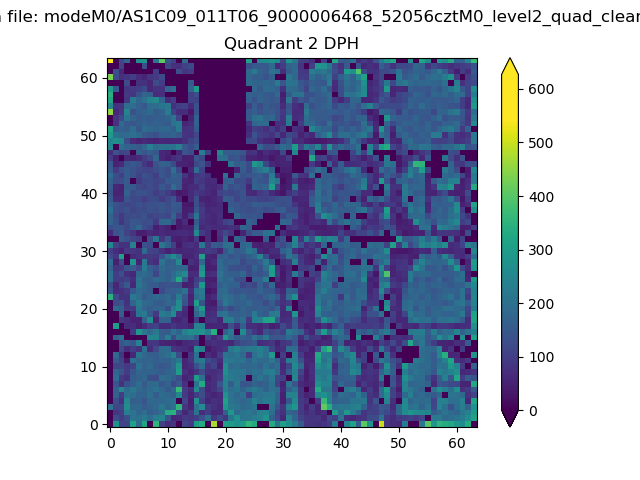 |
Quadrant C |
| Plot type | Count rate plots | Images |
|---|---|---|
| Comparison with Poisson distribution Blue bars denote a histogram of data divided into 1 sec bins. Red curve is a Poisson curve with rate = median count rate of data. |
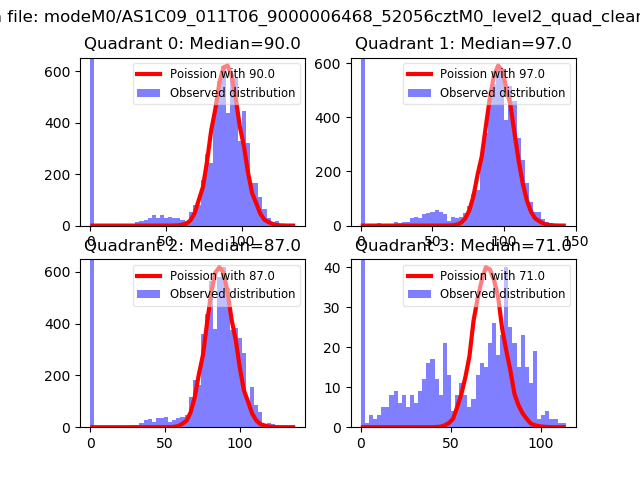 |
 |
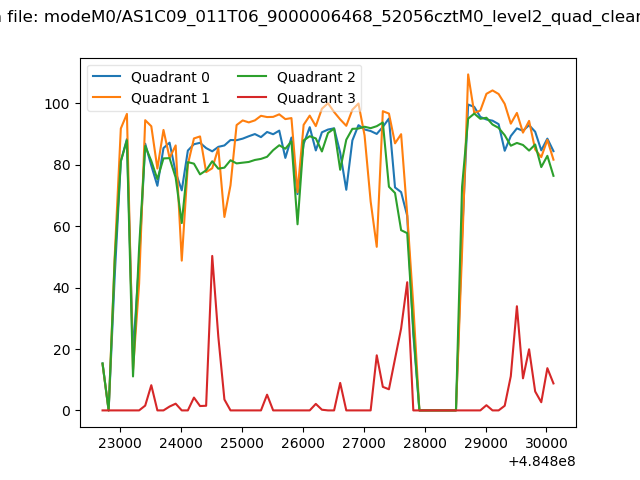
| Quadrant-wise count rates Data is divided into 100 sec bins |
 |
|
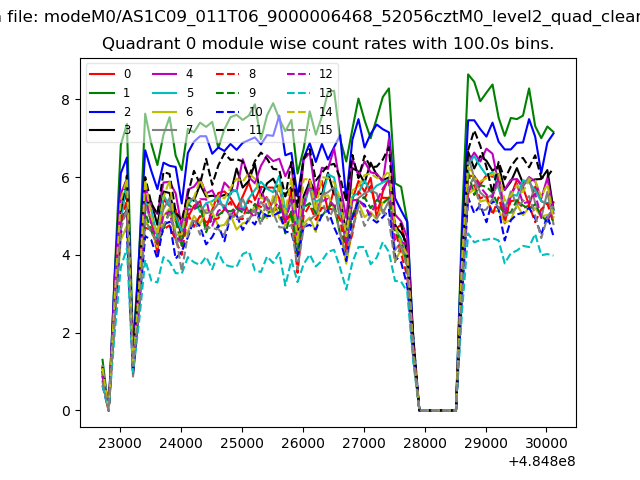
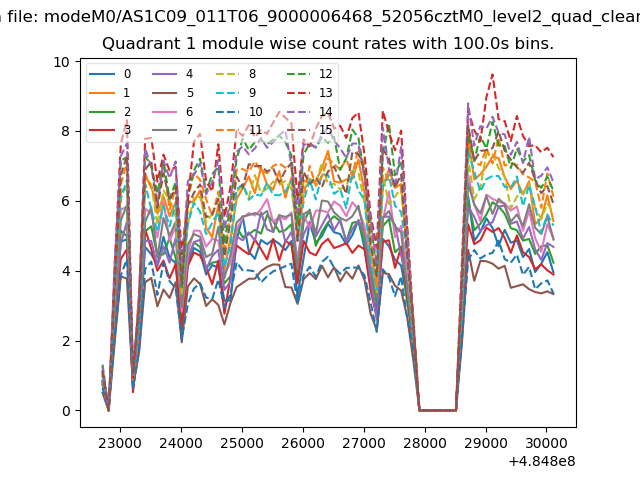
| Module-wise count rates for Quadrant A Data is divided into 100 sec bins |
 |
 |
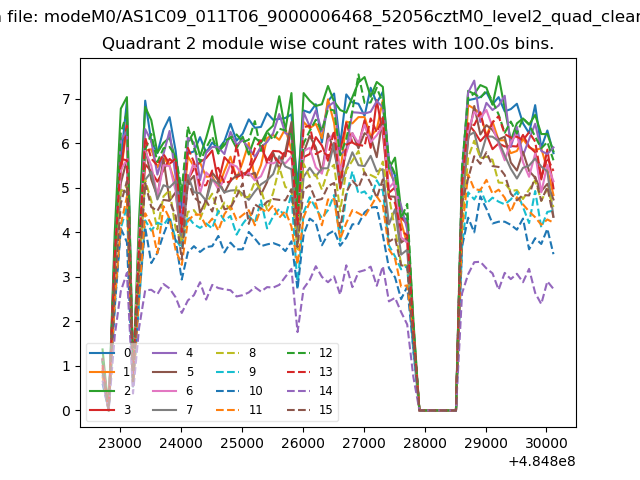
| Module-wise count rates for Quadrant B Data is divided into 100 sec bins |
 |
 |
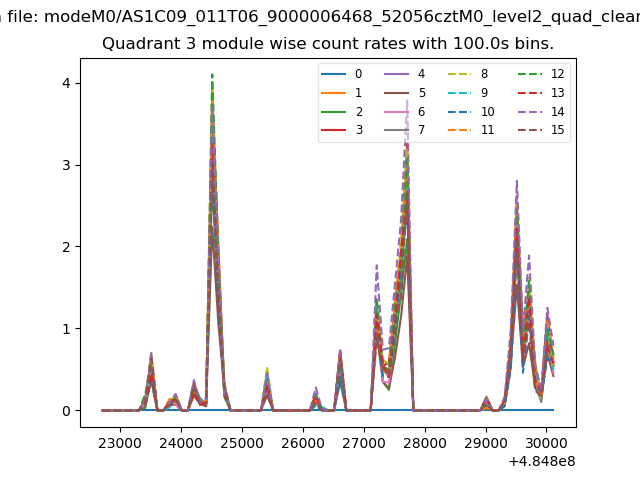
| Module-wise count rates for Quadrant C Data is divided into 100 sec bins |
 |
 |
| Module-wise count rates for Quadrant D Data is divided into 100 sec bins |
 |
 |
| Parameter | Plot |
|---|---|
| CZT HV Monitor | 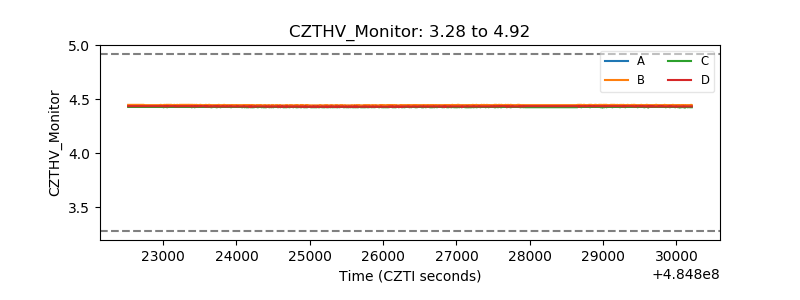 |
| D_VDD | 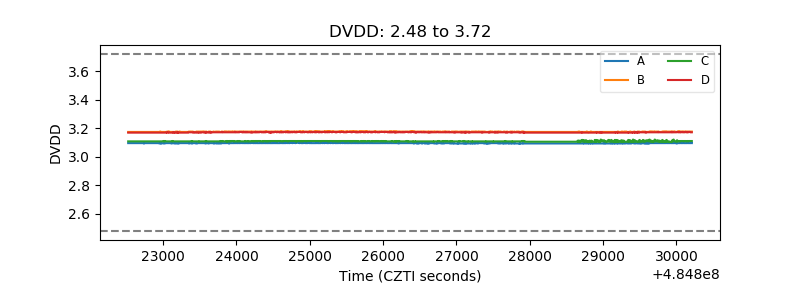 |
| Temperature 1 | 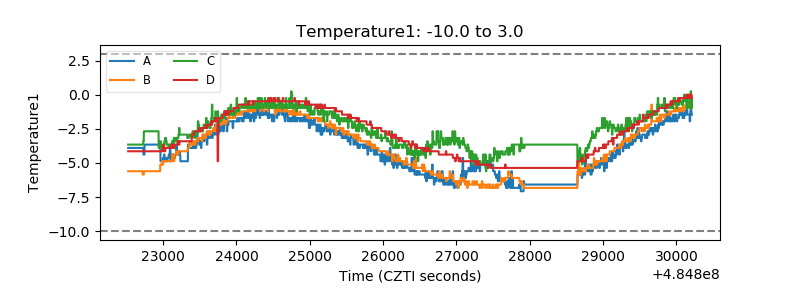 |
| Veto HV Monitor | 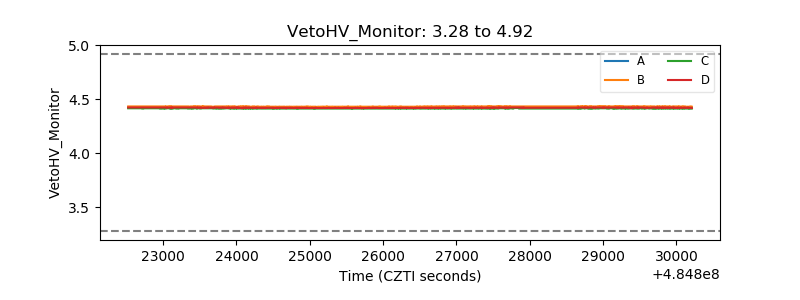 |
| Veto LLD | 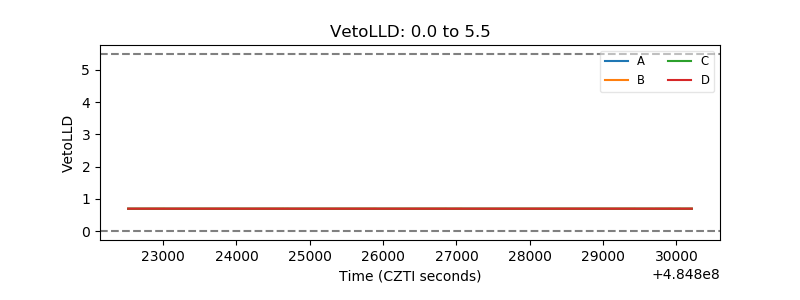 |
| Alpha Counter | 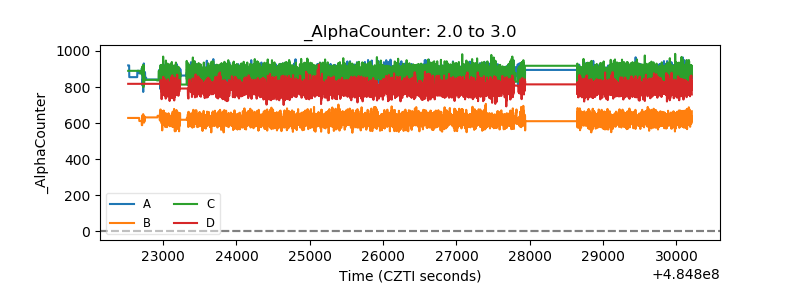 |
| _CPM_Rate | 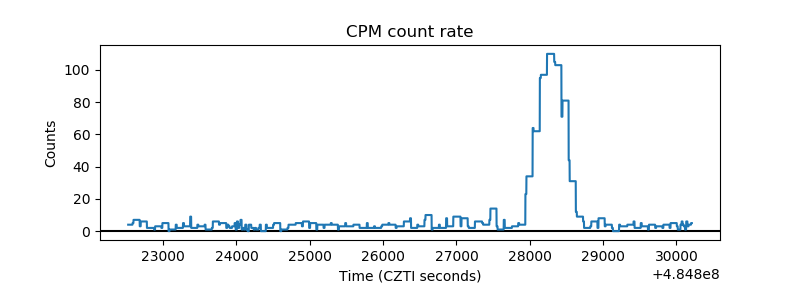 |
| CZT Counter | 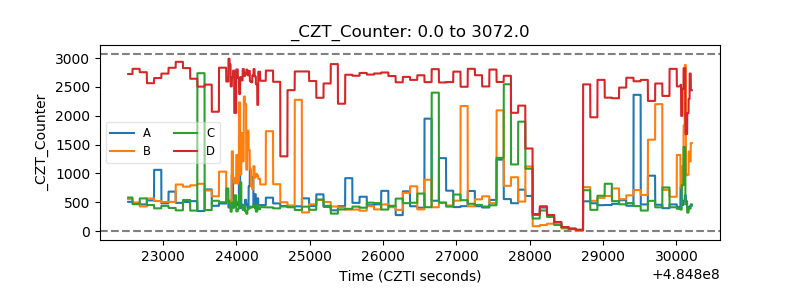 |
| +2.5 Volts monitor | 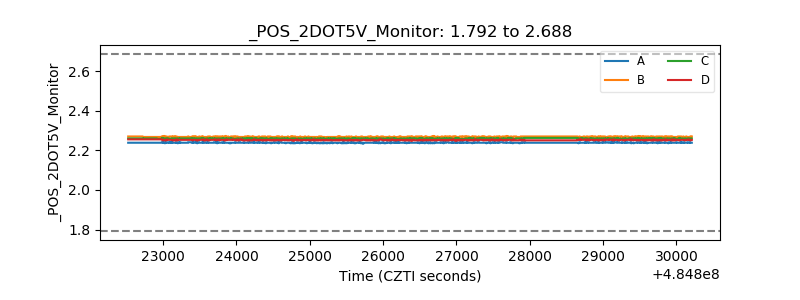 |
| +5 Volts monitor | 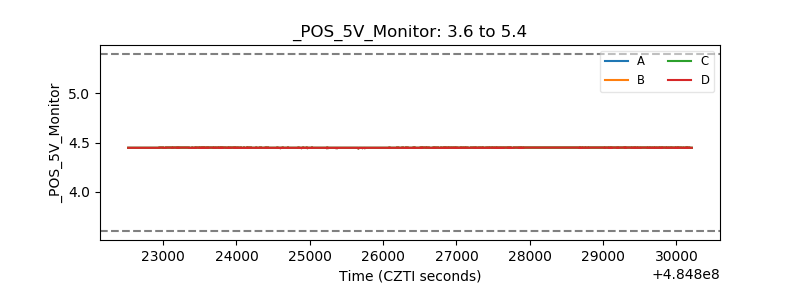 |
| _ROLL_ROT | 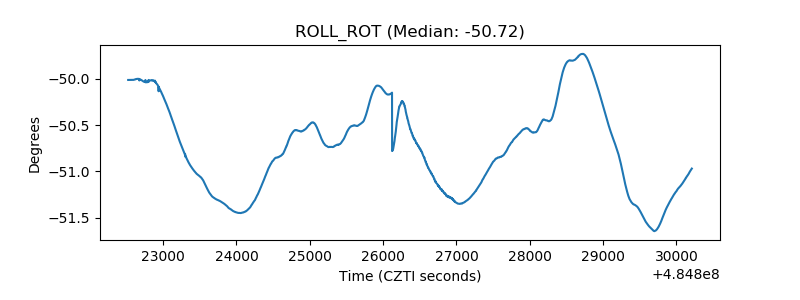 |
| _Roll_DEC | 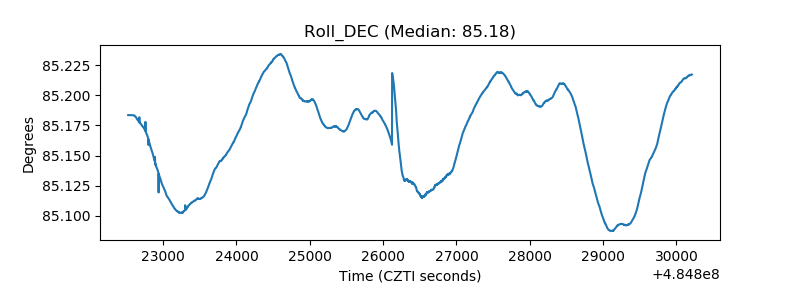 |
| _Roll_RA | 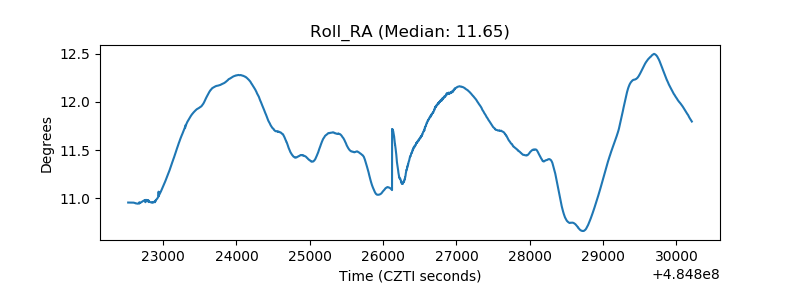 |
| Veto Counter | 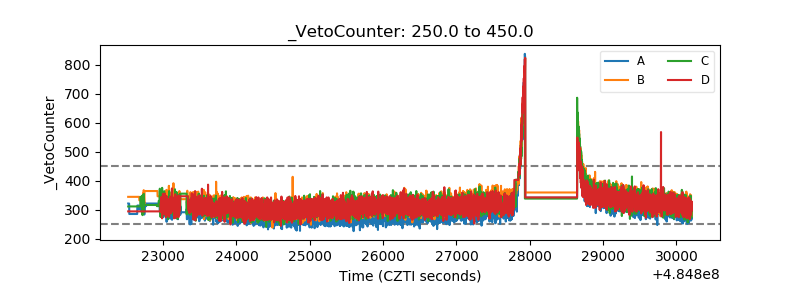 |