| Param | Original file | Final file |
|---|---|---|
| Filename | modeM0/AS1C09_011T06_9000006468_52057cztM0_level2.fits | modeM0/AS1C09_011T06_9000006468_52057cztM0_level2_quad_clean.evt |
| Size (bytes) | 4,166,360,640 | 294,583,680 |
| Size | 3.9 GB | 280.9 MB |
| Events in quadrant A | 17,104,860 | 2,597,771 |
| Events in quadrant B | 40,592,613 | 1,646,438 |
| Events in quadrant C | 21,806,716 | 2,387,616 |
| Events in quadrant D | 72,492,135 | 294,785 |
| Mode M0 | |||
|---|---|---|---|
| Quadrant | BADHDUFLAG | Total packets | Discarded packets |
| A | 0 | 70598 | 5 |
| B | 0 | 140757 | 5 |
| C | 0 | 85629 | 5 |
| D | 0 | 235180 | 5 |
| Mode M9 | |||
|---|---|---|---|
| Quadrant | BADHDUFLAG | Total packets | Discarded packets |
| A | 0 | 24 | 0 |
| B | 0 | 24 | 0 |
| C | 0 | 24 | 0 |
| D | 0 | 24 | 0 |
| Mode SS | |||
|---|---|---|---|
| Quadrant | BADHDUFLAG | Total packets | Discarded packets |
| A | 0 | 588 | 0 |
| B | 0 | 588 | 0 |
| C | 0 | 588 | 0 |
| D | 0 | 588 | 0 |
| Quadrant | Total seconds | Saturated seconds | Saturation percentage |
|---|---|---|---|
| A | 28947 | 871 | 3.008947% |
| B | 28948 | 11648 | 40.237668% |
| C | 28948 | 2497 | 8.625812% |
| D | 28948 | 26056 | 90.009673% |
Noise dominated data is calculated using 1-second bins in cleaned event files. If a bin has >2000 counts, and if more than 50% of those come from <1% of pixels, then it is considered to be noise-dominated and hence unusable.
| Quadrant | # 1 sec bins | Bins with >0 counts | Bins with >2000 counts | High rate bins dominated by noise | Noise dominated (total time) | Noise dominated (detector-on time) | Marked lightcurve |
|---|---|---|---|---|---|---|---|
| A | 31757 | 28951 | 424 | 424 | 1.34% | 1.46% | 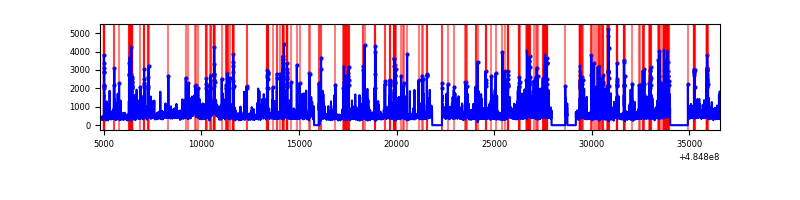 |
| B | 31758 | 28953 | 9152 | 9152 | 28.82% | 31.61% | 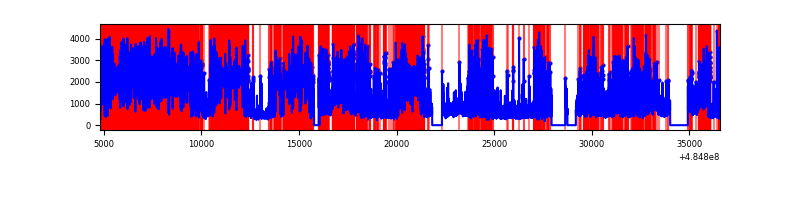 |
| C | 31758 | 28954 | 1947 | 1947 | 6.13% | 6.72% | 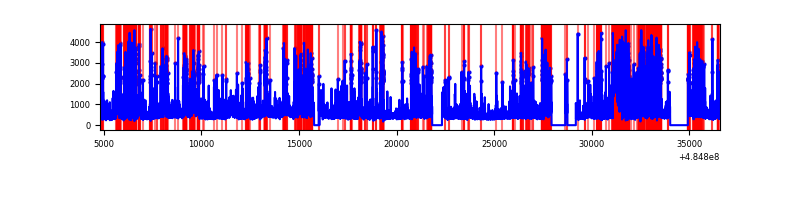 |
| D | 31757 | 28947 | 24869 | 24869 | 78.31% | 85.91% | 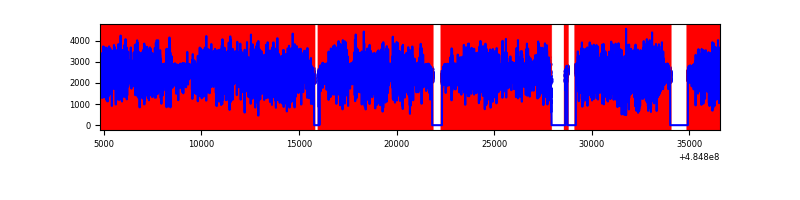 |
Top three noisy pixels from each quadrant. If the there are fewer than three noisy pixels in the level2.evt file, extra rows are filled as -1
| Pixel properties | Quadrant properties | ||||||
|---|---|---|---|---|---|---|---|
| Quadrant | DetID | PixID | Counts | Sigma | Mean | Median | Sigma |
| A | 4 | 249 | 587192 | 787.09 | 2987 | 2918 | 742.3 |
| A | 4 | 3 | 560667 | 751.36 | 2987 | 2918 | 742.3 |
| A | 15 | 174 | 551318 | 738.76 | 2987 | 2918 | 742.3 |
| B | 8 | 3 | 16753479 | 34834.95 | 2273 | 2196 | 480.9 |
| B | 12 | 32 | 10184183 | 21173.84 | 2273 | 2196 | 480.9 |
| B | 10 | 254 | 1459743 | 3031.02 | 2273 | 2196 | 480.9 |
| C | 15 | 224 | 6820445 | 8674.01 | 2826 | 2799 | 786.0 |
| C | 13 | 3 | 568534 | 719.78 | 2826 | 2799 | 786.0 |
| C | 9 | 38 | 507257 | 641.82 | 2826 | 2799 | 786.0 |
| D | 15 | 94 | 40186518 | 94253.23 | 1389 | 1319 | 426.4 |
| D | 6 | 42 | 8588605 | 20141.23 | 1389 | 1319 | 426.4 |
| D | 12 | 17 | 8502596 | 19939.5 | 1389 | 1319 | 426.4 |
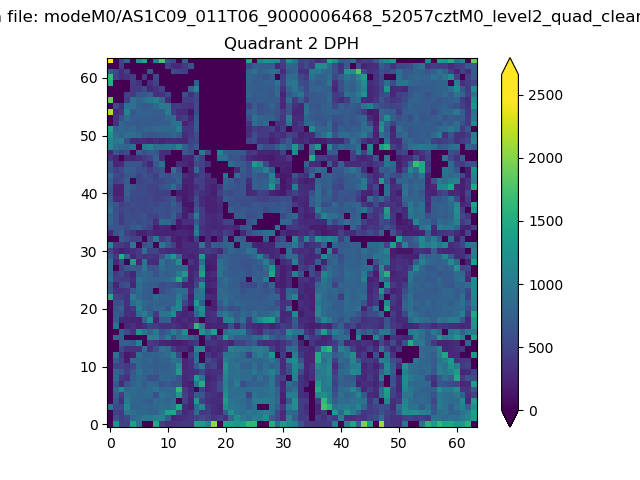
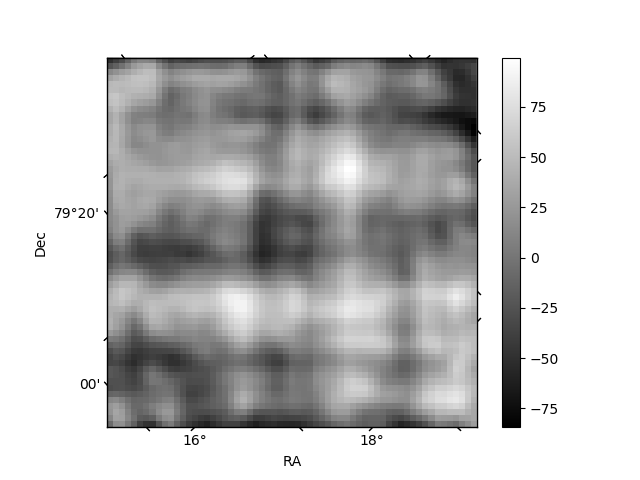
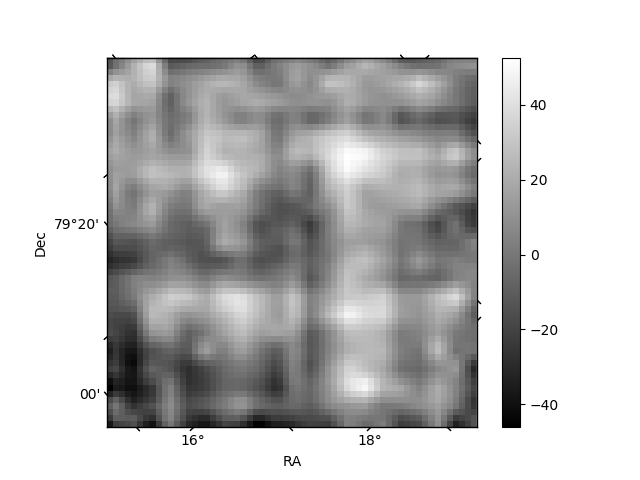
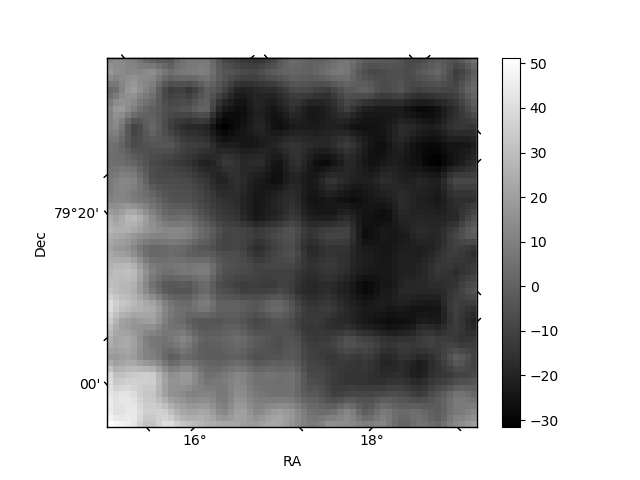
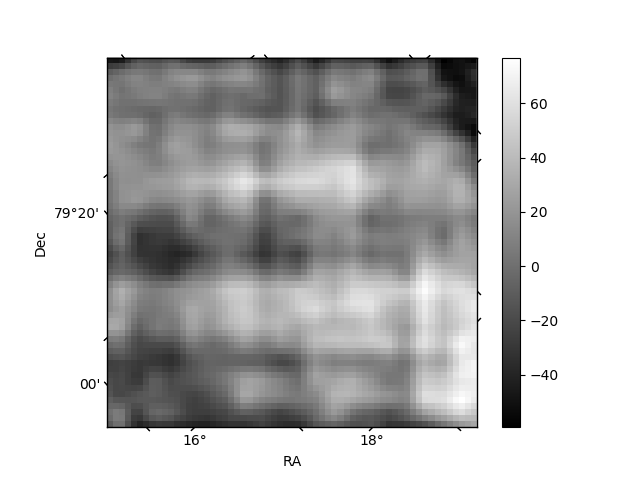
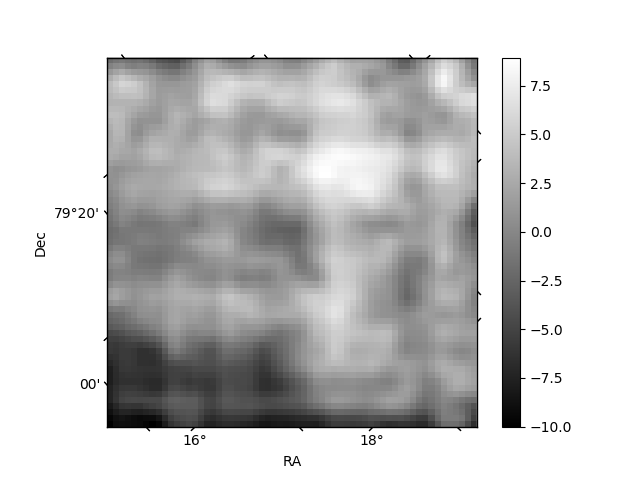
Histogram calculated using DETX and DETY for each event in the final _common_clean file
| Quadrant A | 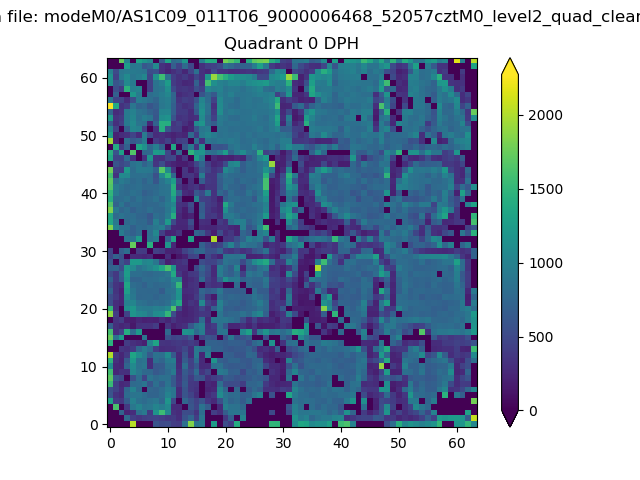 |
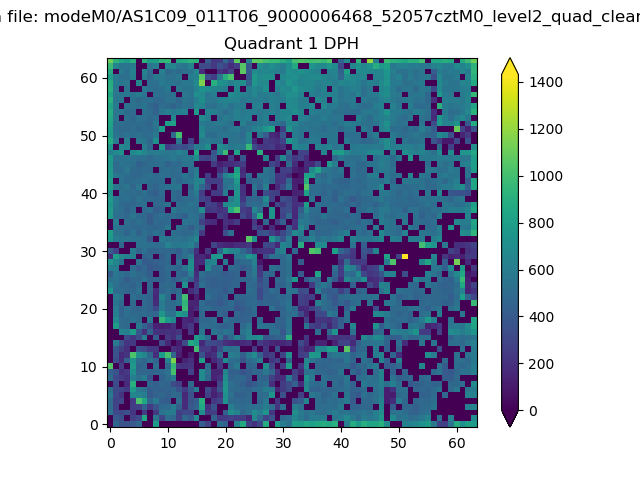 |
Quadrant B |
|---|---|---|---|
| Quadrant D | 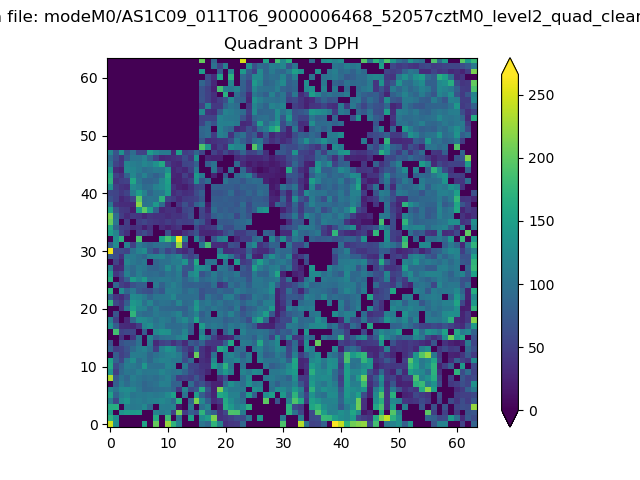 |
 |
Quadrant C |
| Plot type | Count rate plots | Images |
|---|---|---|
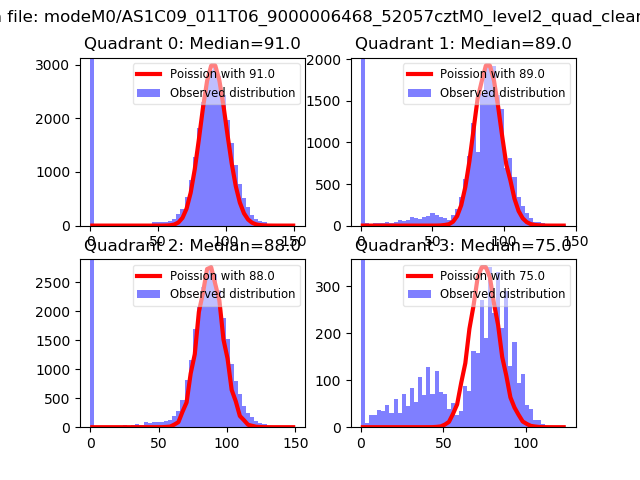
| Comparison with Poisson distribution Blue bars denote a histogram of data divided into 1 sec bins. Red curve is a Poisson curve with rate = median count rate of data. |
 |
 |
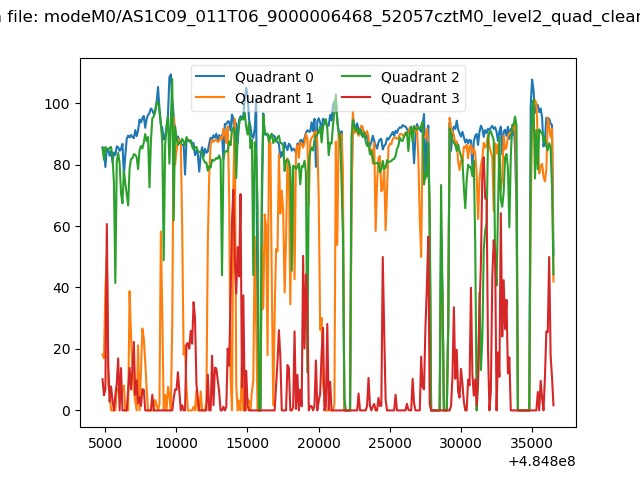
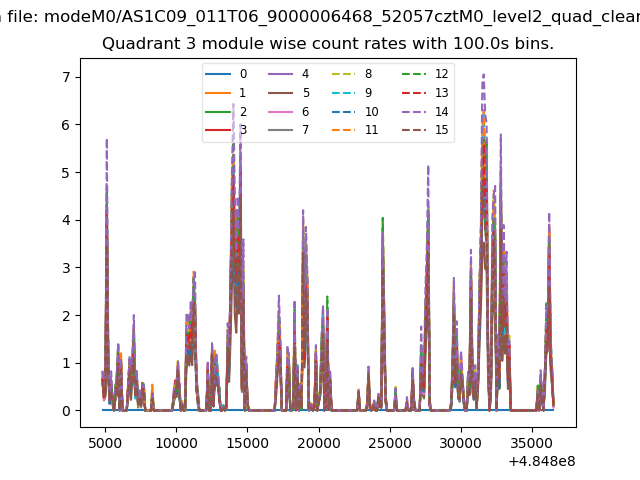
| Quadrant-wise count rates Data is divided into 100 sec bins |
 |
|
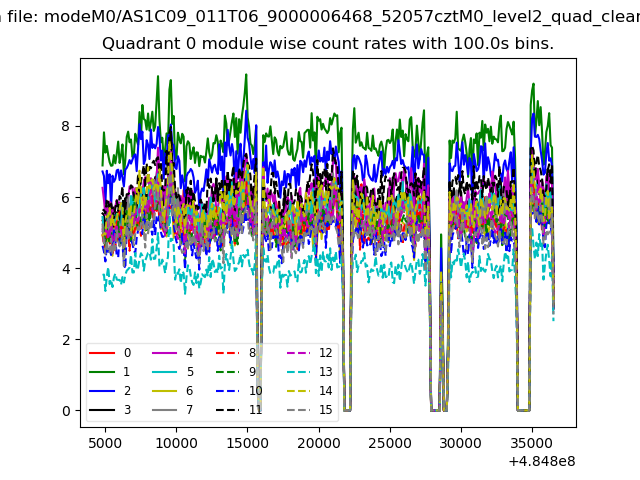
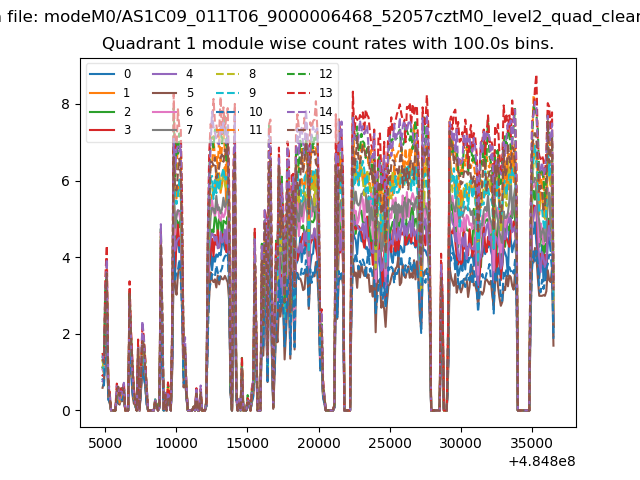
| Module-wise count rates for Quadrant A Data is divided into 100 sec bins |
 |
 |
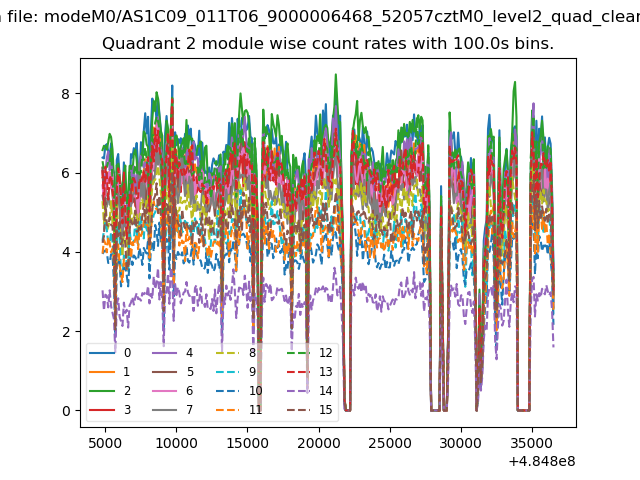
| Module-wise count rates for Quadrant B Data is divided into 100 sec bins |
 |
 |
| Module-wise count rates for Quadrant C Data is divided into 100 sec bins |
 |
 |
| Module-wise count rates for Quadrant D Data is divided into 100 sec bins |
 |
 |
| Parameter | Plot |
|---|---|
| CZT HV Monitor |  |
| D_VDD | 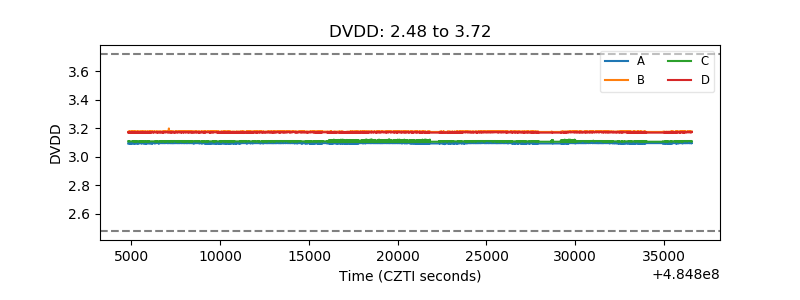 |
| Temperature 1 | 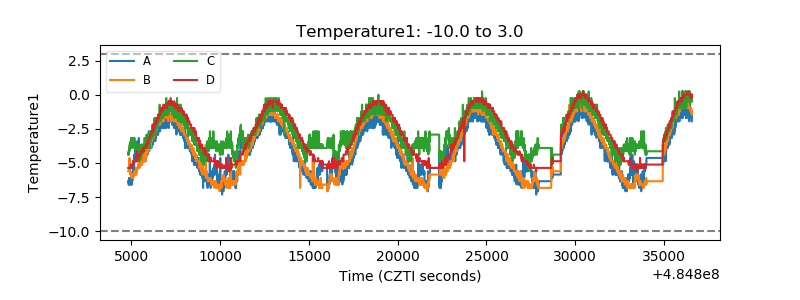 |
| Veto HV Monitor | 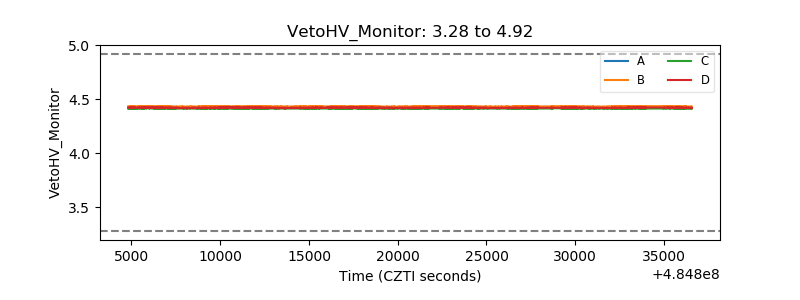 |
| Veto LLD | 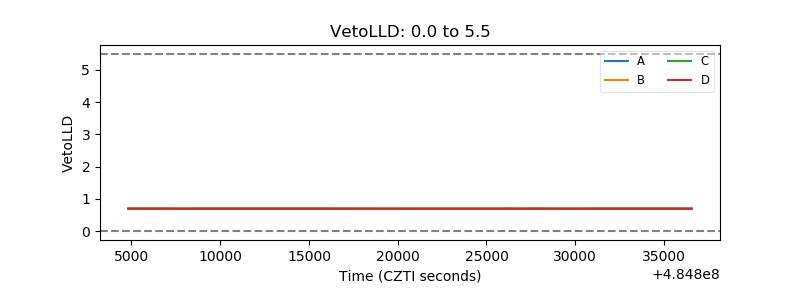 |
| Alpha Counter | 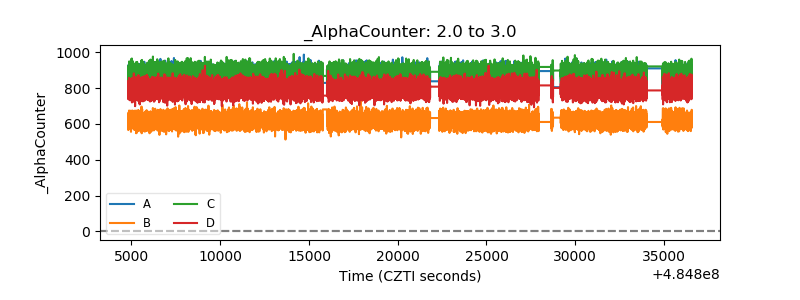 |
| _CPM_Rate | 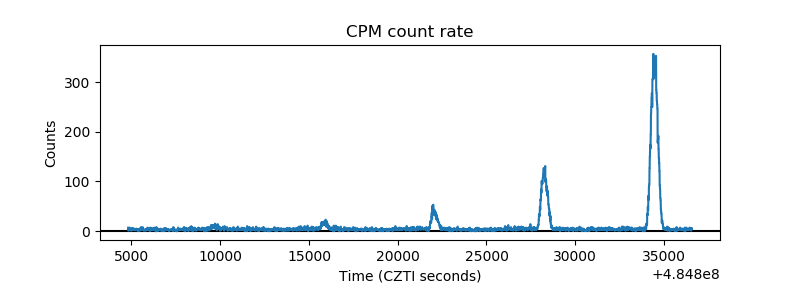 |
| CZT Counter | 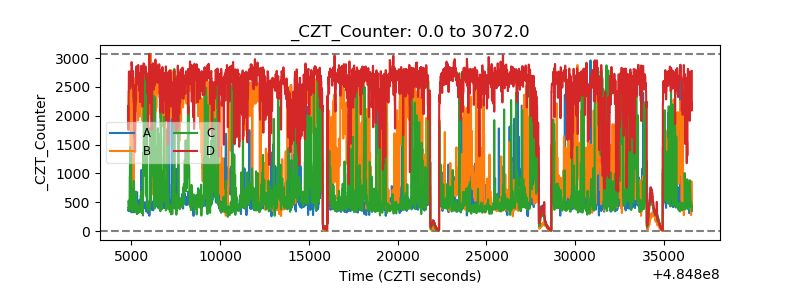 |
| +2.5 Volts monitor | 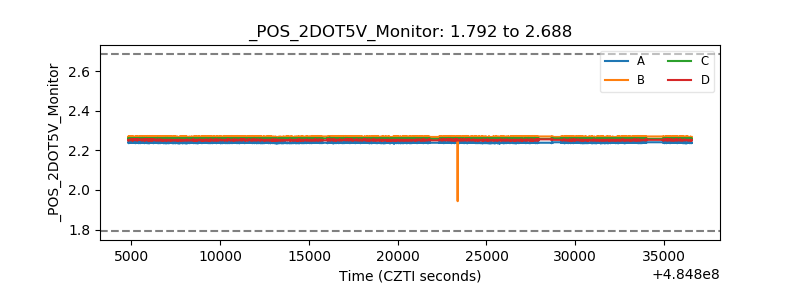 |
| +5 Volts monitor | 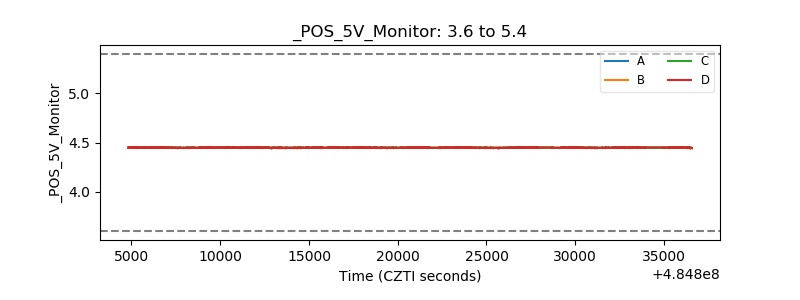 |
| _ROLL_ROT | 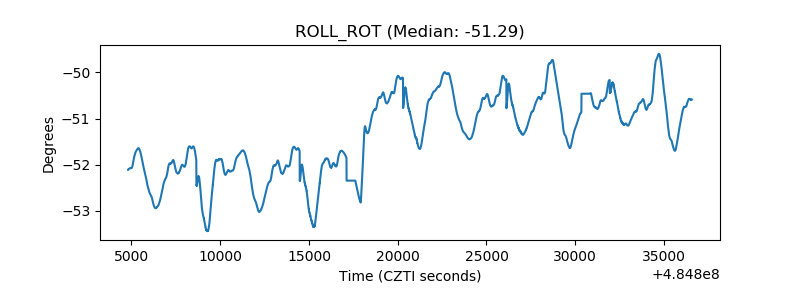 |
| _Roll_DEC | 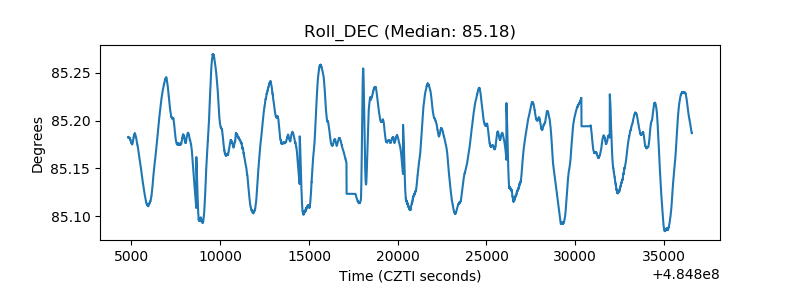 |
| _Roll_RA | 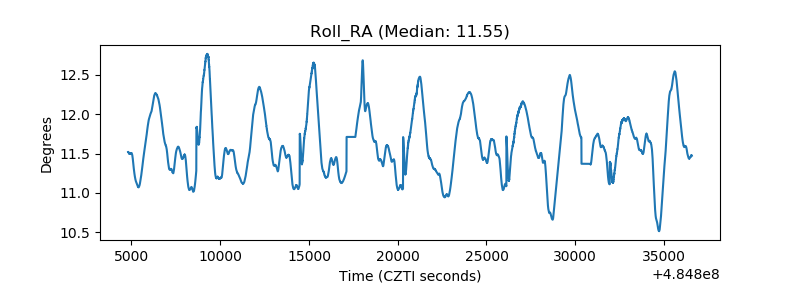 |
| Veto Counter | 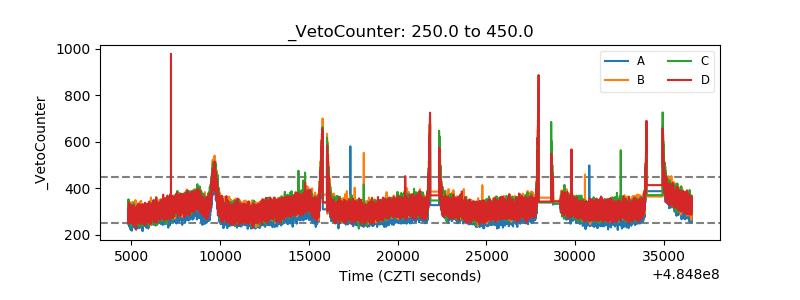 |