| Param | Original file | Final file |
|---|---|---|
| Filename | modeM0/AS1C09_011T06_9000006468_52059cztM0_level2.fits | modeM0/AS1C09_011T06_9000006468_52059cztM0_level2_quad_clean.evt |
| Size (bytes) | 795,916,800 | 67,872,960 |
| Size | 759.0 MB | 64.7 MB |
| Events in quadrant A | 3,646,387 | 552,706 |
| Events in quadrant B | 6,045,128 | 519,974 |
| Events in quadrant C | 3,903,172 | 527,747 |
| Events in quadrant D | 15,402,411 | 35,141 |
| Mode M0 | |||
|---|---|---|---|
| Quadrant | BADHDUFLAG | Total packets | Discarded packets |
| A | 0 | 14910 | 1 |
| B | 0 | 22106 | 1 |
| C | 0 | 15885 | 1 |
| D | 0 | 49855 | 1 |
| Mode M9 | |||
|---|---|---|---|
| Quadrant | BADHDUFLAG | Total packets | Discarded packets |
| A | 0 | 10 | 0 |
| B | 0 | 10 | 0 |
| C | 0 | 10 | 0 |
| D | 0 | 10 | 0 |
| Mode SS | |||
|---|---|---|---|
| Quadrant | BADHDUFLAG | Total packets | Discarded packets |
| A | 0 | 124 | 0 |
| B | 0 | 124 | 0 |
| C | 0 | 124 | 0 |
| D | 0 | 124 | 0 |
| Quadrant | Total seconds | Saturated seconds | Saturation percentage |
|---|---|---|---|
| A | 5994 | 249 | 4.154154% |
| B | 5994 | 1048 | 17.484151% |
| C | 5995 | 284 | 4.737281% |
| D | 5995 | 5659 | 94.395329% |
Noise dominated data is calculated using 1-second bins in cleaned event files. If a bin has >2000 counts, and if more than 50% of those come from <1% of pixels, then it is considered to be noise-dominated and hence unusable.
| Quadrant | # 1 sec bins | Bins with >0 counts | Bins with >2000 counts | High rate bins dominated by noise | Noise dominated (total time) | Noise dominated (detector-on time) | Marked lightcurve |
|---|---|---|---|---|---|---|---|
| A | 7024 | 5994 | 129 | 129 | 1.84% | 2.15% | 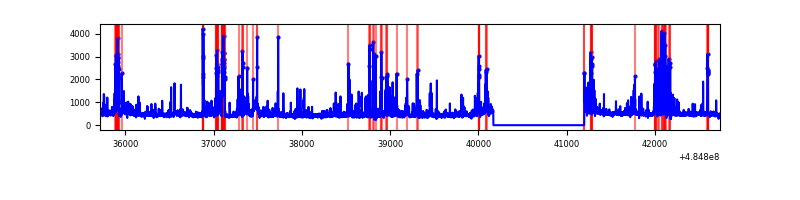 |
| B | 7024 | 5994 | 740 | 740 | 10.54% | 12.35% | 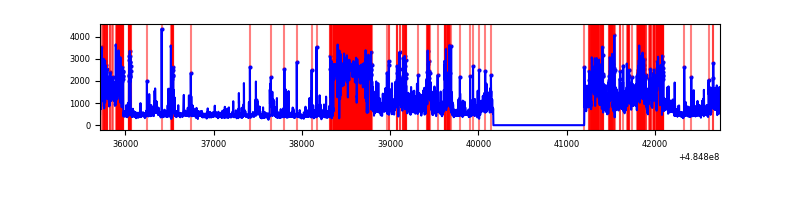 |
| C | 7025 | 5996 | 189 | 189 | 2.69% | 3.15% | 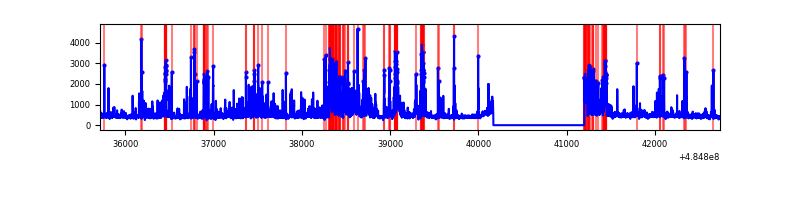 |
| D | 7025 | 5995 | 5445 | 5445 | 77.51% | 90.83% | 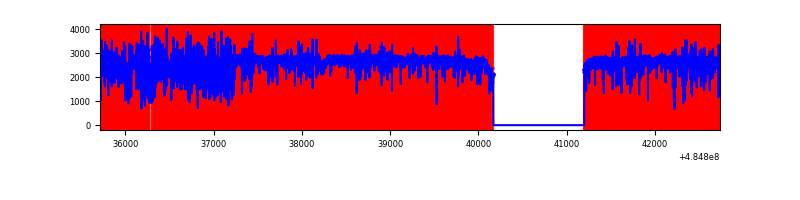 |
Top three noisy pixels from each quadrant. If the there are fewer than three noisy pixels in the level2.evt file, extra rows are filled as -1
| Pixel properties | Quadrant properties | ||||||
|---|---|---|---|---|---|---|---|
| Quadrant | DetID | PixID | Counts | Sigma | Mean | Median | Sigma |
| A | 8 | 249 | 191524 | 1243.25 | 618 | 604 | 153.6 |
| A | 4 | 249 | 188647 | 1224.51 | 618 | 604 | 153.6 |
| A | 3 | 79 | 117343 | 760.19 | 618 | 604 | 153.6 |
| B | 8 | 3 | 2583744 | 21075.07 | 575 | 557 | 122.6 |
| B | 8 | 128 | 360865 | 2939.59 | 575 | 557 | 122.6 |
| B | 0 | 171 | 143934 | 1169.75 | 575 | 557 | 122.6 |
| C | 15 | 224 | 861348 | 5230.58 | 600 | 593 | 164.6 |
| C | 3 | 233 | 85610 | 516.62 | 600 | 593 | 164.6 |
| C | 13 | 3 | 85084 | 513.43 | 600 | 593 | 164.6 |
| D | 15 | 94 | 9028419 | 129302.65 | 239 | 229 | 69.8 |
| D | 6 | 42 | 2902644 | 41568.68 | 239 | 229 | 69.8 |
| D | 12 | 17 | 871360 | 12476.43 | 239 | 229 | 69.8 |
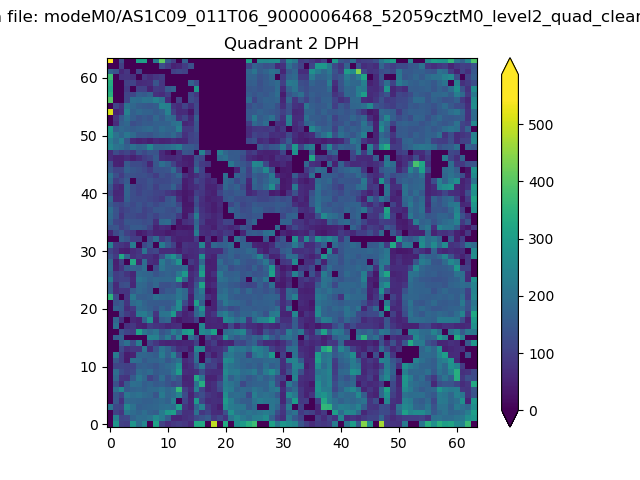
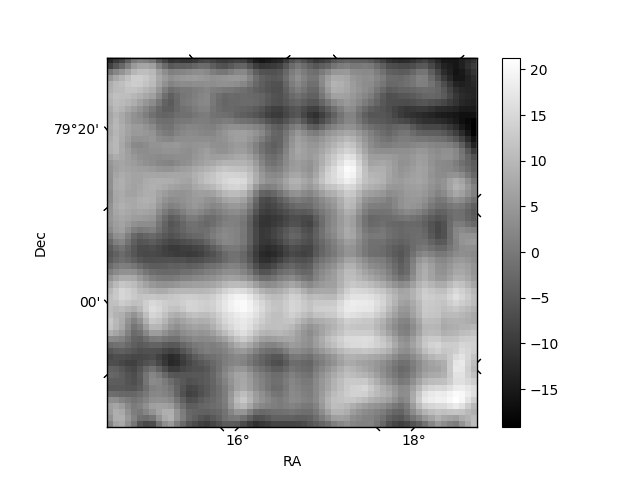
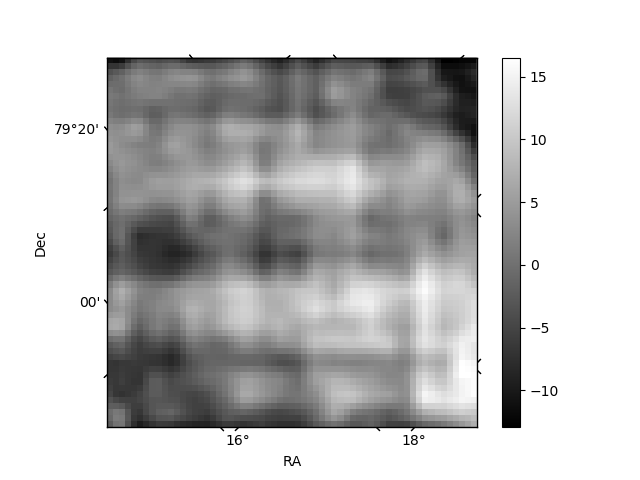
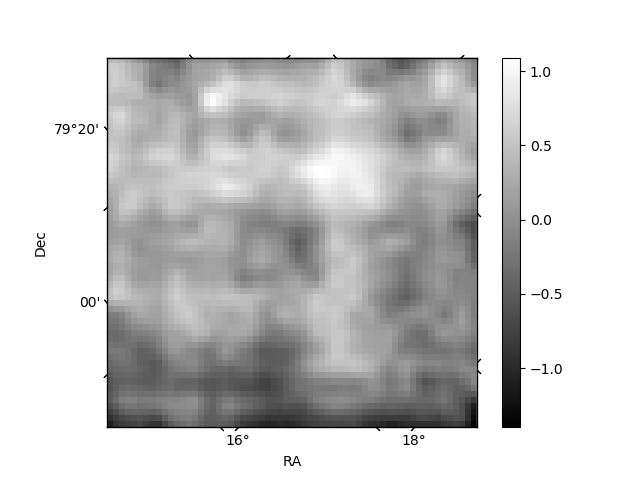
Histogram calculated using DETX and DETY for each event in the final _common_clean file
| Quadrant A | 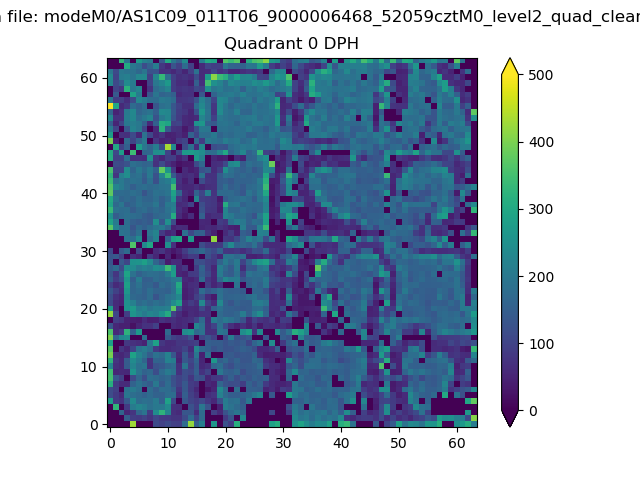 |
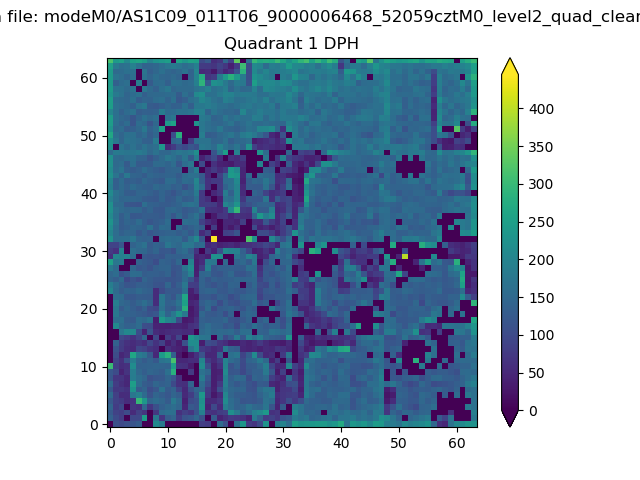 |
Quadrant B |
|---|---|---|---|
| Quadrant D | 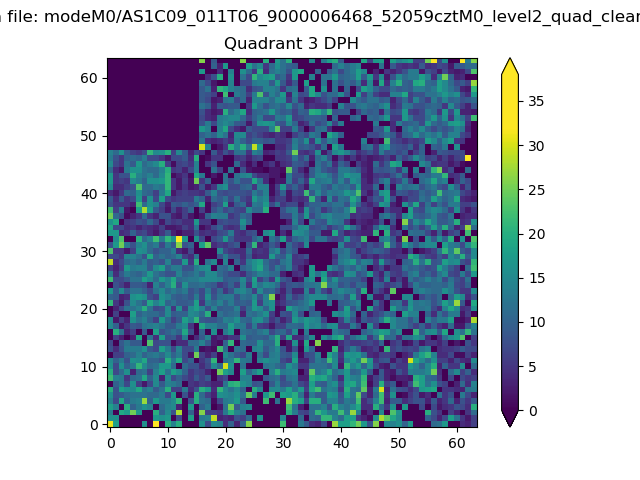 |
 |
Quadrant C |
| Plot type | Count rate plots | Images |
|---|---|---|
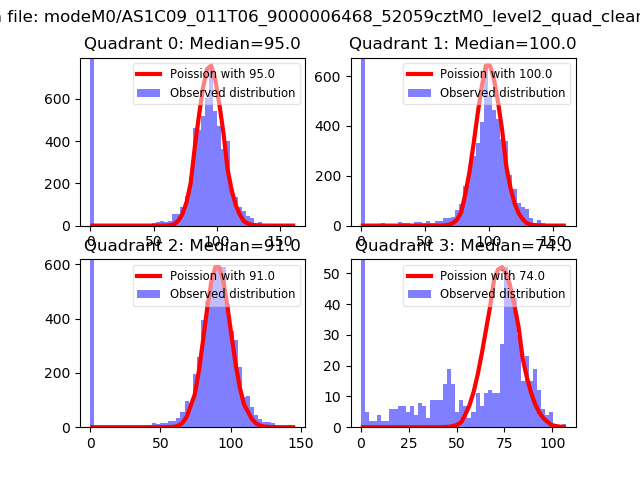
| Comparison with Poisson distribution Blue bars denote a histogram of data divided into 1 sec bins. Red curve is a Poisson curve with rate = median count rate of data. |
 |
 |
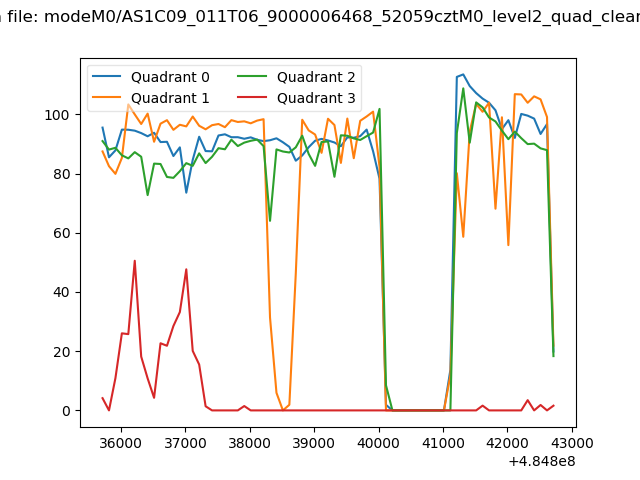
| Quadrant-wise count rates Data is divided into 100 sec bins |
 |
|
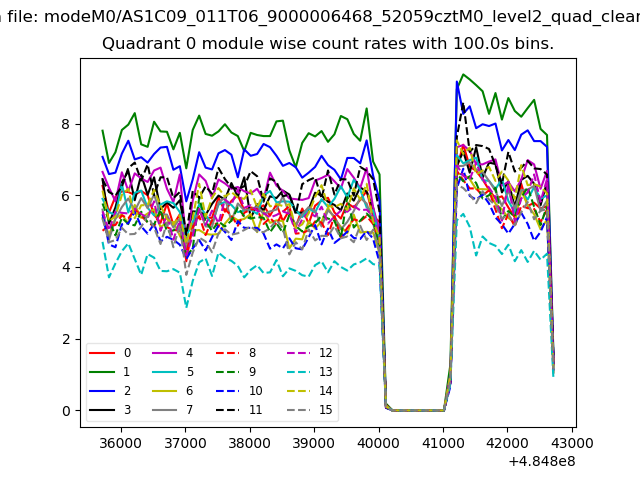
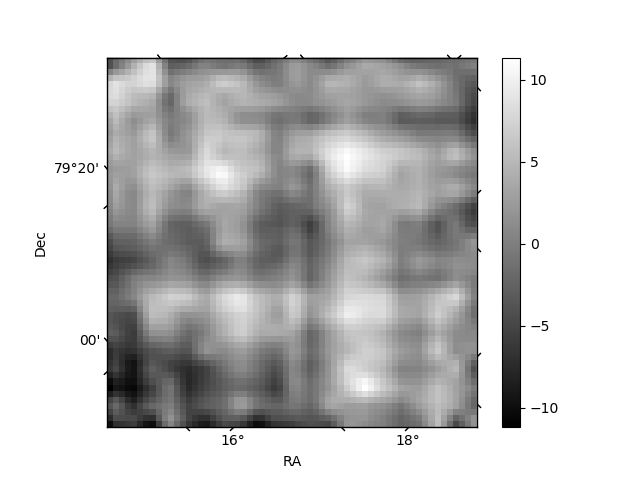
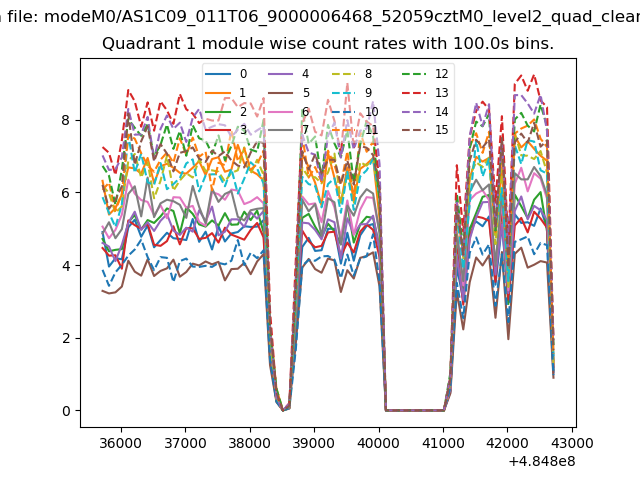
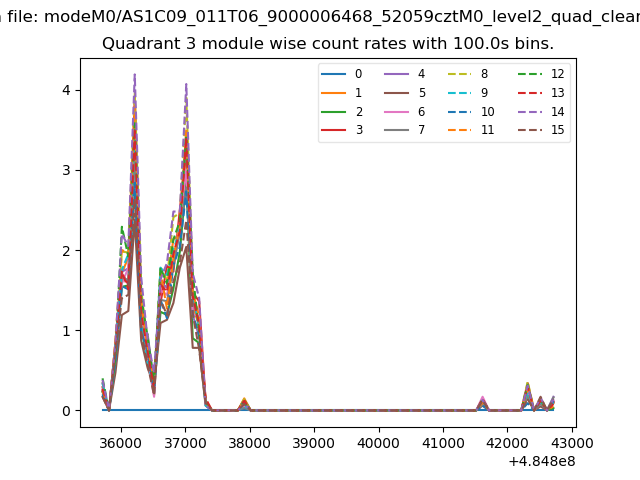
| Module-wise count rates for Quadrant A Data is divided into 100 sec bins |
 |
 |
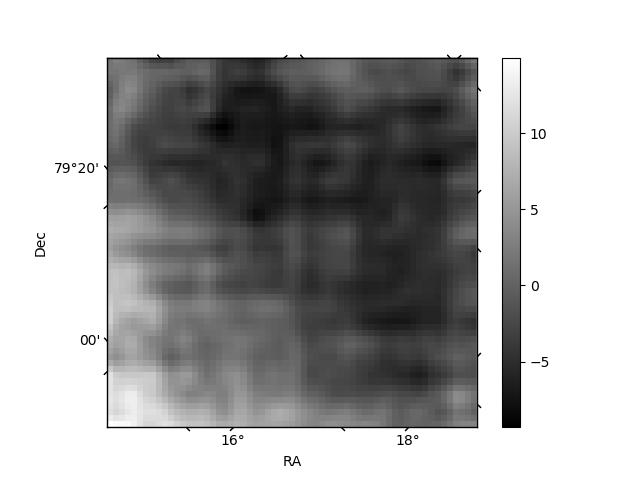
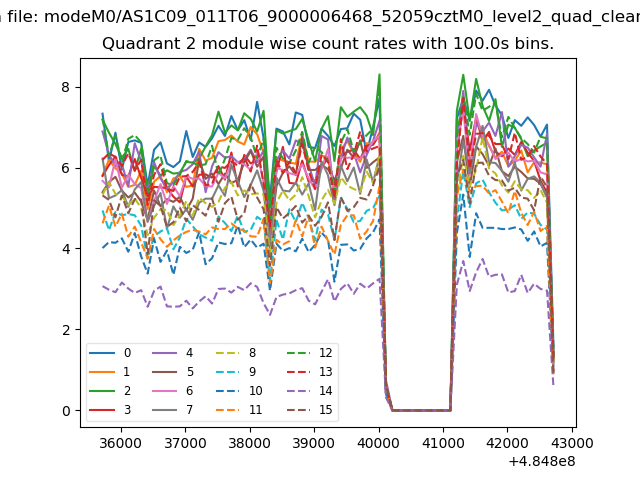
| Module-wise count rates for Quadrant B Data is divided into 100 sec bins |
 |
 |
| Module-wise count rates for Quadrant C Data is divided into 100 sec bins |
 |
 |
| Module-wise count rates for Quadrant D Data is divided into 100 sec bins |
 |
 |
| Parameter | Plot |
|---|---|
| CZT HV Monitor | 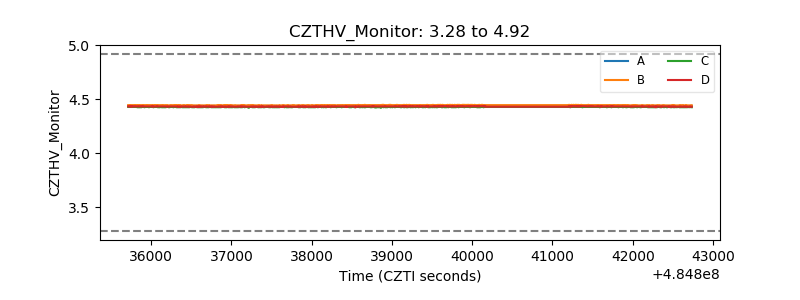 |
| D_VDD | 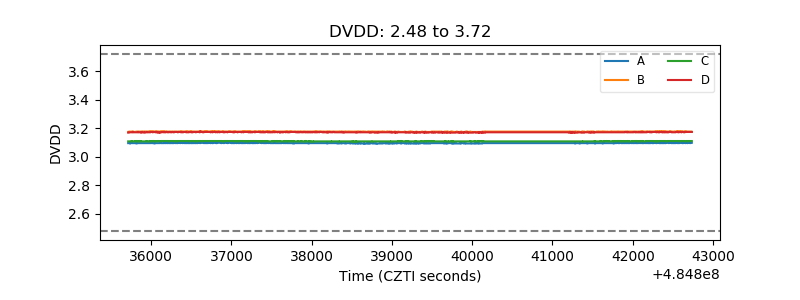 |
| Temperature 1 | 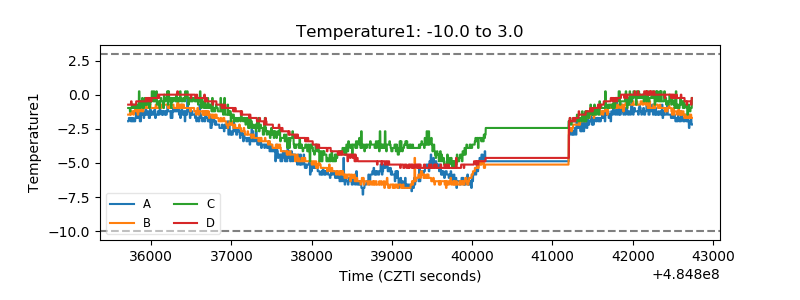 |
| Veto HV Monitor | 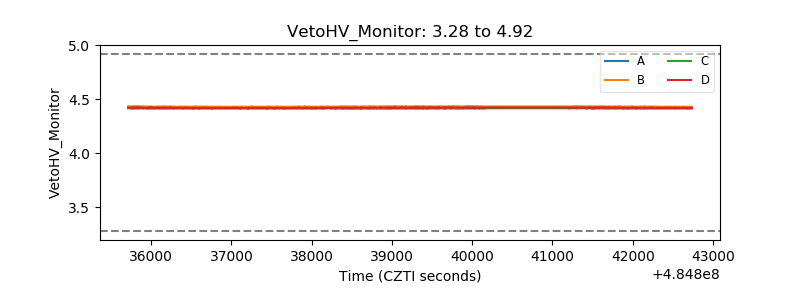 |
| Veto LLD | 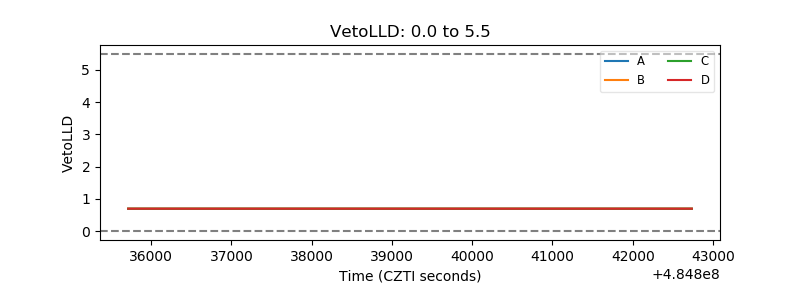 |
| Alpha Counter | 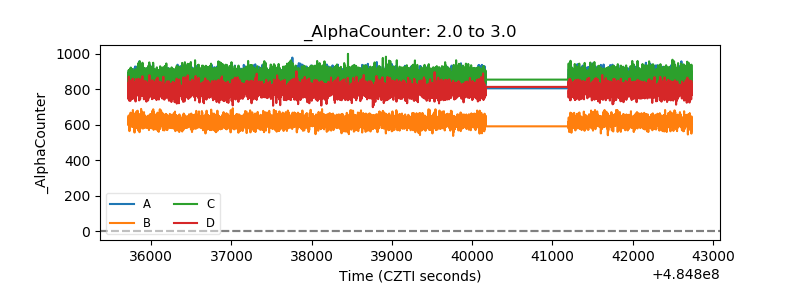 |
| _CPM_Rate | 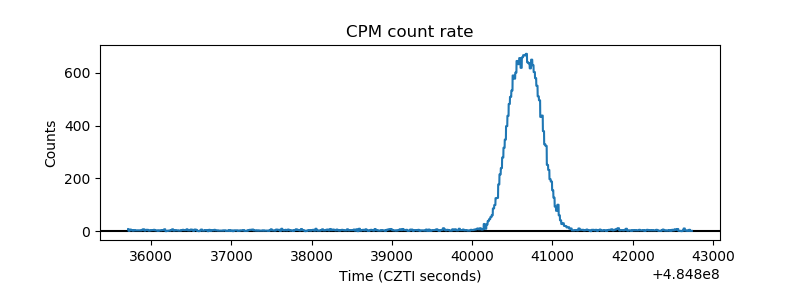 |
| CZT Counter | 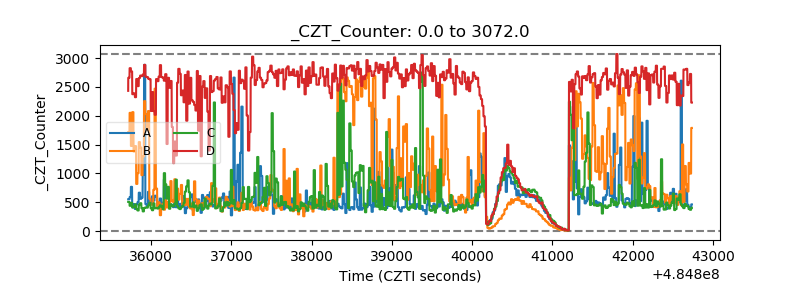 |
| +2.5 Volts monitor |  |
| +5 Volts monitor | 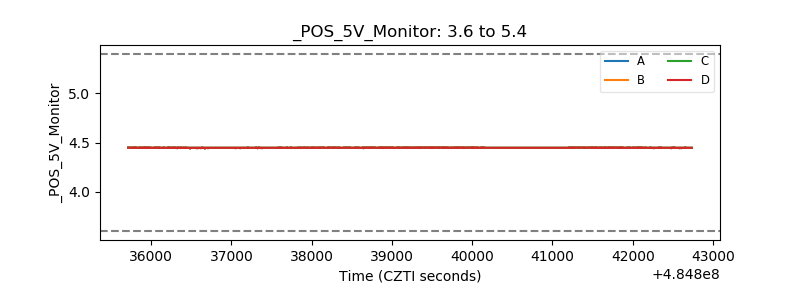 |
| _ROLL_ROT | 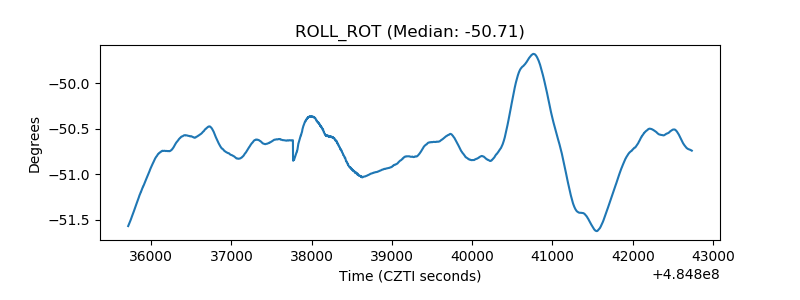 |
| _Roll_DEC | 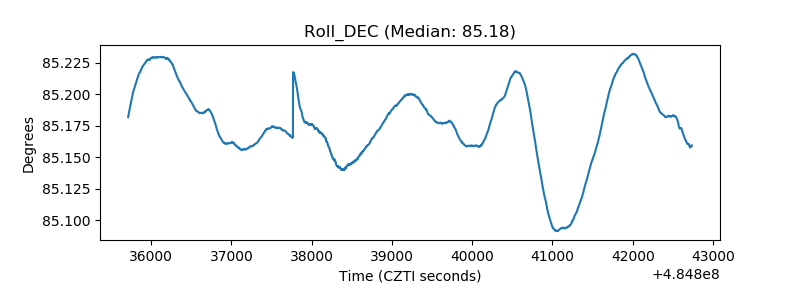 |
| _Roll_RA | 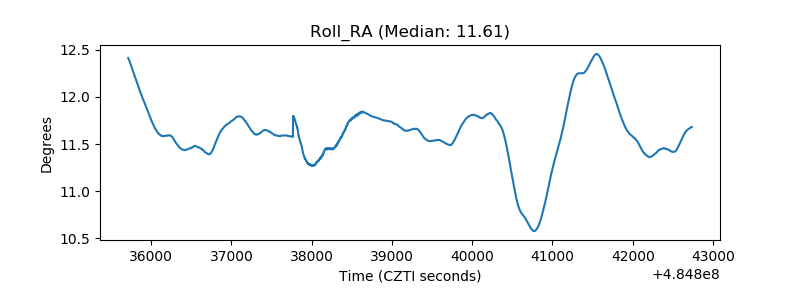 |
| Veto Counter | 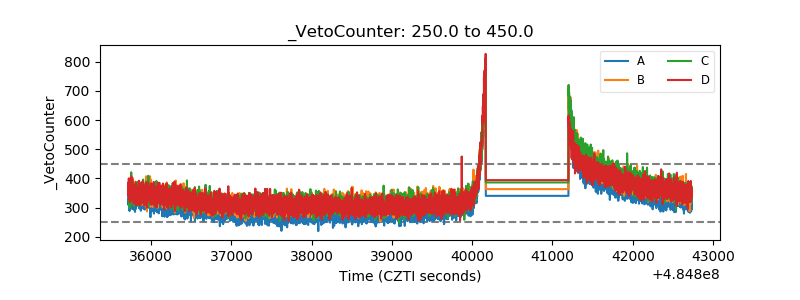 |