| Param | Original file | Final file |
|---|---|---|
| Filename | modeM0/AS1C09_011T06_9000006468_52060cztM0_level2.fits | modeM0/AS1C09_011T06_9000006468_52060cztM0_level2_quad_clean.evt |
| Size (bytes) | 863,688,960 | 70,027,200 |
| Size | 823.7 MB | 66.8 MB |
| Events in quadrant A | 3,688,198 | 588,125 |
| Events in quadrant B | 7,048,267 | 526,506 |
| Events in quadrant C | 5,321,917 | 526,744 |
| Events in quadrant D | 15,441,680 | 54,315 |
| Mode M0 | |||
|---|---|---|---|
| Quadrant | BADHDUFLAG | Total packets | Discarded packets |
| A | 0 | 14998 | 1 |
| B | 0 | 25139 | 1 |
| C | 0 | 20068 | 1 |
| D | 0 | 50063 | 1 |
| Mode M9 | |||
|---|---|---|---|
| Quadrant | BADHDUFLAG | Total packets | Discarded packets |
| A | 0 | 12 | 0 |
| B | 0 | 12 | 0 |
| C | 0 | 12 | 0 |
| D | 0 | 12 | 0 |
| Mode SS | |||
|---|---|---|---|
| Quadrant | BADHDUFLAG | Total packets | Discarded packets |
| A | 0 | 122 | 0 |
| B | 0 | 122 | 0 |
| C | 0 | 122 | 0 |
| D | 0 | 122 | 0 |
| Quadrant | Total seconds | Saturated seconds | Saturation percentage |
|---|---|---|---|
| A | 6082 | 157 | 2.581388% |
| B | 6083 | 1338 | 21.995726% |
| C | 6083 | 655 | 10.767713% |
| D | 6083 | 5582 | 91.763932% |
Noise dominated data is calculated using 1-second bins in cleaned event files. If a bin has >2000 counts, and if more than 50% of those come from <1% of pixels, then it is considered to be noise-dominated and hence unusable.
| Quadrant | # 1 sec bins | Bins with >0 counts | Bins with >2000 counts | High rate bins dominated by noise | Noise dominated (total time) | Noise dominated (detector-on time) | Marked lightcurve |
|---|---|---|---|---|---|---|---|
| A | 7242 | 6083 | 110 | 110 | 1.52% | 1.81% | 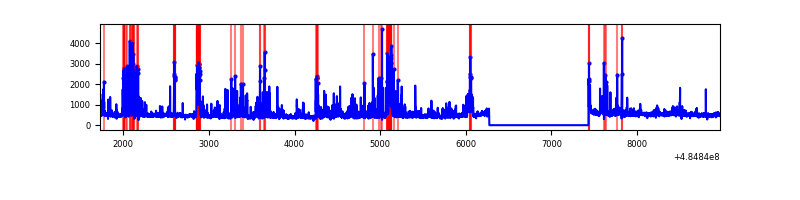 |
| B | 7243 | 6083 | 974 | 974 | 13.45% | 16.01% | 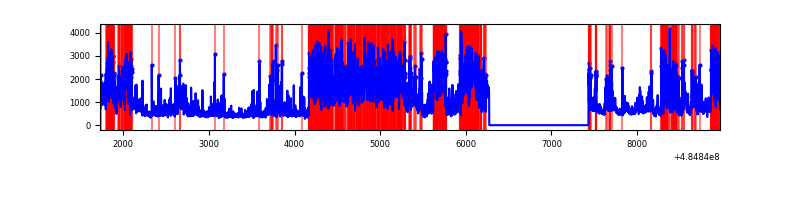 |
| C | 7243 | 6084 | 549 | 549 | 7.58% | 9.02% | 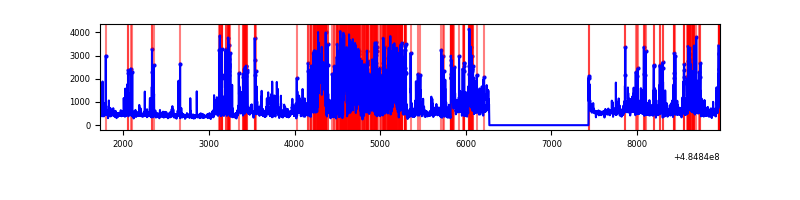 |
| D | 7242 | 6082 | 5422 | 5422 | 74.87% | 89.15% | 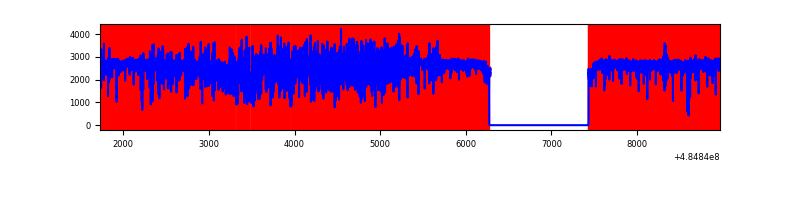 |
Top three noisy pixels from each quadrant. If the there are fewer than three noisy pixels in the level2.evt file, extra rows are filled as -1
| Pixel properties | Quadrant properties | ||||||
|---|---|---|---|---|---|---|---|
| Quadrant | DetID | PixID | Counts | Sigma | Mean | Median | Sigma |
| A | 8 | 43 | 307418 | 1942.93 | 636 | 621 | 157.9 |
| A | 4 | 249 | 225135 | 1421.84 | 636 | 621 | 157.9 |
| A | 4 | 3 | 158425 | 999.37 | 636 | 621 | 157.9 |
| B | 8 | 3 | 2120426 | 16884.73 | 590 | 571 | 125.5 |
| B | 0 | 172 | 1403747 | 11176.35 | 590 | 571 | 125.5 |
| B | 8 | 128 | 357385 | 2842.04 | 590 | 571 | 125.5 |
| C | 15 | 224 | 1739866 | 10462.94 | 603 | 598 | 166.2 |
| C | 9 | 38 | 280569 | 1684.23 | 603 | 598 | 166.2 |
| C | 13 | 3 | 229992 | 1379.97 | 603 | 598 | 166.2 |
| D | 15 | 94 | 8158819 | 104094.77 | 264 | 252 | 78.4 |
| D | 6 | 42 | 2278267 | 29065.09 | 264 | 252 | 78.4 |
| D | 12 | 17 | 1452848 | 18533.6 | 264 | 252 | 78.4 |
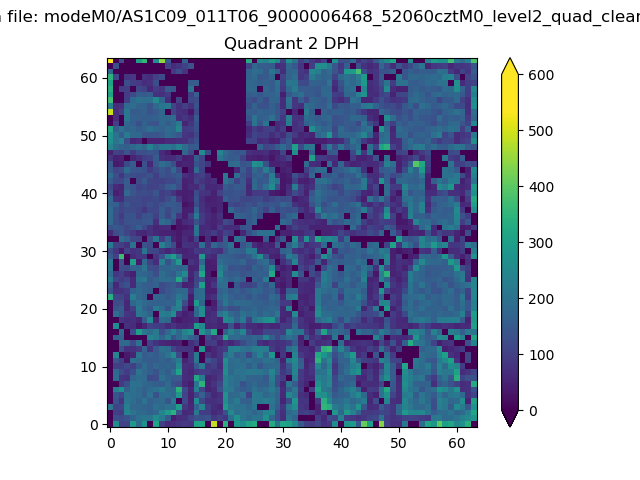
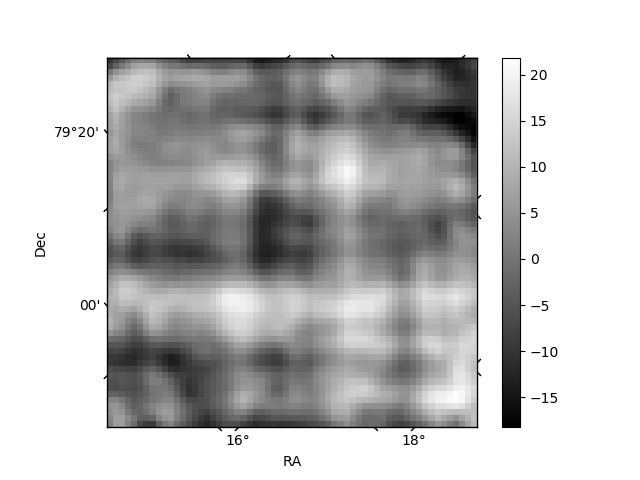
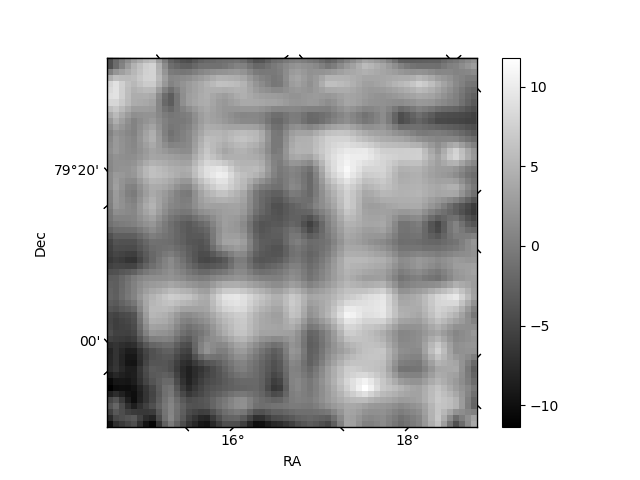
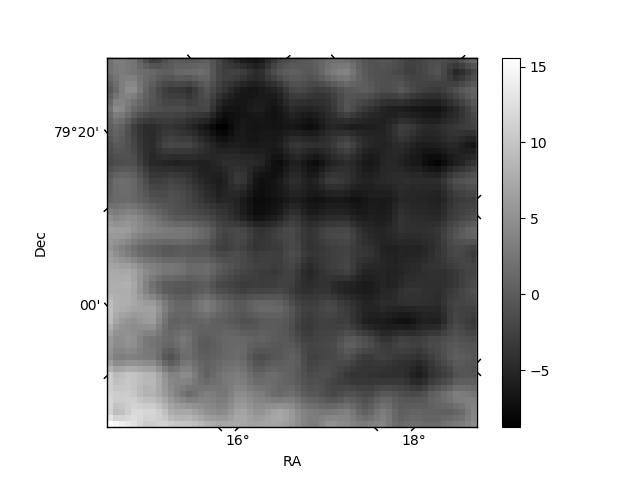
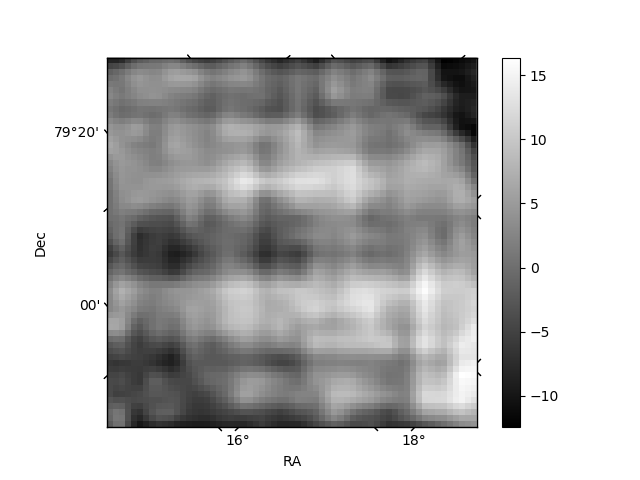
Histogram calculated using DETX and DETY for each event in the final _common_clean file
| Quadrant A | 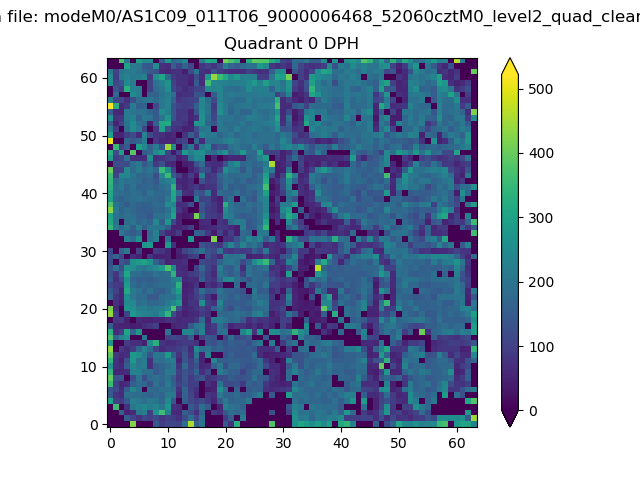 |
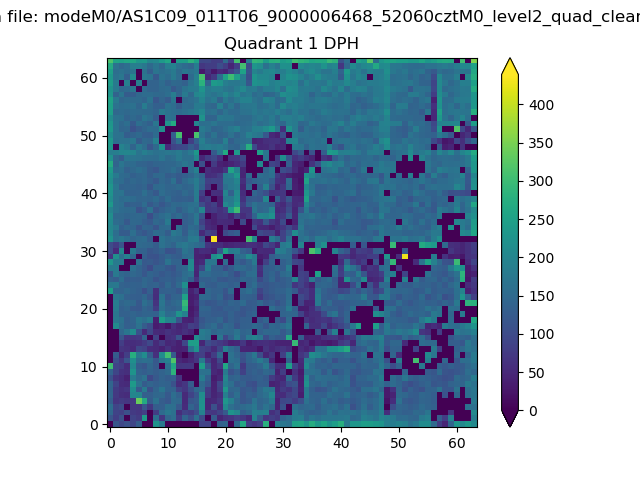 |
Quadrant B |
|---|---|---|---|
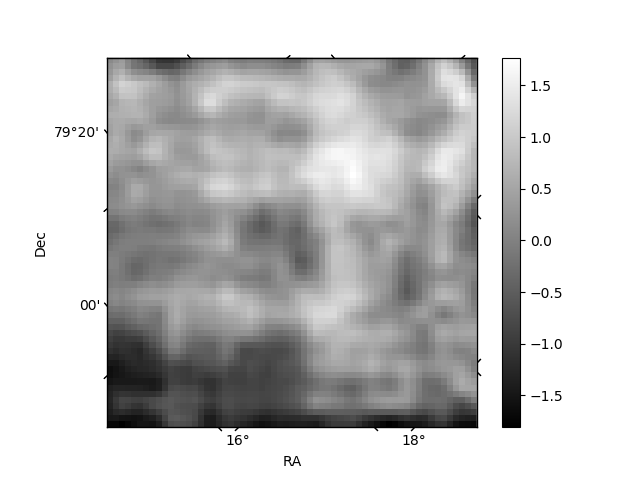
| Quadrant D | 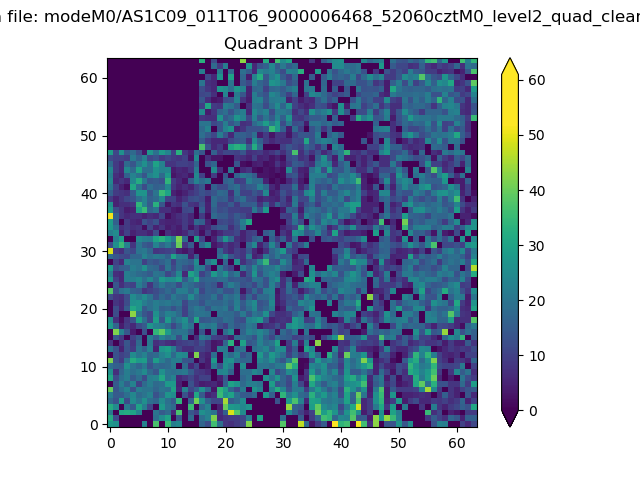 |
 |
Quadrant C |
| Plot type | Count rate plots | Images |
|---|---|---|
| Comparison with Poisson distribution Blue bars denote a histogram of data divided into 1 sec bins. Red curve is a Poisson curve with rate = median count rate of data. |
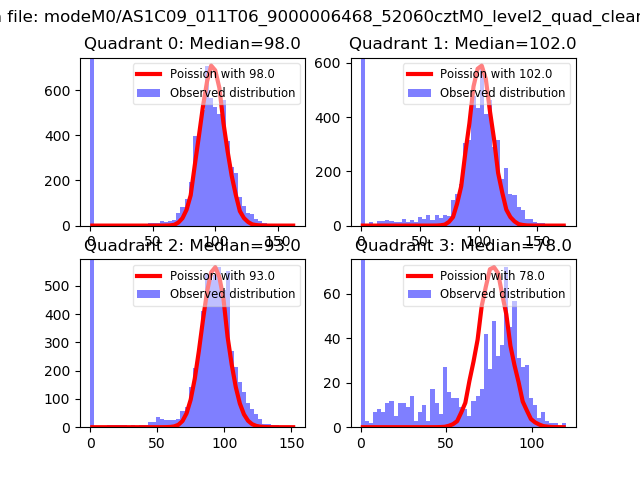 |
 |
| Quadrant-wise count rates Data is divided into 100 sec bins |
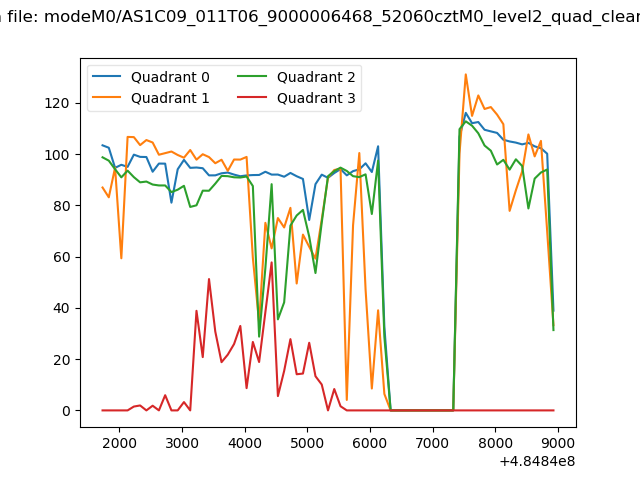 |
|
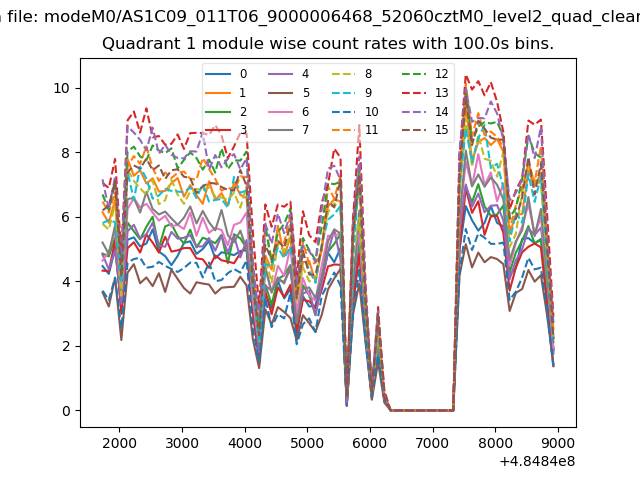
| Module-wise count rates for Quadrant A Data is divided into 100 sec bins |
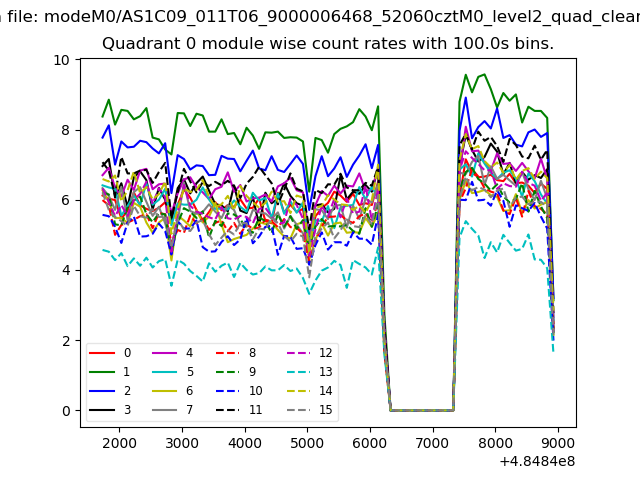 |
 |
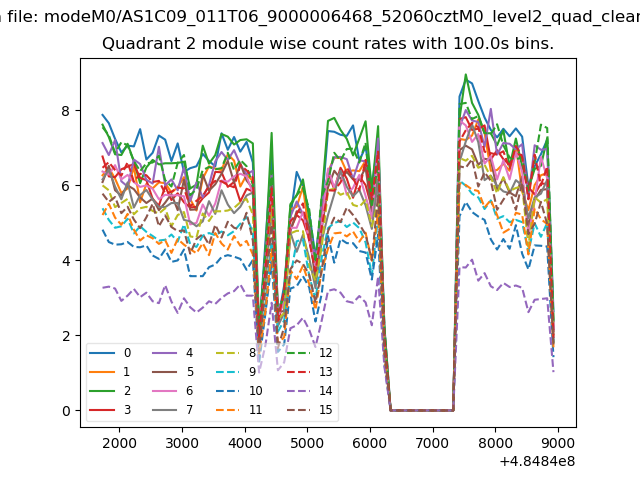
| Module-wise count rates for Quadrant B Data is divided into 100 sec bins |
 |
 |
| Module-wise count rates for Quadrant C Data is divided into 100 sec bins |
 |
 |
| Module-wise count rates for Quadrant D Data is divided into 100 sec bins |
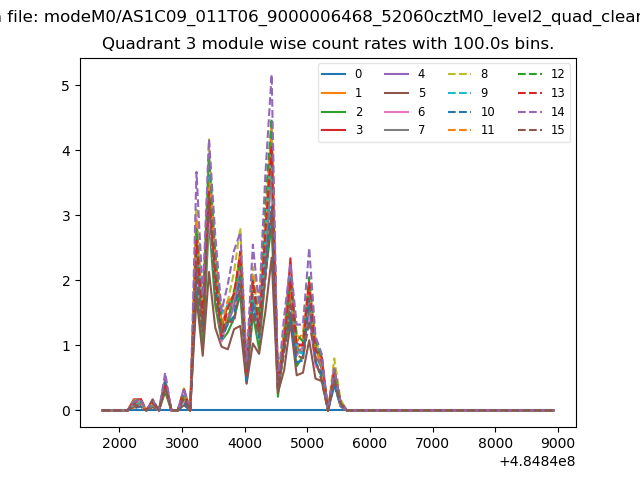 |
 |
| Parameter | Plot |
|---|---|
| CZT HV Monitor | 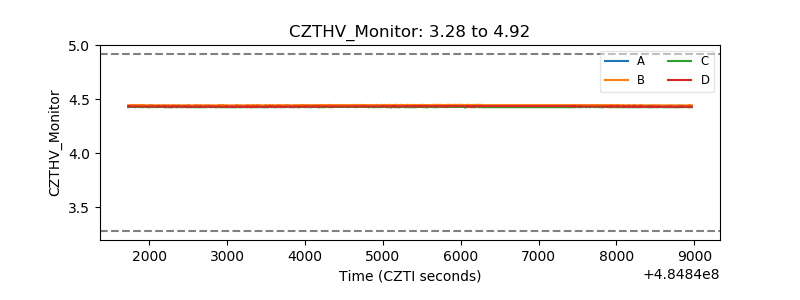 |
| D_VDD | 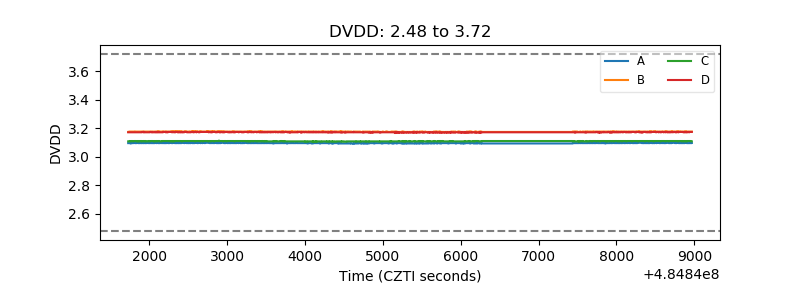 |
| Temperature 1 | 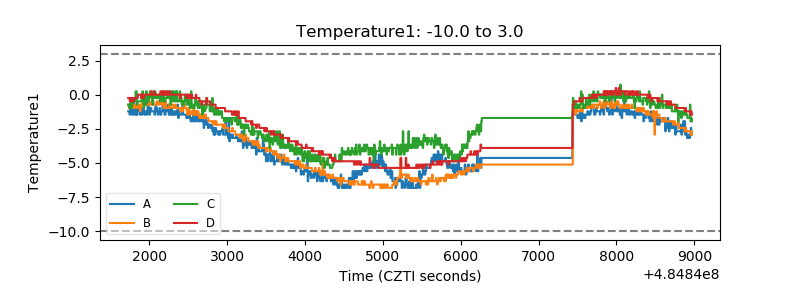 |
| Veto HV Monitor |  |
| Veto LLD | 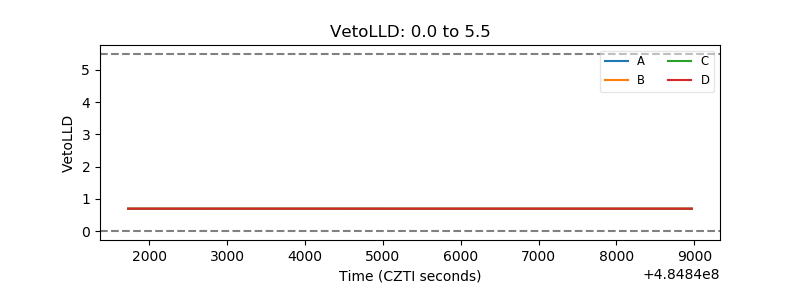 |
| Alpha Counter | 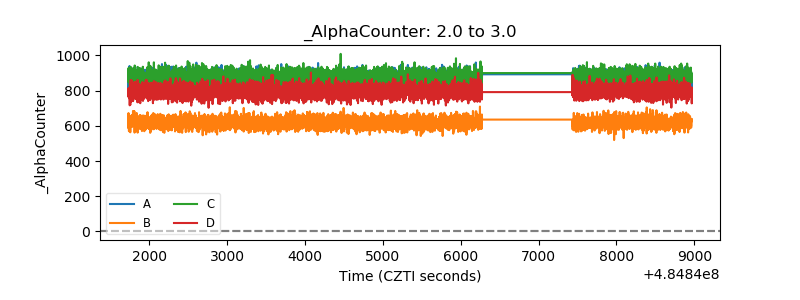 |
| _CPM_Rate | 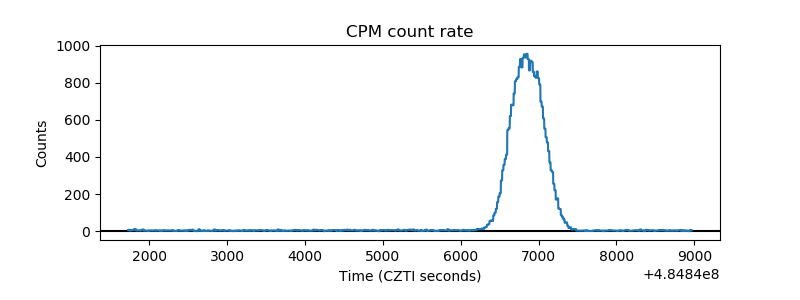 |
| CZT Counter | 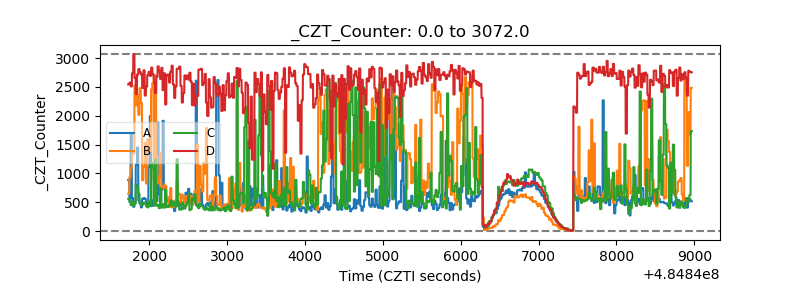 |
| +2.5 Volts monitor | 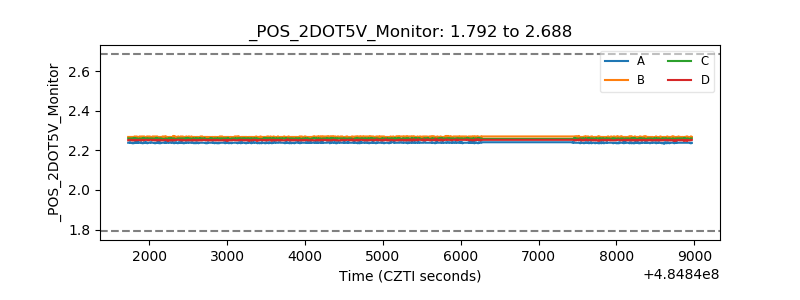 |
| +5 Volts monitor | 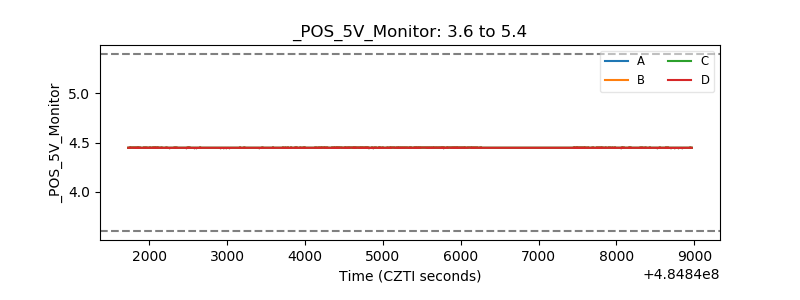 |
| _ROLL_ROT | 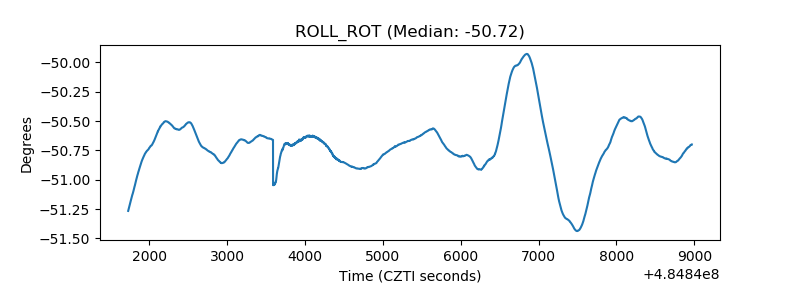 |
| _Roll_DEC | 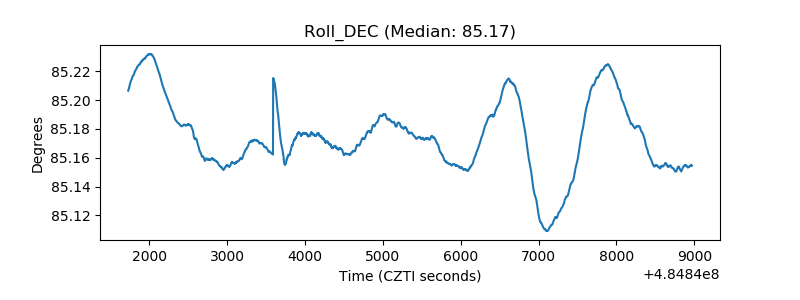 |
| _Roll_RA | 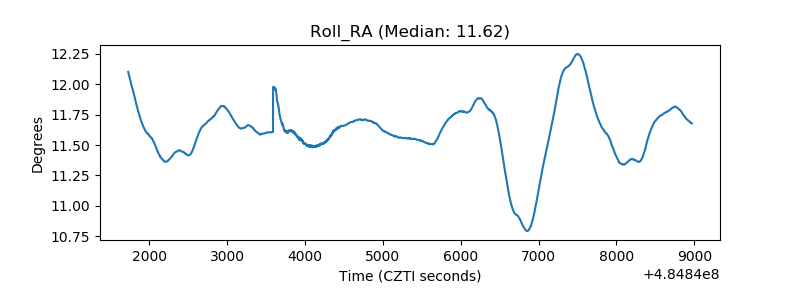 |
| Veto Counter | 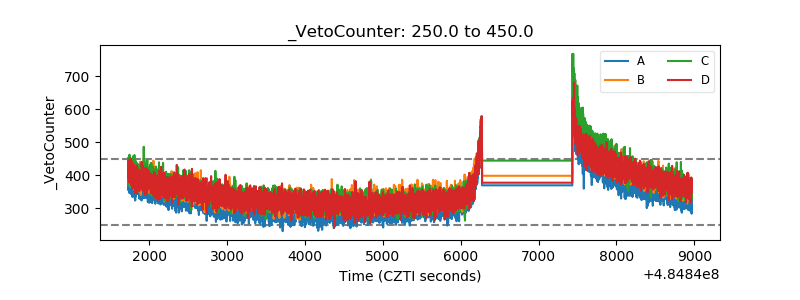 |