| Param | Original file | Final file |
|---|---|---|
| Filename | modeM0/AS1C09_011T06_9000006468_52061cztM0_level2.fits | modeM0/AS1C09_011T06_9000006468_52061cztM0_level2_quad_clean.evt |
| Size (bytes) | 895,150,080 | 68,270,400 |
| Size | 853.7 MB | 65.1 MB |
| Events in quadrant A | 3,538,655 | 584,317 |
| Events in quadrant B | 5,993,068 | 561,923 |
| Events in quadrant C | 7,454,859 | 475,442 |
| Events in quadrant D | 15,685,117 | 26,318 |
| Mode M0 | |||
|---|---|---|---|
| Quadrant | BADHDUFLAG | Total packets | Discarded packets |
| A | 0 | 14488 | 1 |
| B | 0 | 21914 | 1 |
| C | 0 | 26273 | 1 |
| D | 0 | 50742 | 1 |
| Mode M9 | |||
|---|---|---|---|
| Quadrant | BADHDUFLAG | Total packets | Discarded packets |
| A | 0 | 12 | 0 |
| B | 0 | 12 | 0 |
| C | 0 | 12 | 0 |
| D | 0 | 12 | 0 |
| Mode SS | |||
|---|---|---|---|
| Quadrant | BADHDUFLAG | Total packets | Discarded packets |
| A | 0 | 122 | 0 |
| B | 0 | 122 | 0 |
| C | 0 | 122 | 0 |
| D | 0 | 122 | 0 |
| Quadrant | Total seconds | Saturated seconds | Saturation percentage |
|---|---|---|---|
| A | 5996 | 199 | 3.318879% |
| B | 5996 | 922 | 15.376918% |
| C | 5996 | 1380 | 23.015344% |
| D | 5996 | 5762 | 96.097398% |
Noise dominated data is calculated using 1-second bins in cleaned event files. If a bin has >2000 counts, and if more than 50% of those come from <1% of pixels, then it is considered to be noise-dominated and hence unusable.
| Quadrant | # 1 sec bins | Bins with >0 counts | Bins with >2000 counts | High rate bins dominated by noise | Noise dominated (total time) | Noise dominated (detector-on time) | Marked lightcurve |
|---|---|---|---|---|---|---|---|
| A | 7202 | 5997 | 130 | 130 | 1.81% | 2.17% | 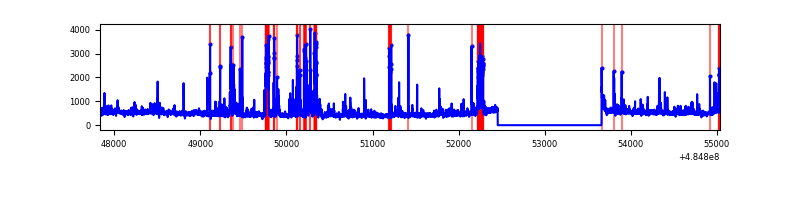 |
| B | 7202 | 5997 | 713 | 713 | 9.90% | 11.89% | 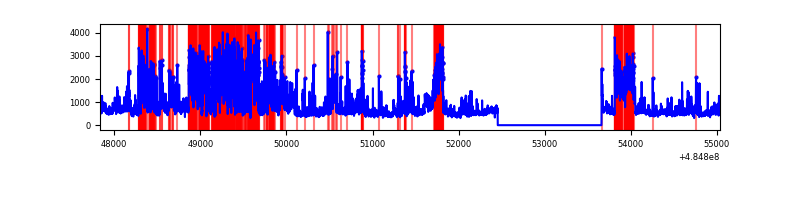 |
| C | 7202 | 5996 | 1217 | 1217 | 16.90% | 20.30% |  |
| D | 7201 | 5995 | 5668 | 5668 | 78.71% | 94.55% | 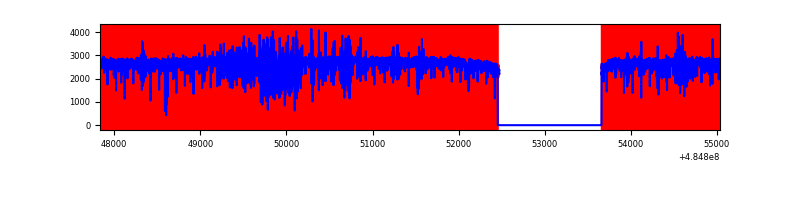 |
Top three noisy pixels from each quadrant. If the there are fewer than three noisy pixels in the level2.evt file, extra rows are filled as -1
| Pixel properties | Quadrant properties | ||||||
|---|---|---|---|---|---|---|---|
| Quadrant | DetID | PixID | Counts | Sigma | Mean | Median | Sigma |
| A | 8 | 43 | 417766 | 2656.98 | 631 | 615 | 157.0 |
| A | 4 | 3 | 181209 | 1150.27 | 631 | 615 | 157.0 |
| A | 3 | 95 | 55289 | 348.24 | 631 | 615 | 157.0 |
| B | 0 | 172 | 1414951 | 11154.28 | 605 | 585 | 126.8 |
| B | 8 | 3 | 1157324 | 9122.53 | 605 | 585 | 126.8 |
| B | 10 | 254 | 398405 | 3137.37 | 605 | 585 | 126.8 |
| C | 15 | 224 | 3398358 | 21787.67 | 566 | 562 | 156.0 |
| C | 12 | 249 | 602648 | 3860.75 | 566 | 562 | 156.0 |
| C | 13 | 3 | 397937 | 2548.09 | 566 | 562 | 156.0 |
| D | 15 | 94 | 9697973 | 161331.23 | 201 | 191 | 60.1 |
| D | 6 | 42 | 2201399 | 36619.05 | 201 | 191 | 60.1 |
| D | 12 | 3 | 987056 | 16417.38 | 201 | 191 | 60.1 |
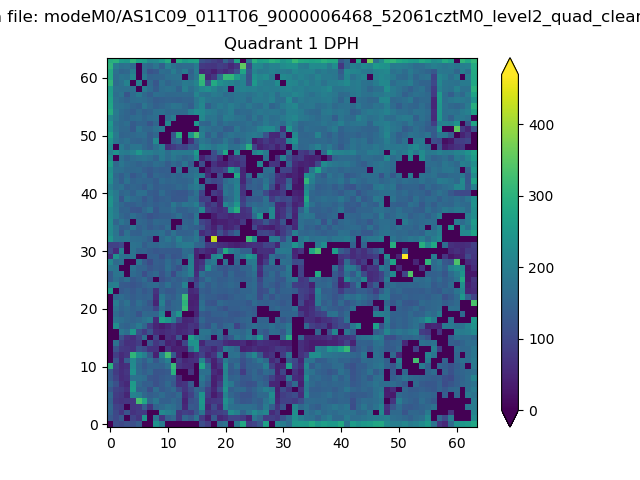
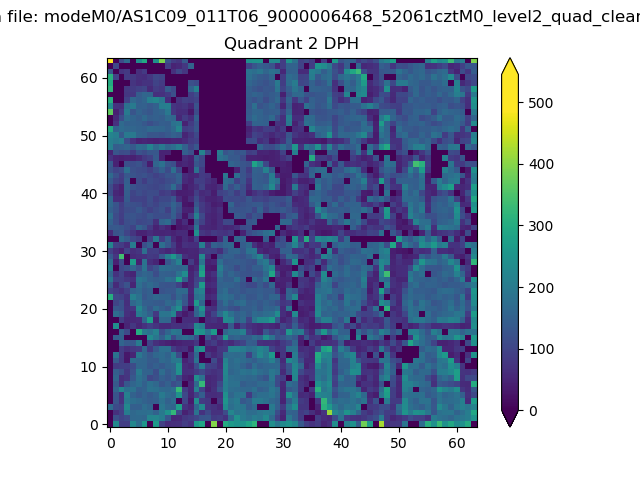
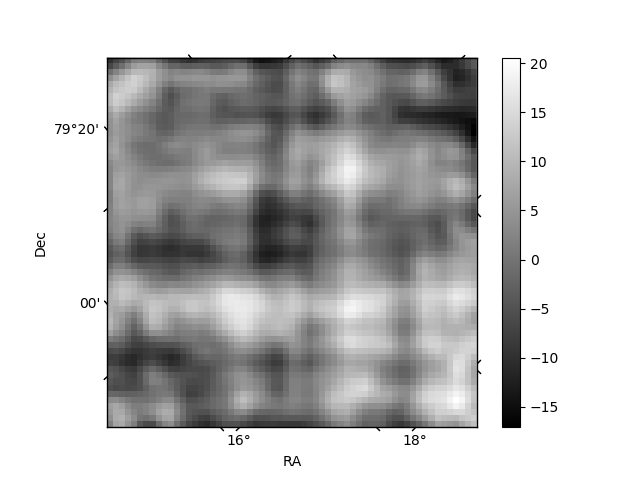
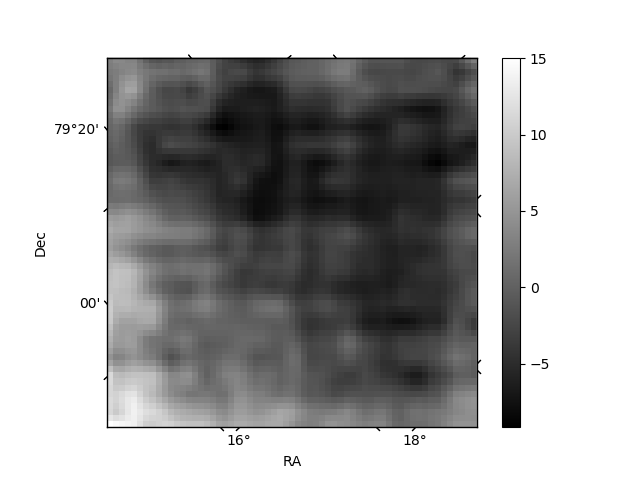
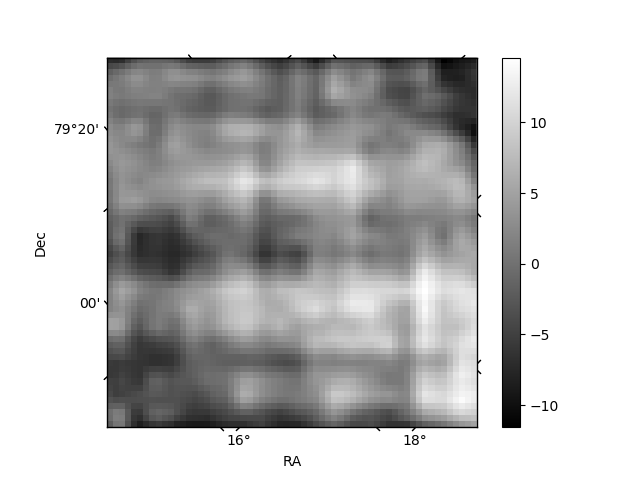
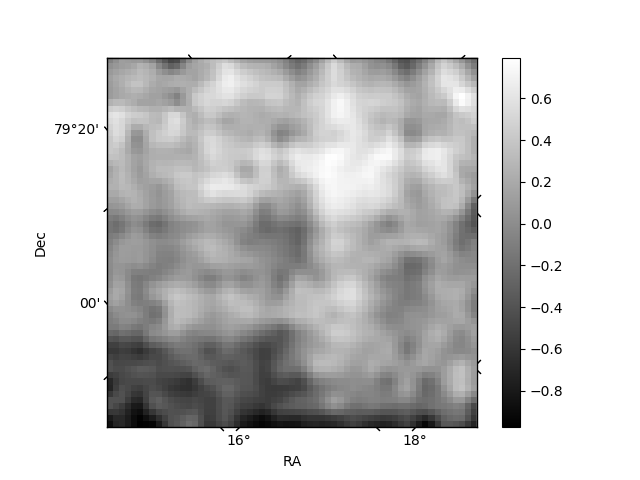
Histogram calculated using DETX and DETY for each event in the final _common_clean file
| Quadrant A | 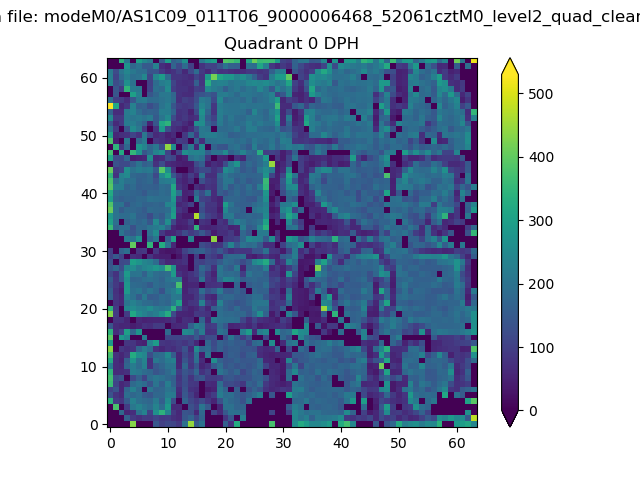 |
 |
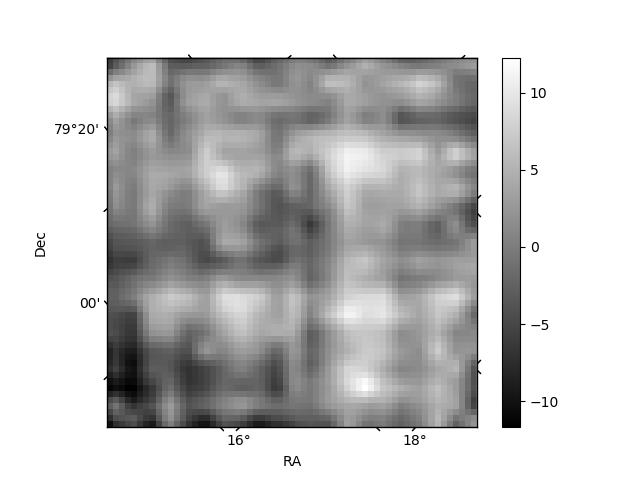
Quadrant B |
|---|---|---|---|
| Quadrant D | 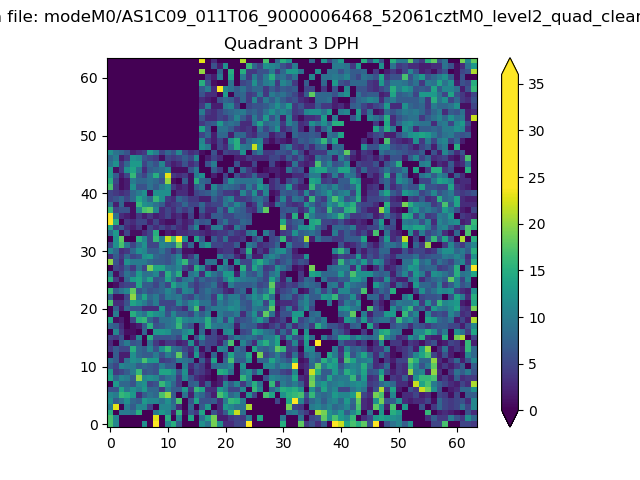 |
 |
Quadrant C |
| Plot type | Count rate plots | Images |
|---|---|---|
| Comparison with Poisson distribution Blue bars denote a histogram of data divided into 1 sec bins. Red curve is a Poisson curve with rate = median count rate of data. |
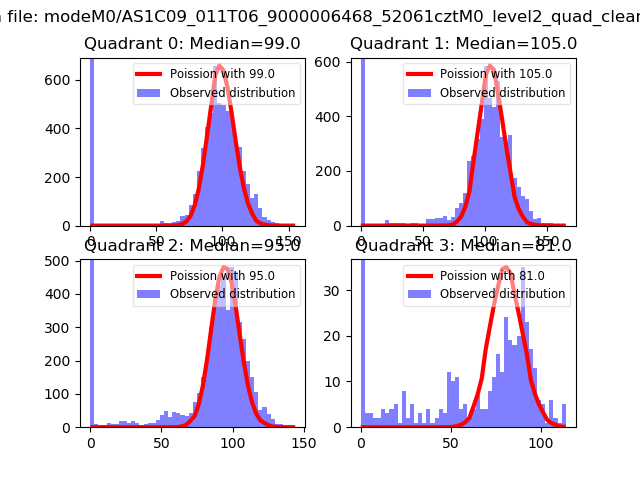 |
 |
| Quadrant-wise count rates Data is divided into 100 sec bins |
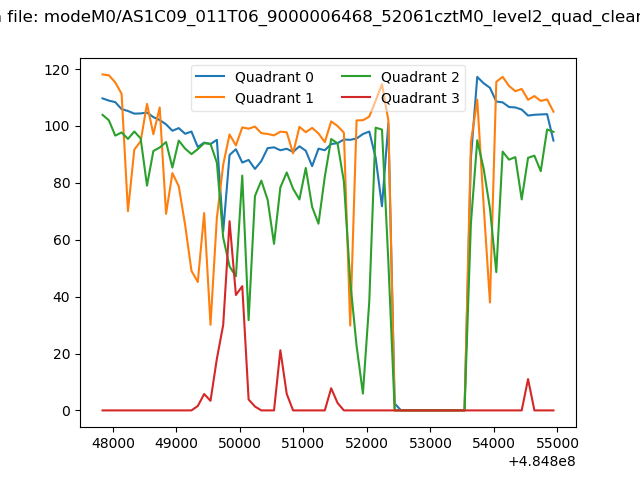 |
|
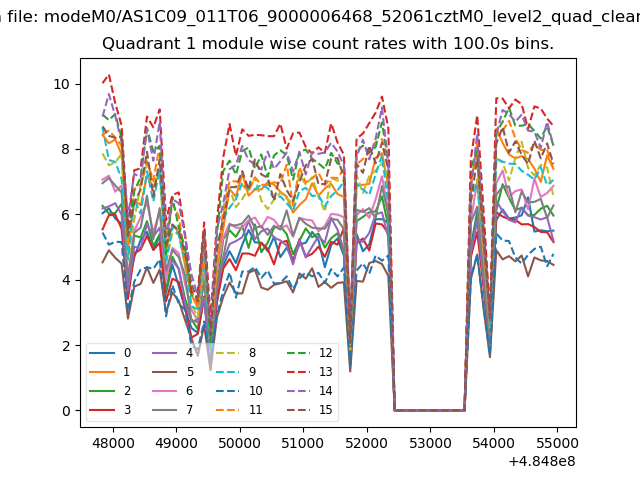
| Module-wise count rates for Quadrant A Data is divided into 100 sec bins |
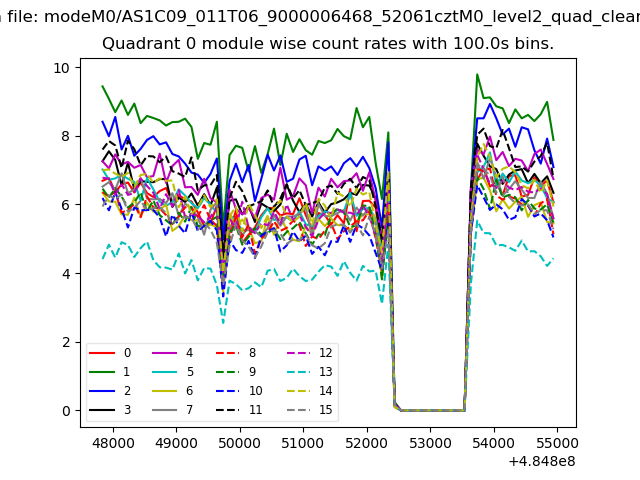 |
 |
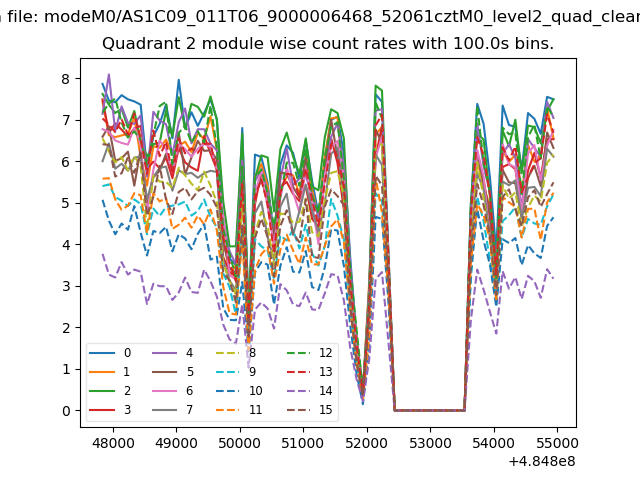
| Module-wise count rates for Quadrant B Data is divided into 100 sec bins |
 |
 |
| Module-wise count rates for Quadrant C Data is divided into 100 sec bins |
 |
 |
| Module-wise count rates for Quadrant D Data is divided into 100 sec bins |
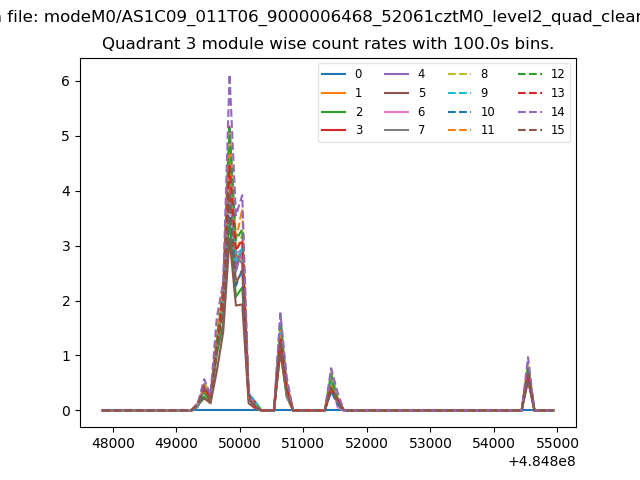 |
 |
| Parameter | Plot |
|---|---|
| CZT HV Monitor | 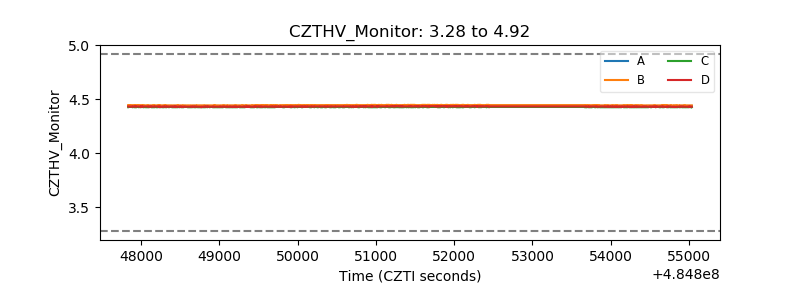 |
| D_VDD | 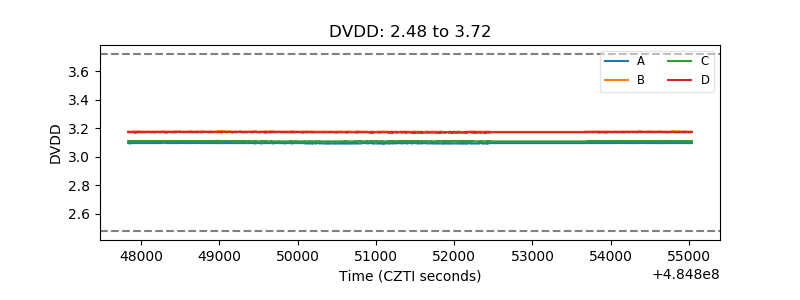 |
| Temperature 1 | 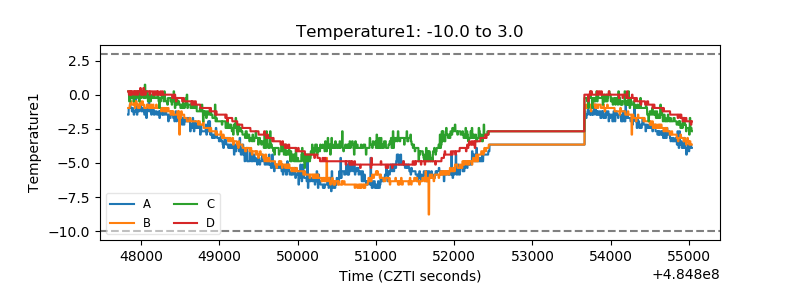 |
| Veto HV Monitor | 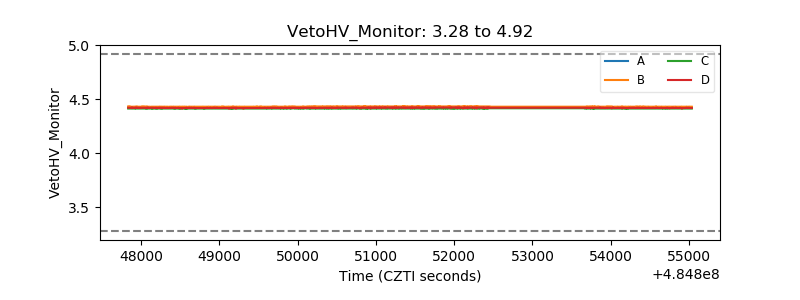 |
| Veto LLD | 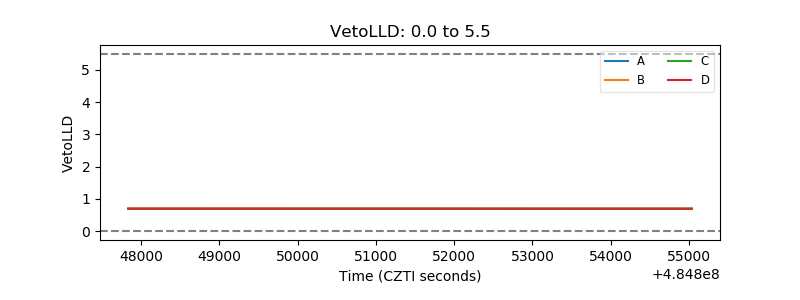 |
| Alpha Counter | 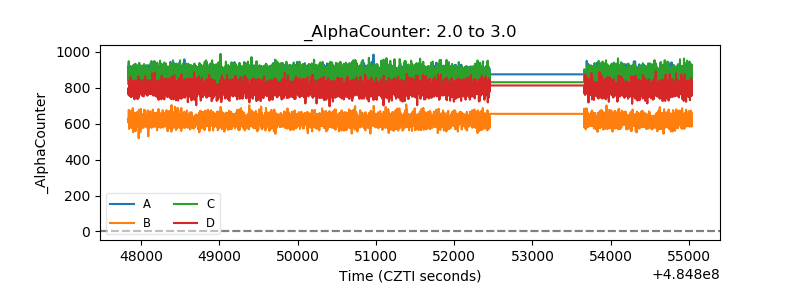 |
| _CPM_Rate | 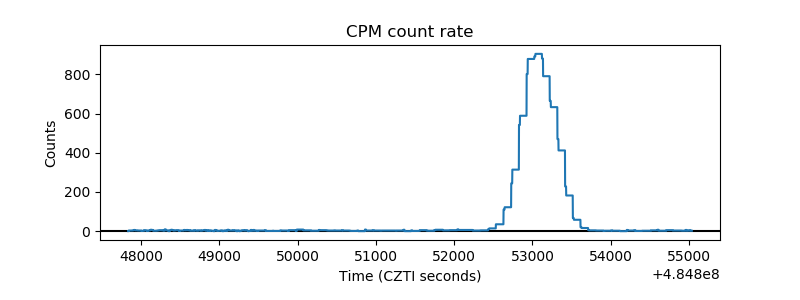 |
| CZT Counter | 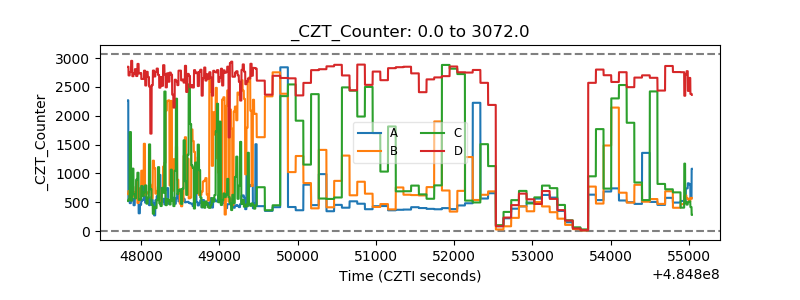 |
| +2.5 Volts monitor | 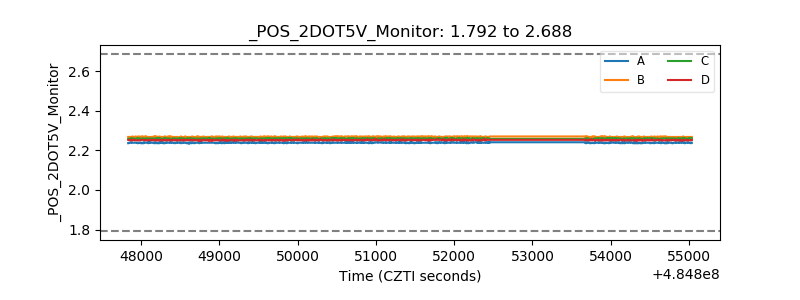 |
| +5 Volts monitor | 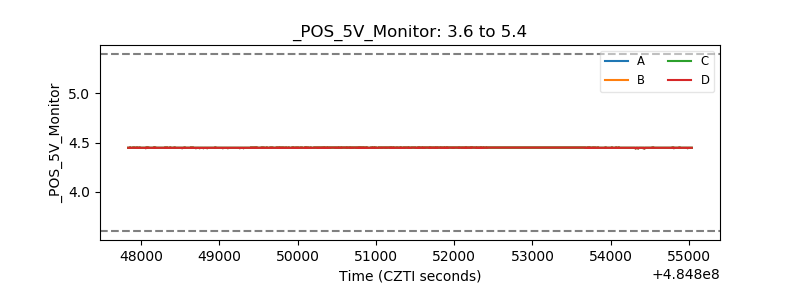 |
| _ROLL_ROT | 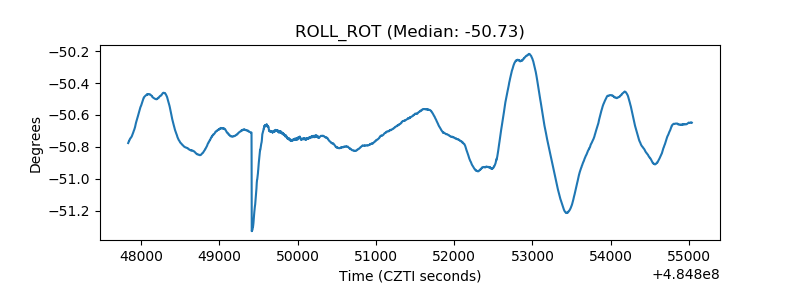 |
| _Roll_DEC | 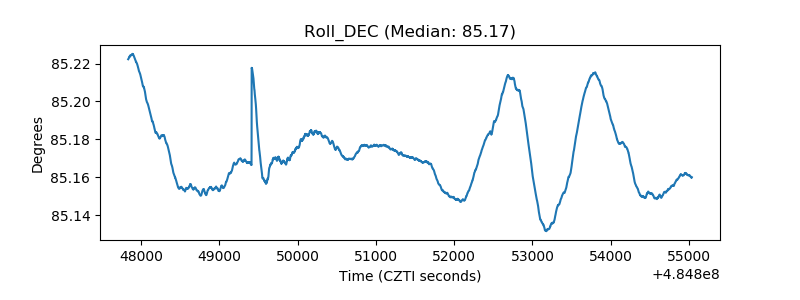 |
| _Roll_RA | 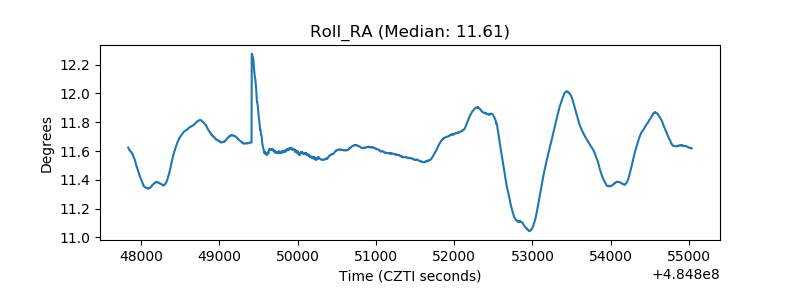 |
| Veto Counter | 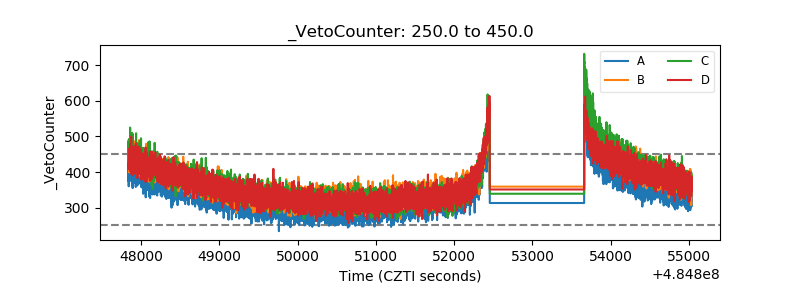 |