| Param | Original file | Final file |
|---|---|---|
| Filename | modeM0/AS1C09_011T06_9000006468_52062cztM0_level2.fits | modeM0/AS1C09_011T06_9000006468_52062cztM0_level2_quad_clean.evt |
| Size (bytes) | 1,066,060,800 | 61,208,640 |
| Size | 1016.7 MB | 58.4 MB |
| Events in quadrant A | 3,844,192 | 617,345 |
| Events in quadrant B | 11,011,389 | 275,111 |
| Events in quadrant C | 7,856,386 | 507,092 |
| Events in quadrant D | 16,257,786 | 9,108 |
| Mode M0 | |||
|---|---|---|---|
| Quadrant | BADHDUFLAG | Total packets | Discarded packets |
| A | 0 | 15723 | 2 |
| B | 0 | 37071 | 2 |
| C | 0 | 27733 | 2 |
| D | 0 | 52685 | 6 |
| Mode M9 | |||
|---|---|---|---|
| Quadrant | BADHDUFLAG | Total packets | Discarded packets |
| A | 0 | 13 | 0 |
| B | 0 | 14 | 0 |
| C | 0 | 14 | 0 |
| D | 0 | 14 | 0 |
| Mode SS | |||
|---|---|---|---|
| Quadrant | BADHDUFLAG | Total packets | Discarded packets |
| A | 0 | 128 | 0 |
| B | 0 | 128 | 0 |
| C | 0 | 128 | 0 |
| D | 0 | 128 | 0 |
| Quadrant | Total seconds | Saturated seconds | Saturation percentage |
|---|---|---|---|
| A | 6373 | 254 | 3.985564% |
| B | 6373 | 3927 | 61.619332% |
| C | 6373 | 1513 | 23.740781% |
| D | 6372 | 6299 | 98.854363% |
Noise dominated data is calculated using 1-second bins in cleaned event files. If a bin has >2000 counts, and if more than 50% of those come from <1% of pixels, then it is considered to be noise-dominated and hence unusable.
| Quadrant | # 1 sec bins | Bins with >0 counts | Bins with >2000 counts | High rate bins dominated by noise | Noise dominated (total time) | Noise dominated (detector-on time) | Marked lightcurve |
|---|---|---|---|---|---|---|---|
| A | 7533 | 6374 | 143 | 143 | 1.90% | 2.24% | 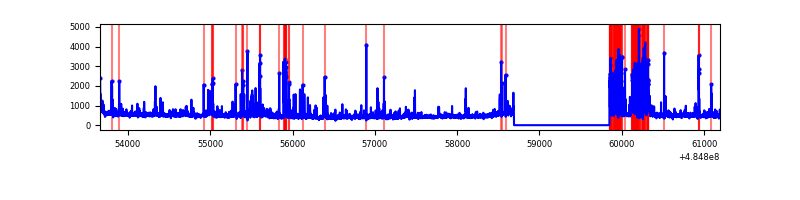 |
| B | 7532 | 6372 | 3595 | 3595 | 47.73% | 56.42% | 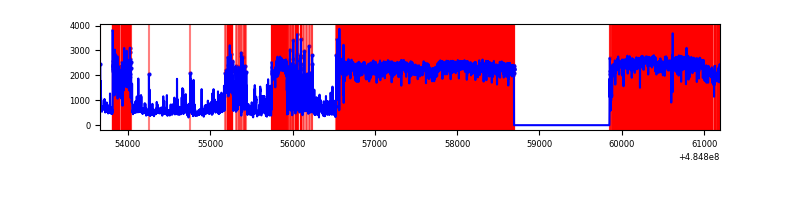 |
| C | 7532 | 6373 | 1234 | 1234 | 16.38% | 19.36% | 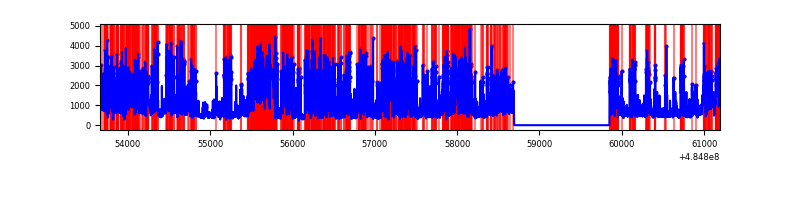 |
| D | 7531 | 6371 | 5893 | 5893 | 78.25% | 92.50% | 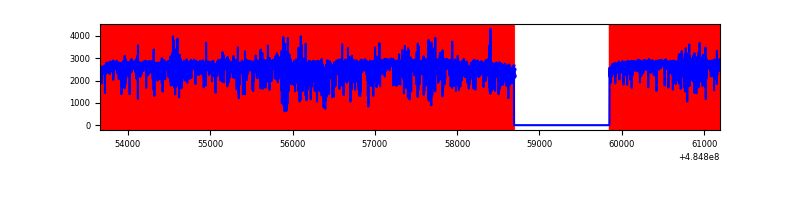 |
Top three noisy pixels from each quadrant. If the there are fewer than three noisy pixels in the level2.evt file, extra rows are filled as -1
| Pixel properties | Quadrant properties | ||||||
|---|---|---|---|---|---|---|---|
| Quadrant | DetID | PixID | Counts | Sigma | Mean | Median | Sigma |
| A | 11 | 3 | 329579 | 1952.16 | 673 | 657 | 168.5 |
| A | 4 | 3 | 161452 | 954.32 | 673 | 657 | 168.5 |
| A | 4 | 249 | 102509 | 604.5 | 673 | 657 | 168.5 |
| B | 8 | 3 | 8675345 | 113564.42 | 354 | 341 | 76.4 |
| B | 10 | 254 | 503115 | 6581.81 | 354 | 341 | 76.4 |
| B | 0 | 171 | 108413 | 1414.77 | 354 | 341 | 76.4 |
| C | 15 | 224 | 4118036 | 24302.06 | 612 | 607 | 169.4 |
| C | 12 | 252 | 616306 | 3634.0 | 612 | 607 | 169.4 |
| C | 13 | 3 | 394133 | 2322.69 | 612 | 607 | 169.4 |
| D | 15 | 94 | 6768883 | 117614.69 | 193 | 184 | 57.5 |
| D | 12 | 3 | 4557072 | 79181.68 | 193 | 184 | 57.5 |
| D | 6 | 42 | 2962103 | 51467.08 | 193 | 184 | 57.5 |
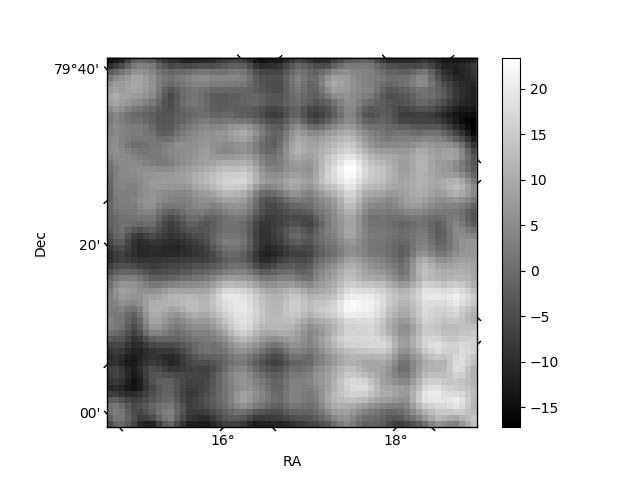
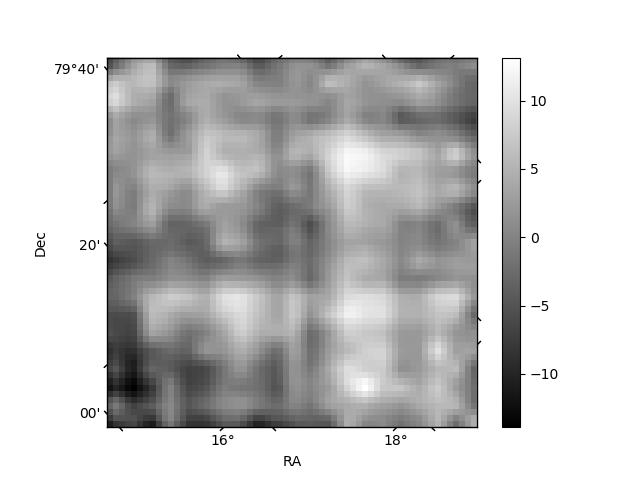
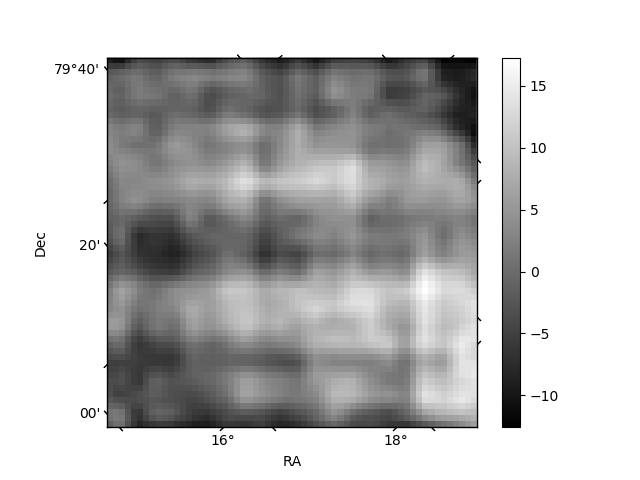
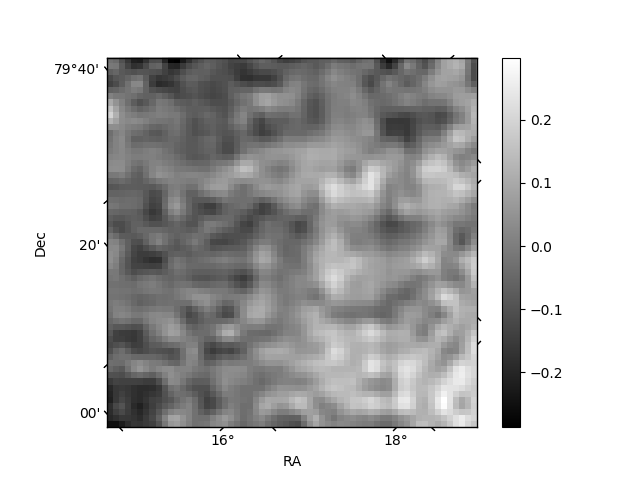
Histogram calculated using DETX and DETY for each event in the final _common_clean file
| Quadrant A | 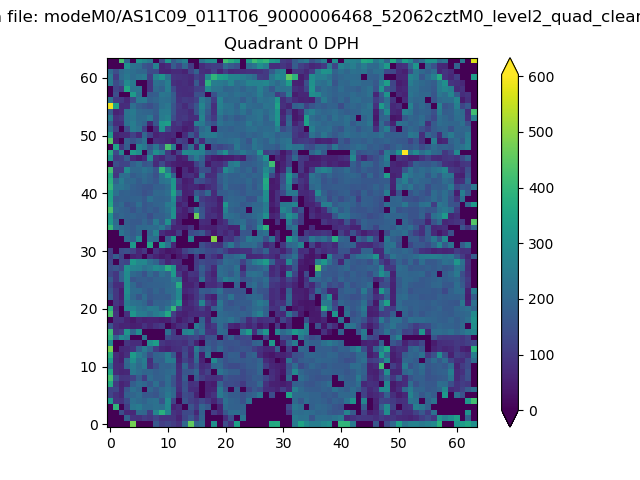 |
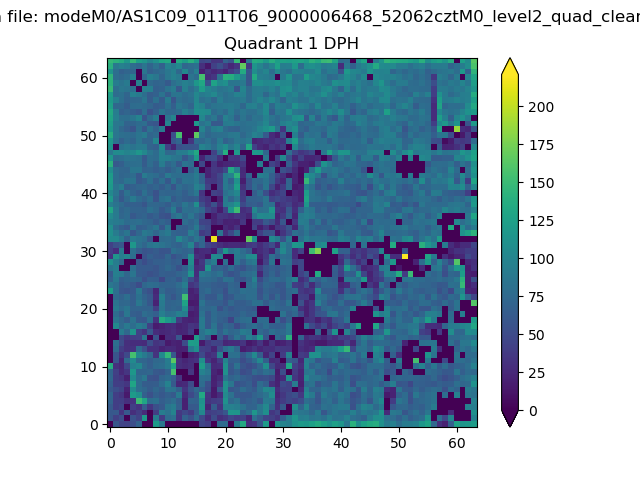 |
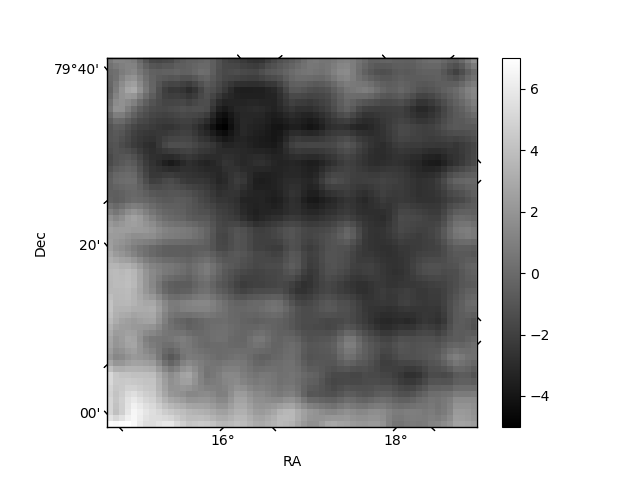
Quadrant B |
|---|---|---|---|
| Quadrant D | 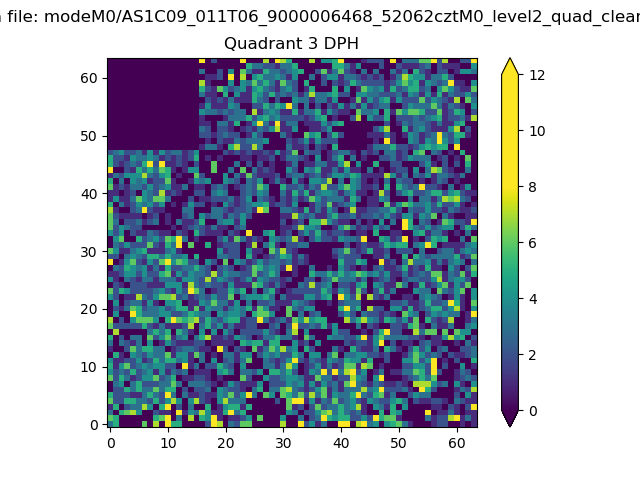 |
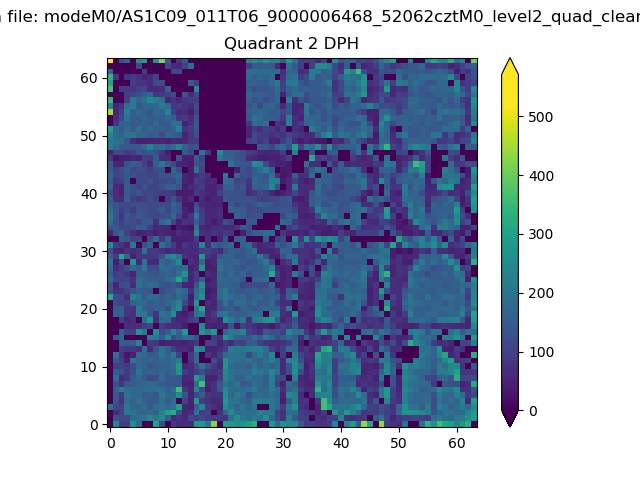 |
Quadrant C |
| Plot type | Count rate plots | Images |
|---|---|---|
| Comparison with Poisson distribution Blue bars denote a histogram of data divided into 1 sec bins. Red curve is a Poisson curve with rate = median count rate of data. |
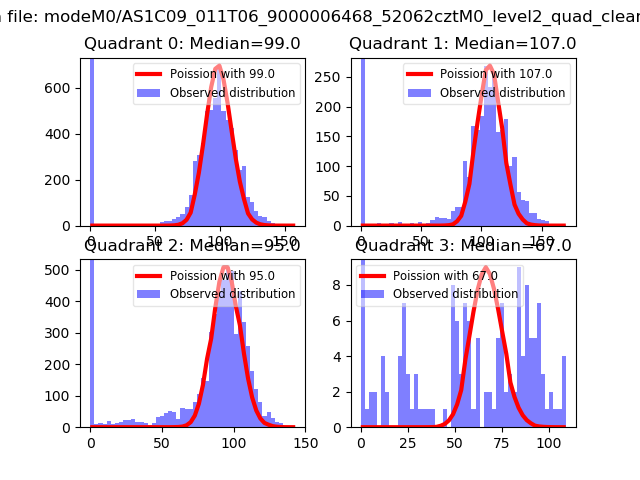 |
 |
| Quadrant-wise count rates Data is divided into 100 sec bins |
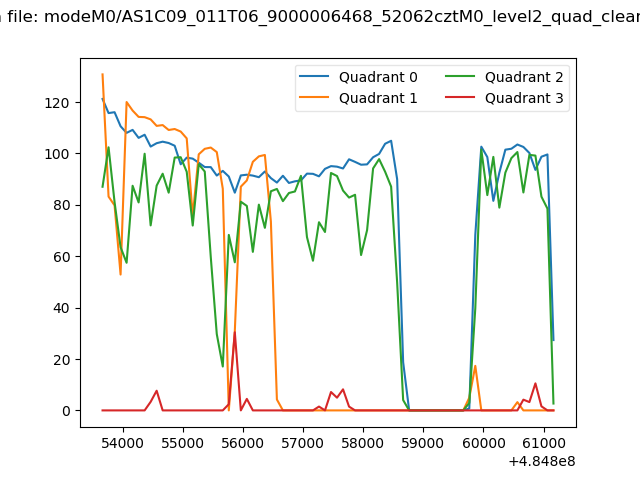 |
|
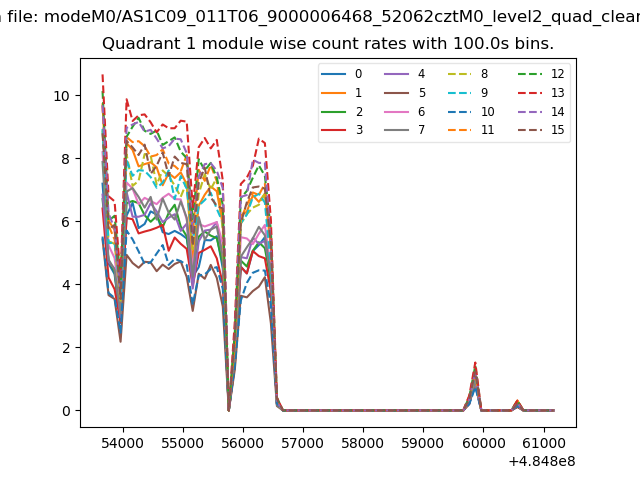
| Module-wise count rates for Quadrant A Data is divided into 100 sec bins |
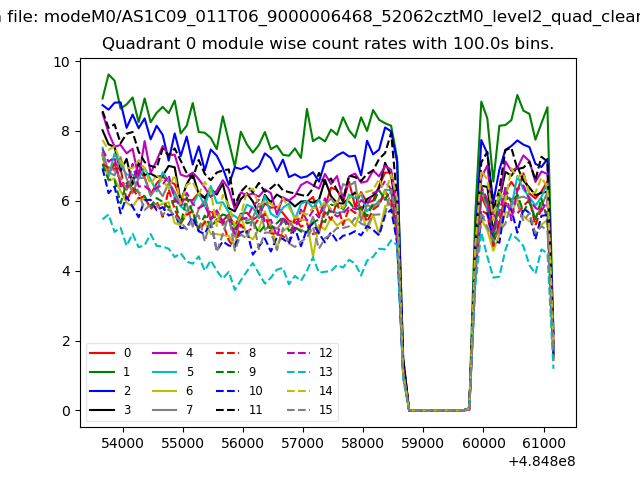 |
 |
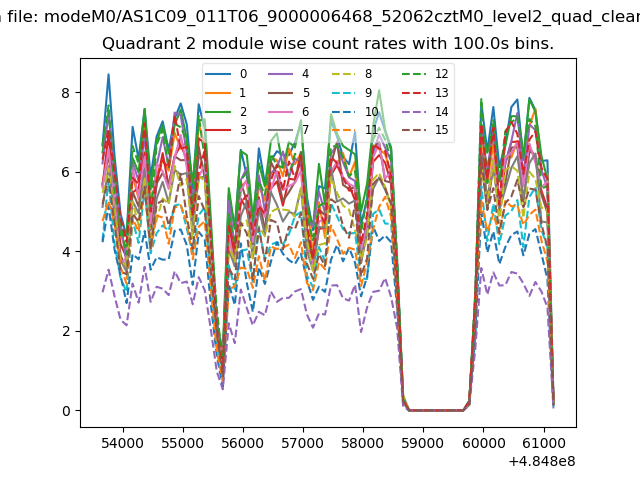
| Module-wise count rates for Quadrant B Data is divided into 100 sec bins |
 |
 |
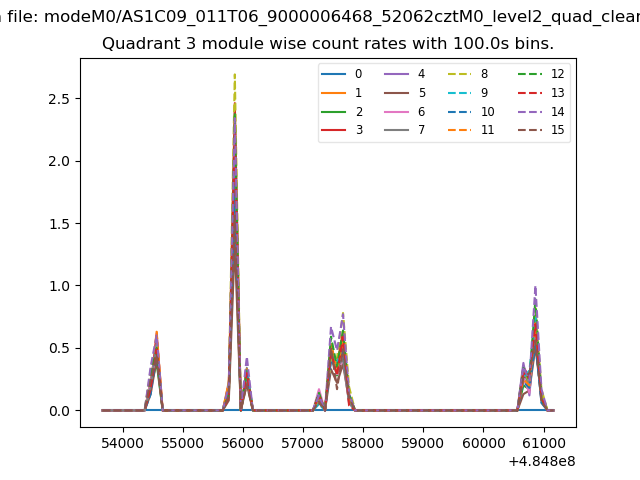
| Module-wise count rates for Quadrant C Data is divided into 100 sec bins |
 |
 |
| Module-wise count rates for Quadrant D Data is divided into 100 sec bins |
 |
 |
| Parameter | Plot |
|---|---|
| CZT HV Monitor | 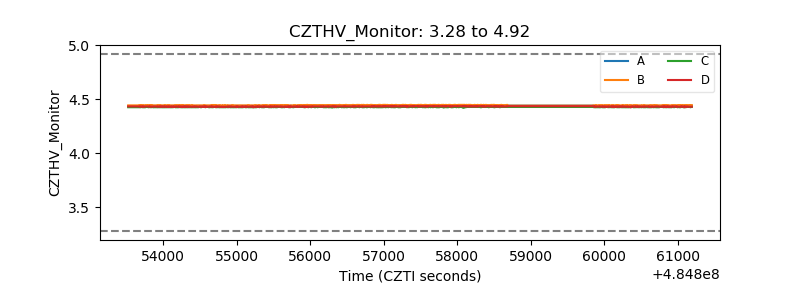 |
| D_VDD | 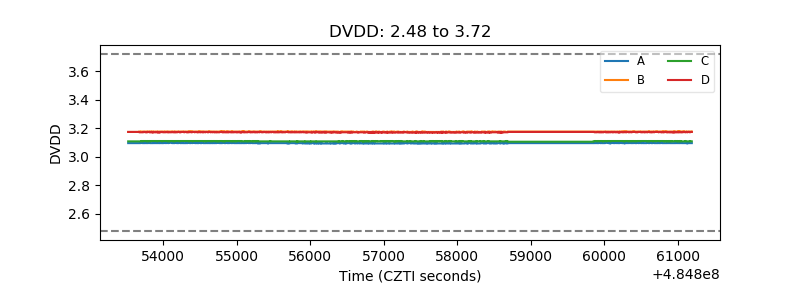 |
| Temperature 1 | 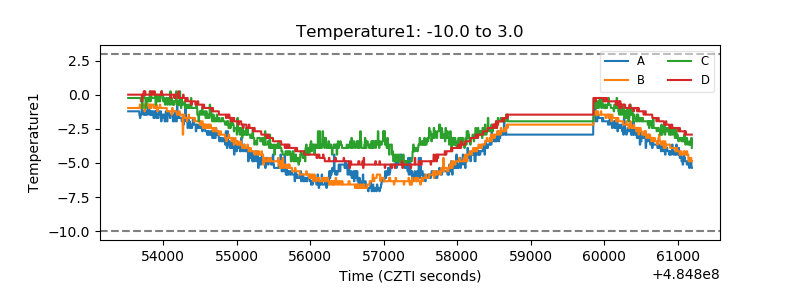 |
| Veto HV Monitor | 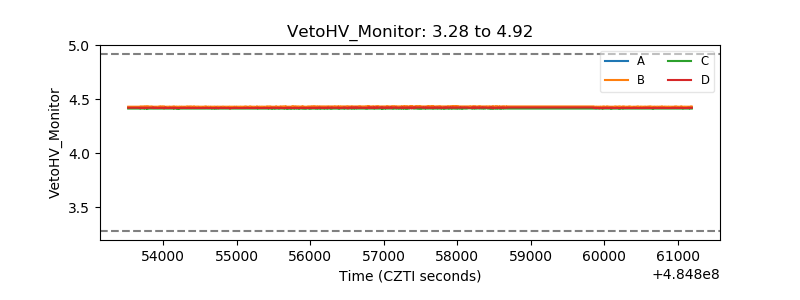 |
| Veto LLD | 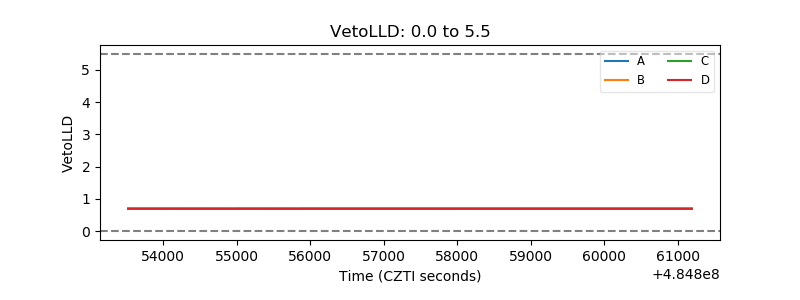 |
| Alpha Counter | 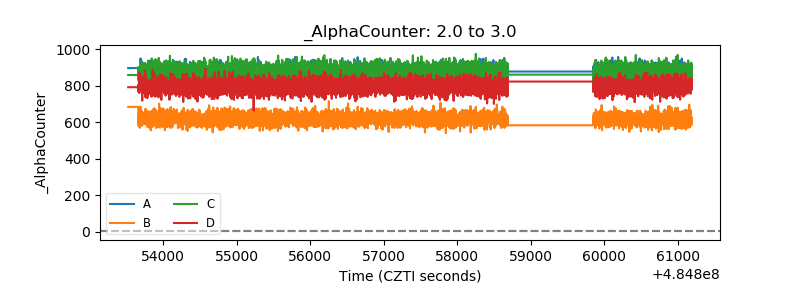 |
| _CPM_Rate | 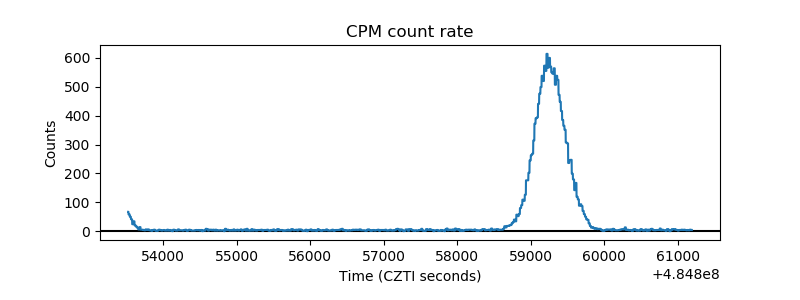 |
| CZT Counter | 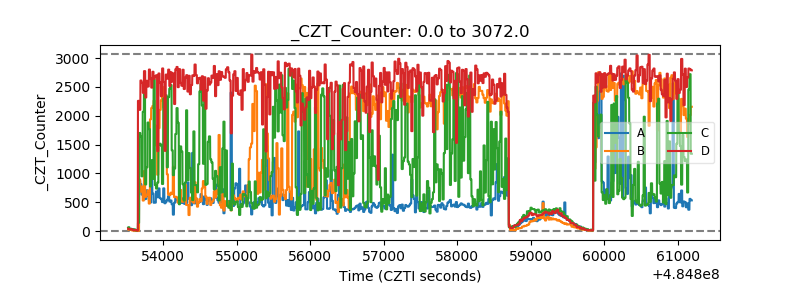 |
| +2.5 Volts monitor | 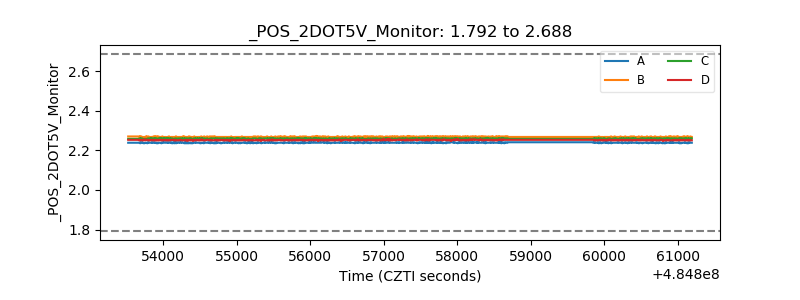 |
| +5 Volts monitor | 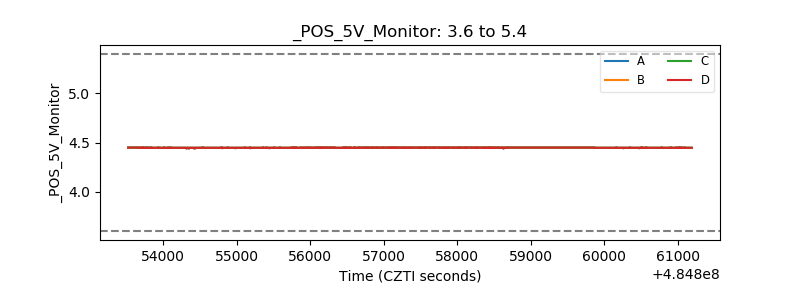 |
| _ROLL_ROT | 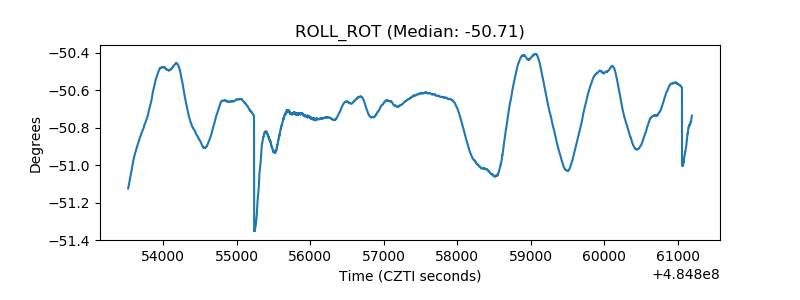 |
| _Roll_DEC | 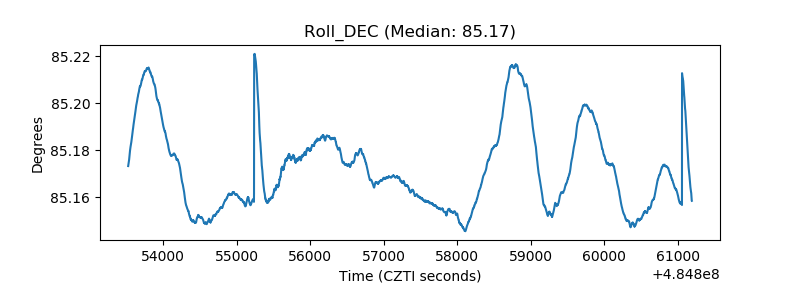 |
| _Roll_RA | 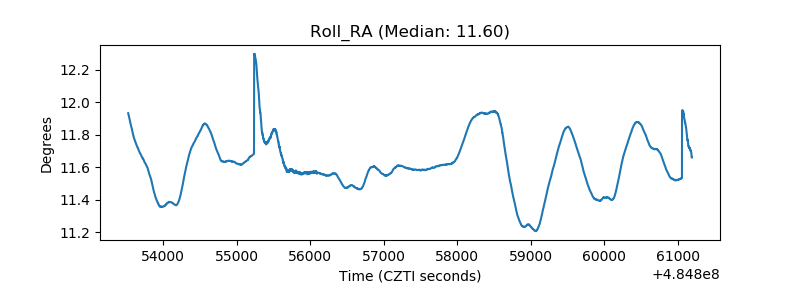 |
| Veto Counter | 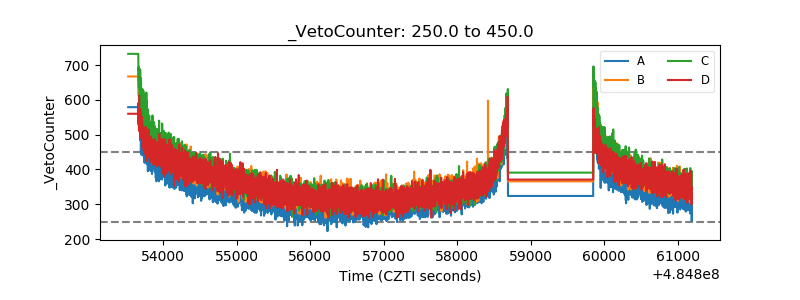 |