| Param | Original file | Final file |
|---|---|---|
| Filename | modeM0/AS1C09_011T06_9000006468_52063cztM0_level2.fits | modeM0/AS1C09_011T06_9000006468_52063cztM0_level2_quad_clean.evt |
| Size (bytes) | 1,263,464,640 | 48,159,360 |
| Size | 1.2 GB | 45.9 MB |
| Events in quadrant A | 4,751,438 | 585,521 |
| Events in quadrant B | 15,188,042 | 1,880 |
| Events in quadrant C | 9,437,956 | 416,875 |
| Events in quadrant D | 16,896,703 | 4,789 |
| Mode M0 | |||
|---|---|---|---|
| Quadrant | BADHDUFLAG | Total packets | Discarded packets |
| A | 0 | 18523 | 1 |
| B | 0 | 49511 | 1 |
| C | 0 | 32440 | 1 |
| D | 0 | 54550 | 1 |
| Mode M9 | |||
|---|---|---|---|
| Quadrant | BADHDUFLAG | Total packets | Discarded packets |
| A | 0 | 11 | 0 |
| B | 0 | 11 | 0 |
| C | 0 | 11 | 0 |
| D | 0 | 11 | 0 |
| Mode SS | |||
|---|---|---|---|
| Quadrant | BADHDUFLAG | Total packets | Discarded packets |
| A | 0 | 130 | 0 |
| B | 0 | 130 | 0 |
| C | 0 | 130 | 0 |
| D | 0 | 130 | 0 |
| Quadrant | Total seconds | Saturated seconds | Saturation percentage |
|---|---|---|---|
| A | 6432 | 439 | 6.825249% |
| B | 6433 | 6424 | 99.860096% |
| C | 6433 | 2390 | 37.152184% |
| D | 6433 | 6397 | 99.440386% |
Noise dominated data is calculated using 1-second bins in cleaned event files. If a bin has >2000 counts, and if more than 50% of those come from <1% of pixels, then it is considered to be noise-dominated and hence unusable.
| Quadrant | # 1 sec bins | Bins with >0 counts | Bins with >2000 counts | High rate bins dominated by noise | Noise dominated (total time) | Noise dominated (detector-on time) | Marked lightcurve |
|---|---|---|---|---|---|---|---|
| A | 7492 | 6433 | 412 | 412 | 5.50% | 6.40% | 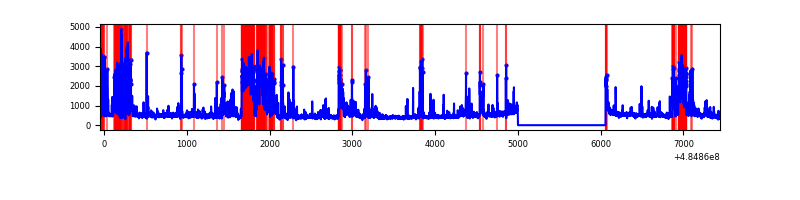 |
| B | 7492 | 6432 | 6067 | 6067 | 80.98% | 94.33% | 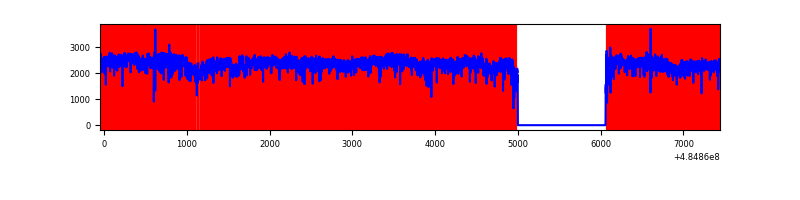 |
| C | 7493 | 6434 | 2052 | 2052 | 27.39% | 31.89% | 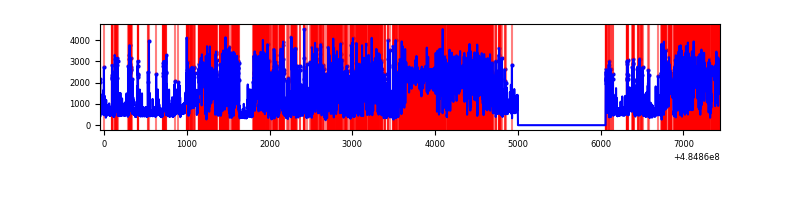 |
| D | 7492 | 6432 | 6227 | 6227 | 83.12% | 96.81% | 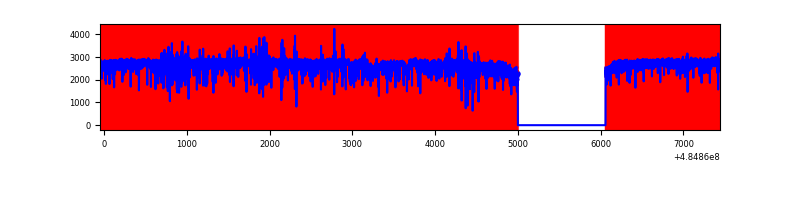 |
Top three noisy pixels from each quadrant. If the there are fewer than three noisy pixels in the level2.evt file, extra rows are filled as -1
| Pixel properties | Quadrant properties | ||||||
|---|---|---|---|---|---|---|---|
| Quadrant | DetID | PixID | Counts | Sigma | Mean | Median | Sigma |
| A | 8 | 43 | 982054 | 6123.3 | 650 | 634 | 160.3 |
| A | 6 | 196 | 238175 | 1482.07 | 650 | 634 | 160.3 |
| A | 11 | 3 | 221503 | 1378.05 | 650 | 634 | 160.3 |
| B | 8 | 3 | 14304727 | 560599.84 | 112 | 108 | 25.5 |
| B | 10 | 254 | 171405 | 6713.15 | 112 | 108 | 25.5 |
| B | 5 | 172 | 134646 | 5272.56 | 112 | 108 | 25.5 |
| C | 15 | 224 | 5014860 | 32948.3 | 544 | 536 | 152.2 |
| C | 15 | 219 | 951851 | 6250.93 | 544 | 536 | 152.2 |
| C | 13 | 3 | 280722 | 1841.06 | 544 | 536 | 152.2 |
| D | 15 | 94 | 9558455 | 172994.43 | 184 | 175 | 55.3 |
| D | 6 | 42 | 2384264 | 43149.41 | 184 | 175 | 55.3 |
| D | 13 | 187 | 1892752 | 34253.58 | 184 | 175 | 55.3 |
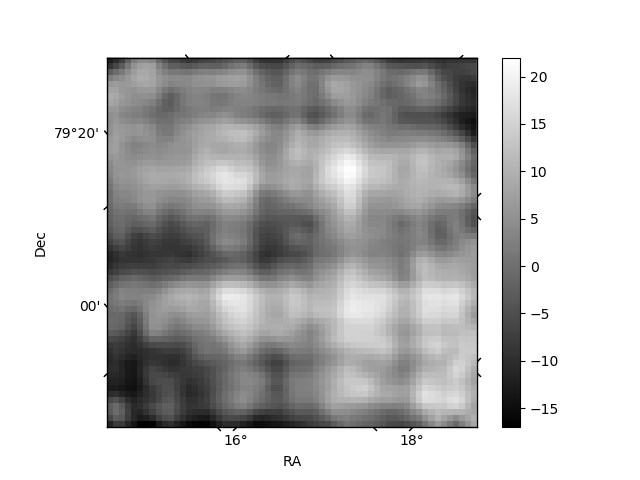
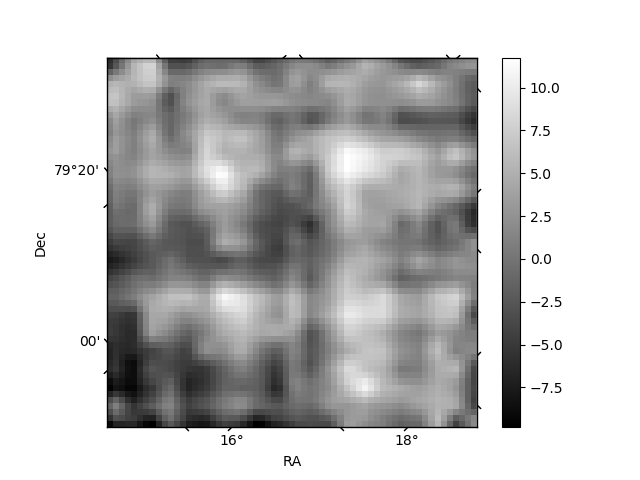
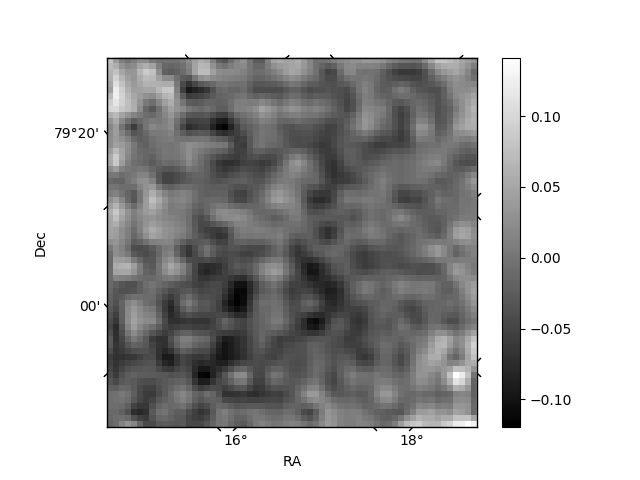
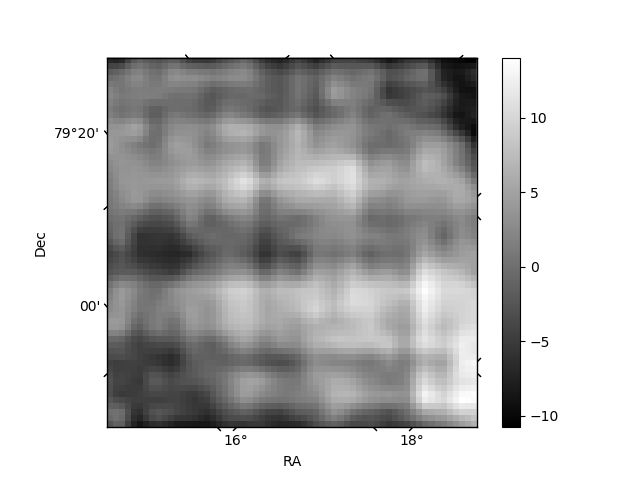
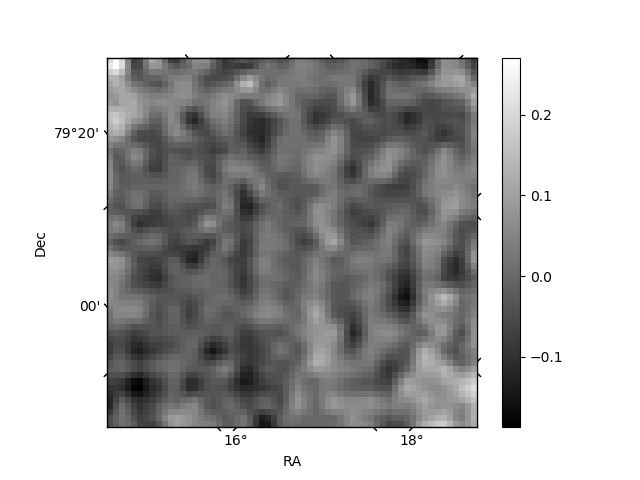
Histogram calculated using DETX and DETY for each event in the final _common_clean file
| Quadrant A | 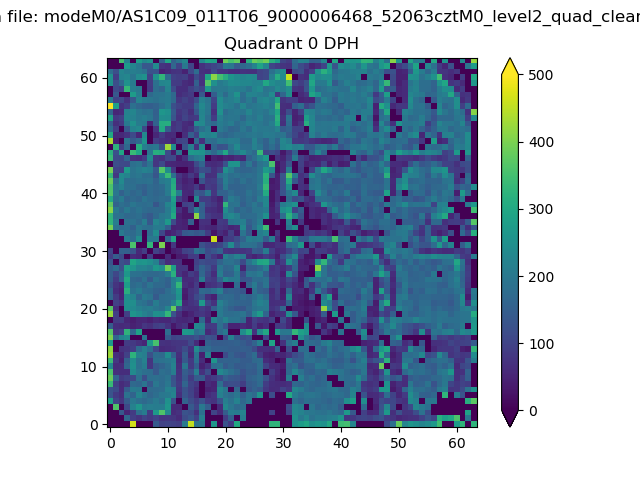 |
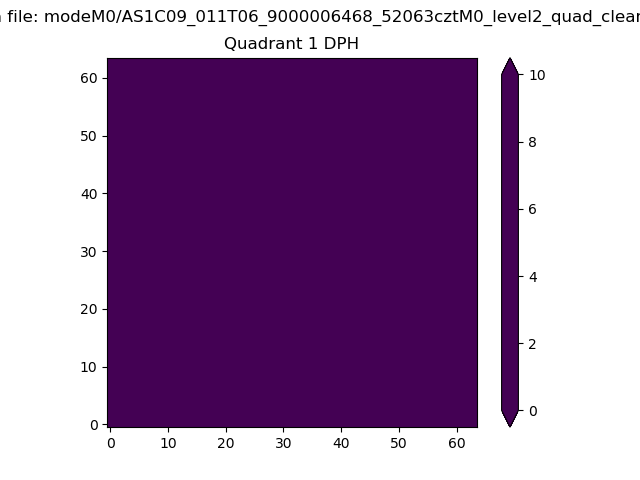 |
Quadrant B |
|---|---|---|---|
| Quadrant D | 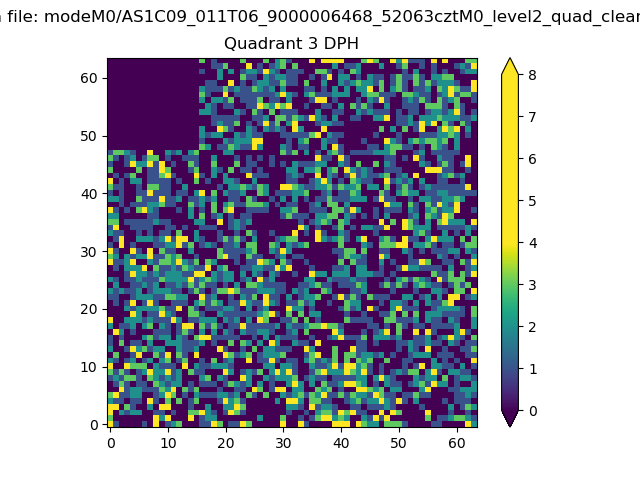 |
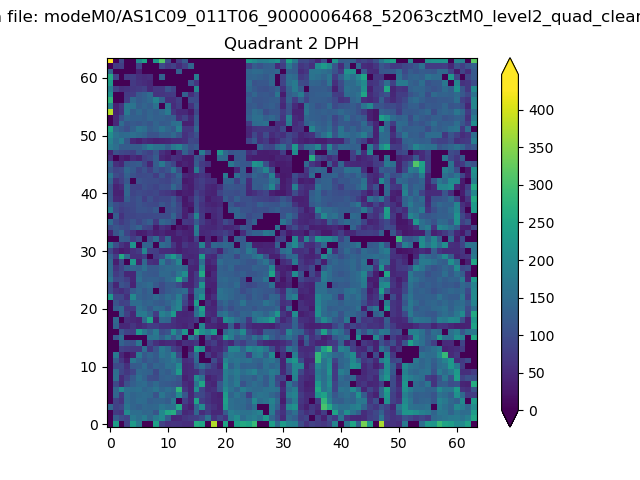 |
Quadrant C |
| Plot type | Count rate plots | Images |
|---|---|---|
| Comparison with Poisson distribution Blue bars denote a histogram of data divided into 1 sec bins. Red curve is a Poisson curve with rate = median count rate of data. |
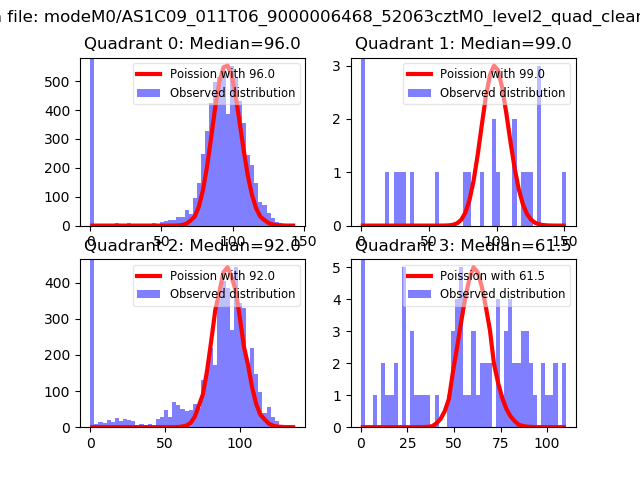 |
 |
| Quadrant-wise count rates Data is divided into 100 sec bins |
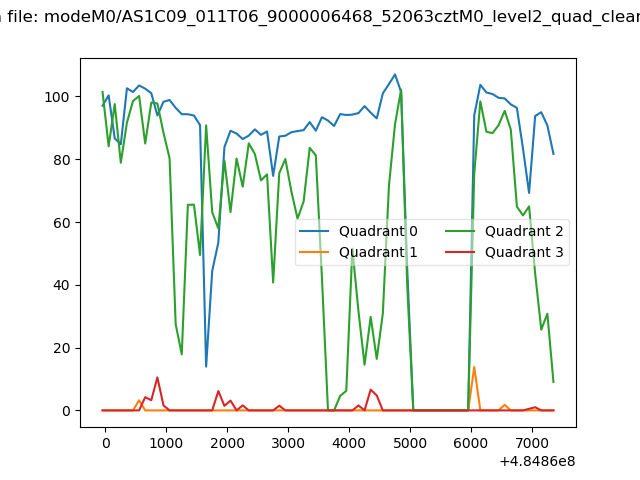 |
|
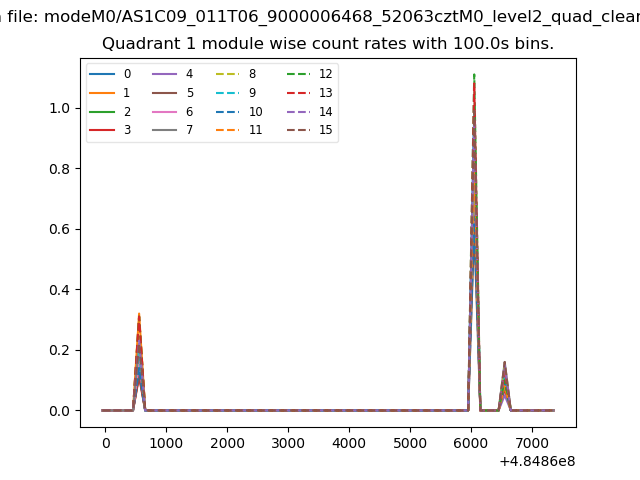
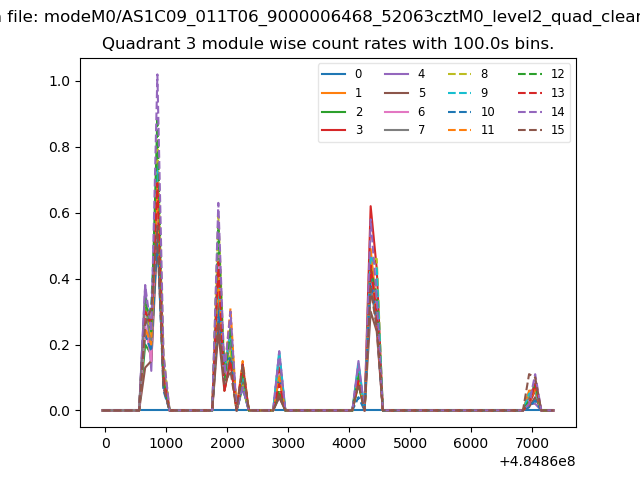
| Module-wise count rates for Quadrant A Data is divided into 100 sec bins |
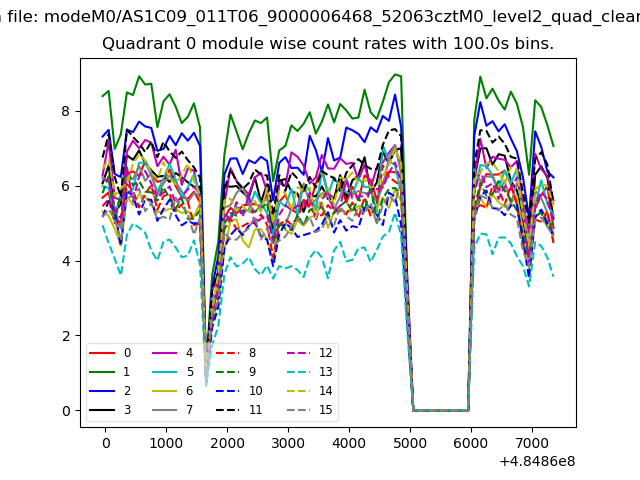 |
 |
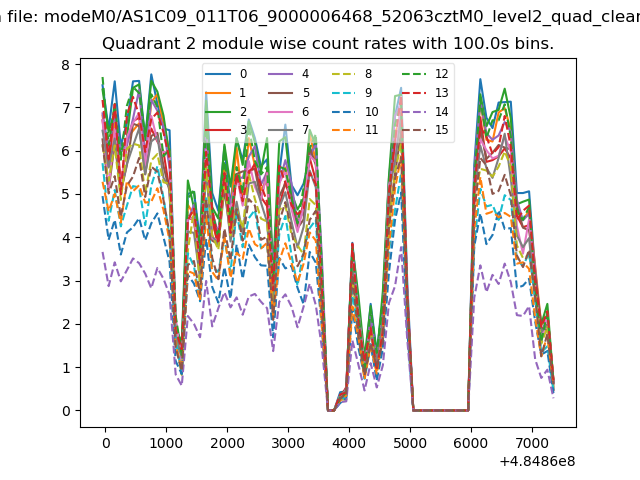
| Module-wise count rates for Quadrant B Data is divided into 100 sec bins |
 |
 |
| Module-wise count rates for Quadrant C Data is divided into 100 sec bins |
 |
 |
| Module-wise count rates for Quadrant D Data is divided into 100 sec bins |
 |
 |
| Parameter | Plot |
|---|---|
| CZT HV Monitor | 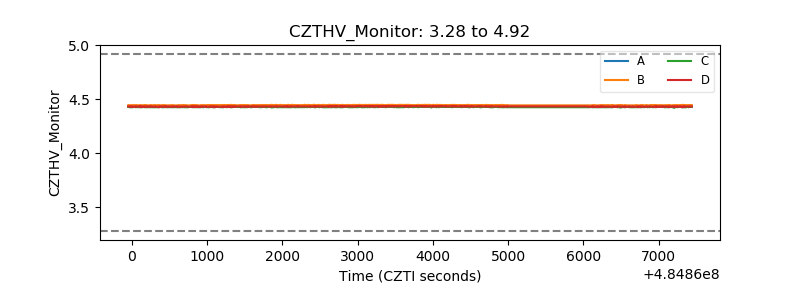 |
| D_VDD | 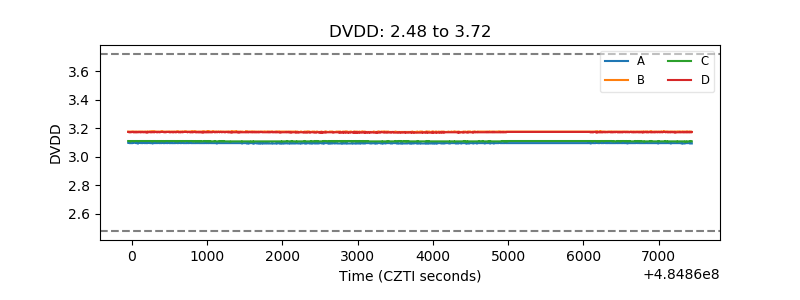 |
| Temperature 1 | 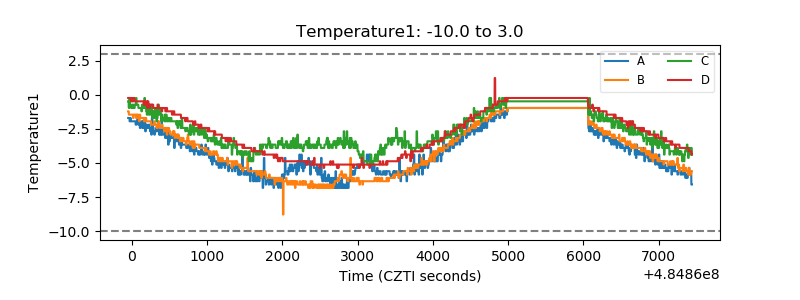 |
| Veto HV Monitor | 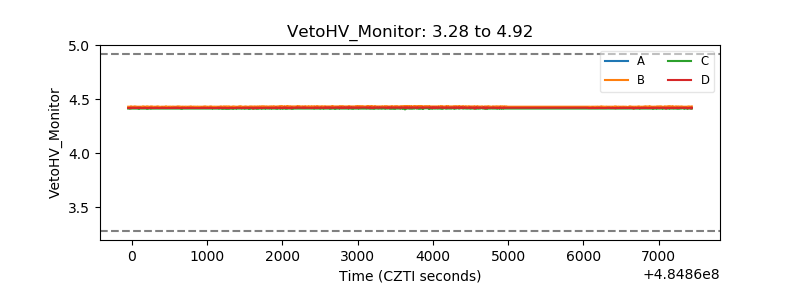 |
| Veto LLD | 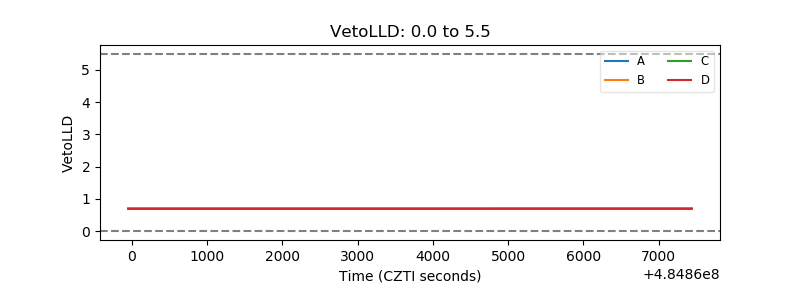 |
| Alpha Counter | 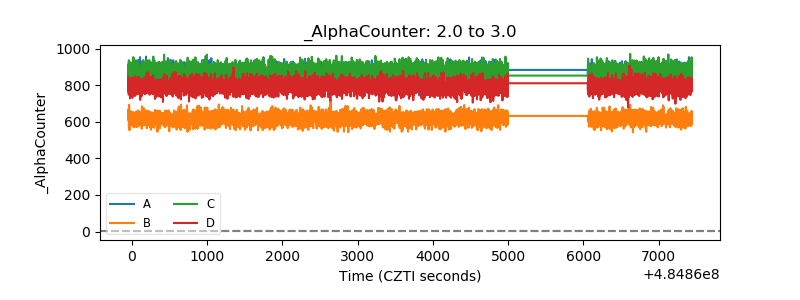 |
| _CPM_Rate | 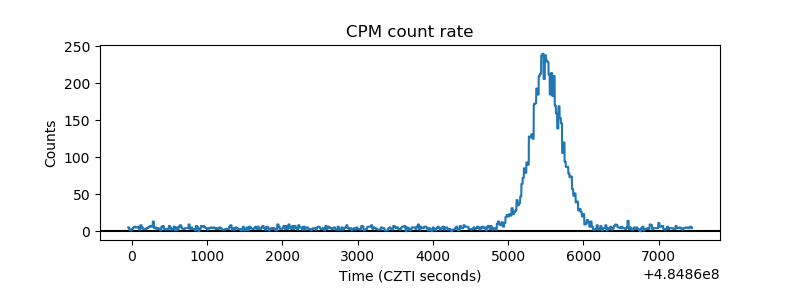 |
| CZT Counter | 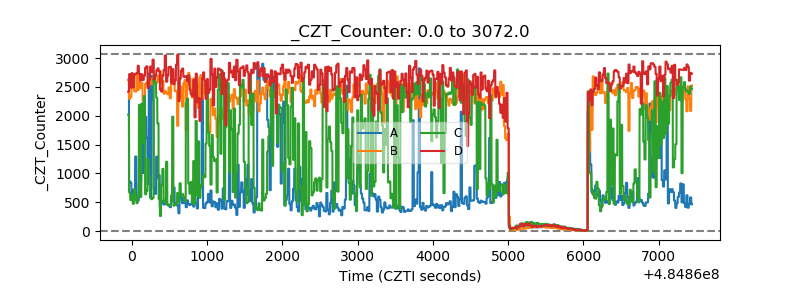 |
| +2.5 Volts monitor | 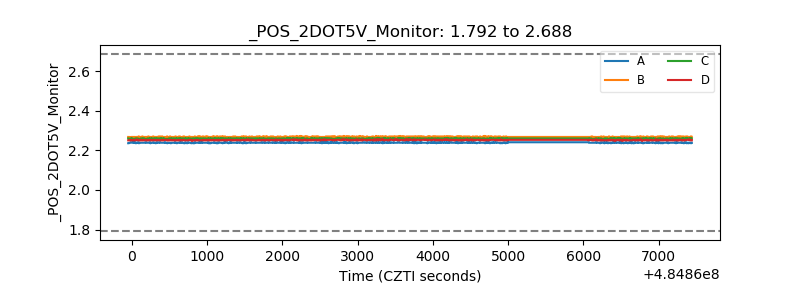 |
| +5 Volts monitor | 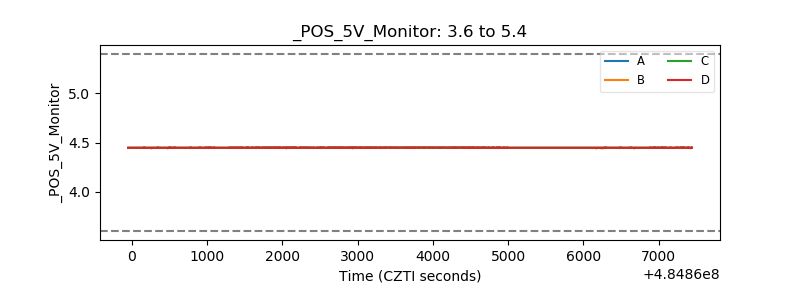 |
| _ROLL_ROT | 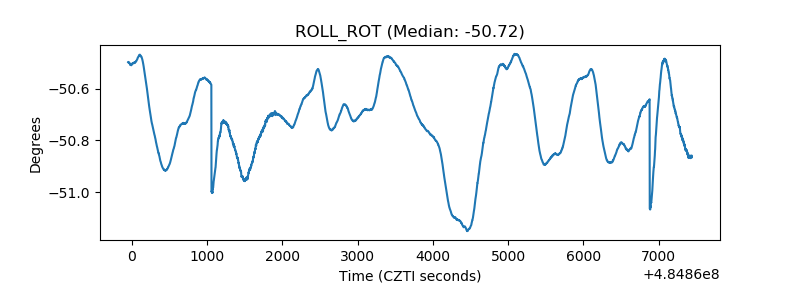 |
| _Roll_DEC | 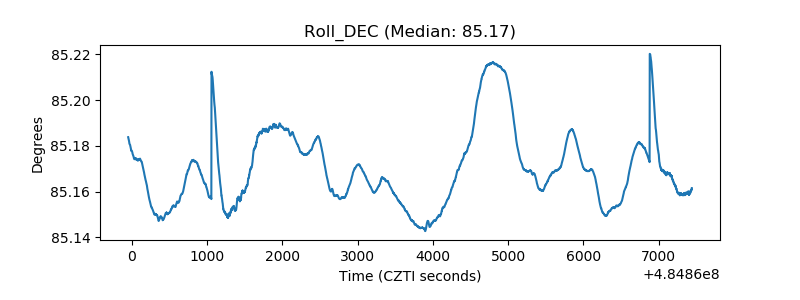 |
| _Roll_RA | 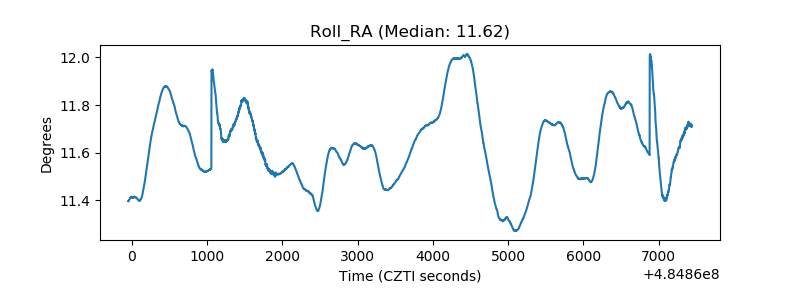 |
| Veto Counter | 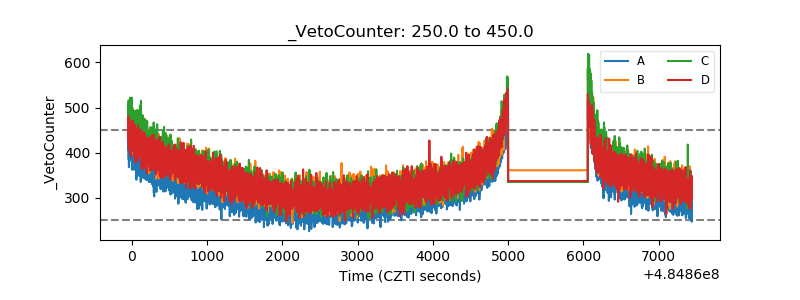 |