| Param | Original file | Final file |
|---|---|---|
| Filename | modeM0/AS1C09_011T06_9000006468_52064cztM0_level2.fits | modeM0/AS1C09_011T06_9000006468_52064cztM0_level2_quad_clean.evt |
| Size (bytes) | 1,418,316,480 | 51,860,160 |
| Size | 1.3 GB | 49.5 MB |
| Events in quadrant A | 7,050,582 | 538,912 |
| Events in quadrant B | 17,010,003 | 1,565 |
| Events in quadrant C | 10,529,612 | 438,166 |
| Events in quadrant D | 17,370,812 | 101,277 |
| Mode M0 | |||
|---|---|---|---|
| Quadrant | BADHDUFLAG | Total packets | Discarded packets |
| A | 0 | 25889 | 2 |
| B | 0 | 55280 | 6 |
| C | 0 | 36154 | 2 |
| D | 0 | 56356 | 2 |
| Mode M9 | |||
|---|---|---|---|
| Quadrant | BADHDUFLAG | Total packets | Discarded packets |
| A | 0 | 9 | 0 |
| B | 0 | 10 | 0 |
| C | 0 | 10 | 0 |
| D | 0 | 10 | 0 |
| Mode SS | |||
|---|---|---|---|
| Quadrant | BADHDUFLAG | Total packets | Discarded packets |
| A | 0 | 142 | 0 |
| B | 0 | 142 | 0 |
| C | 0 | 142 | 0 |
| D | 0 | 142 | 0 |
| Quadrant | Total seconds | Saturated seconds | Saturation percentage |
|---|---|---|---|
| A | 7035 | 1353 | 19.232409% |
| B | 7034 | 7027 | 99.900483% |
| C | 7034 | 2629 | 37.375604% |
| D | 7034 | 6025 | 85.655388% |
Noise dominated data is calculated using 1-second bins in cleaned event files. If a bin has >2000 counts, and if more than 50% of those come from <1% of pixels, then it is considered to be noise-dominated and hence unusable.
| Quadrant | # 1 sec bins | Bins with >0 counts | Bins with >2000 counts | High rate bins dominated by noise | Noise dominated (total time) | Noise dominated (detector-on time) | Marked lightcurve |
|---|---|---|---|---|---|---|---|
| A | 7750 | 7036 | 1189 | 1189 | 15.34% | 16.90% | 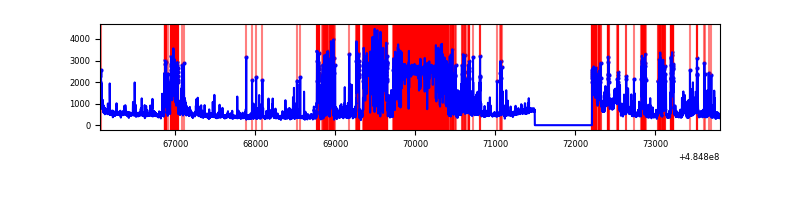 |
| B | 7748 | 7033 | 6816 | 6816 | 87.97% | 96.91% | 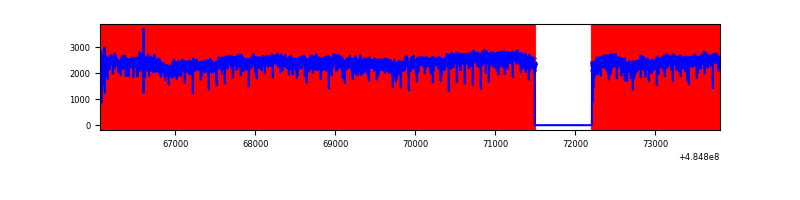 |
| C | 7749 | 7035 | 2270 | 2270 | 29.29% | 32.27% | 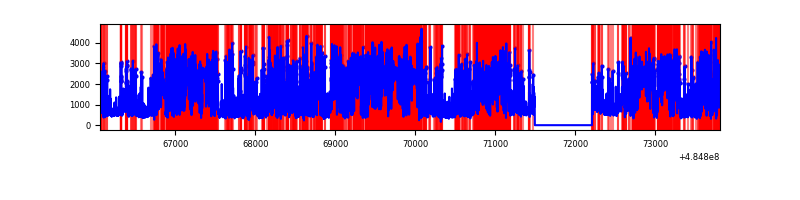 |
| D | 7748 | 7034 | 5880 | 5880 | 75.89% | 83.59% | 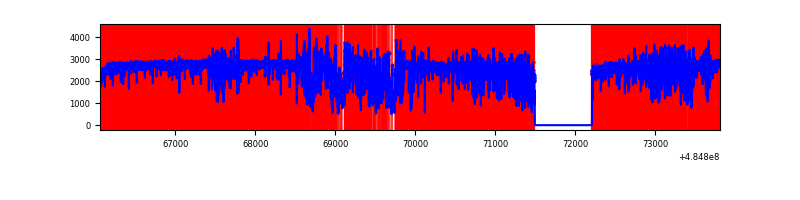 |
Top three noisy pixels from each quadrant. If the there are fewer than three noisy pixels in the level2.evt file, extra rows are filled as -1
| Pixel properties | Quadrant properties | ||||||
|---|---|---|---|---|---|---|---|
| Quadrant | DetID | PixID | Counts | Sigma | Mean | Median | Sigma |
| A | 6 | 196 | 3586735 | 22101.64 | 649 | 633 | 162.3 |
| A | 8 | 43 | 295417 | 1816.79 | 649 | 633 | 162.3 |
| A | 4 | 3 | 130090 | 797.86 | 649 | 633 | 162.3 |
| B | 8 | 3 | 14935861 | 551447.41 | 115 | 111 | 27.1 |
| B | 10 | 254 | 1137589 | 41997.17 | 115 | 111 | 27.1 |
| B | 5 | 172 | 319490 | 11791.89 | 115 | 111 | 27.1 |
| C | 15 | 224 | 6595814 | 40541.36 | 589 | 583 | 162.7 |
| C | 15 | 215 | 364416 | 2236.51 | 589 | 583 | 162.7 |
| C | 13 | 3 | 342077 | 2099.19 | 589 | 583 | 162.7 |
| D | 15 | 94 | 10348801 | 103018.7 | 338 | 322 | 100.5 |
| D | 6 | 42 | 2989720 | 29759.34 | 338 | 322 | 100.5 |
| D | 12 | 1 | 1348601 | 13422.06 | 338 | 322 | 100.5 |
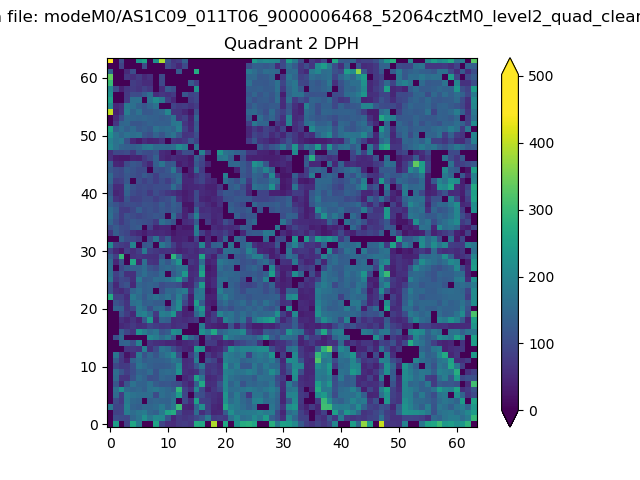
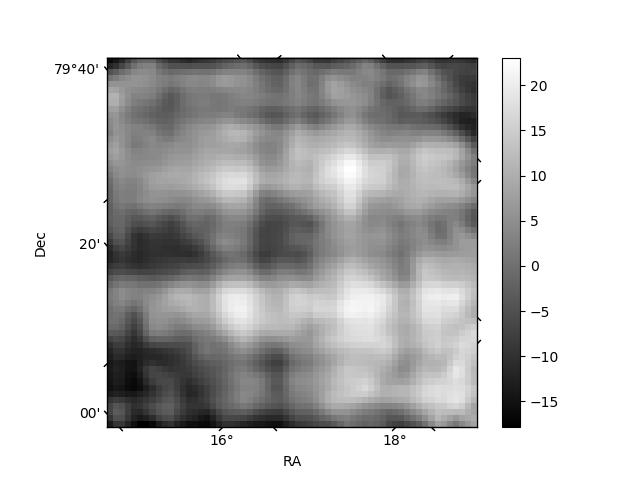
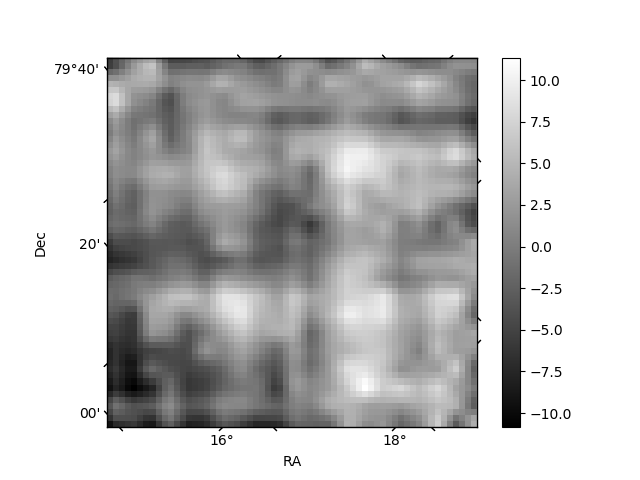
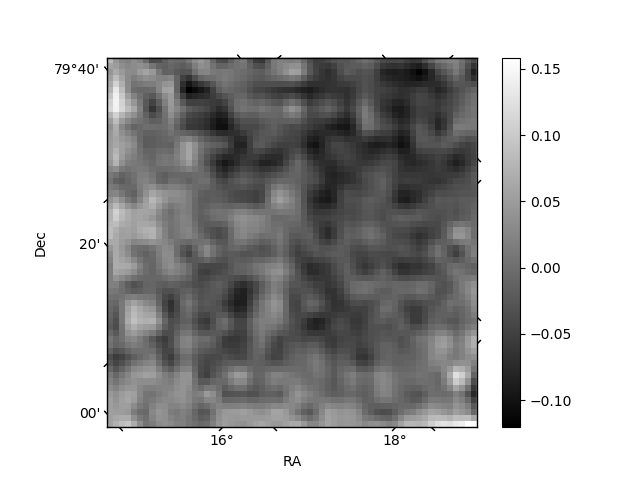
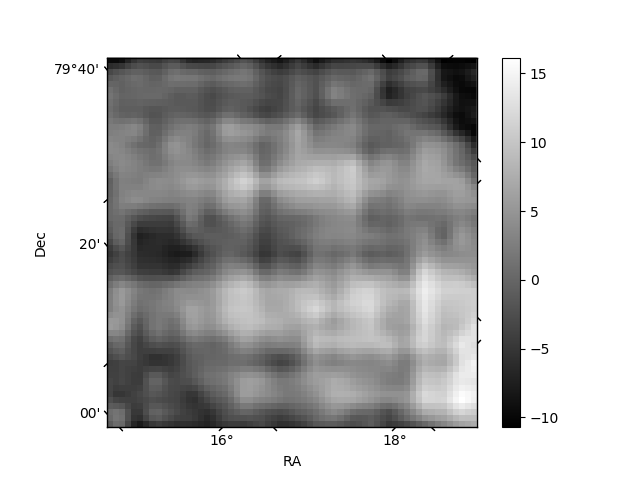
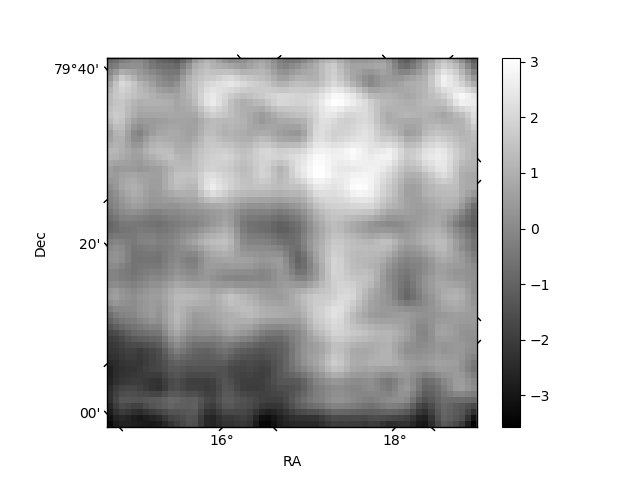
Histogram calculated using DETX and DETY for each event in the final _common_clean file
| Quadrant A | 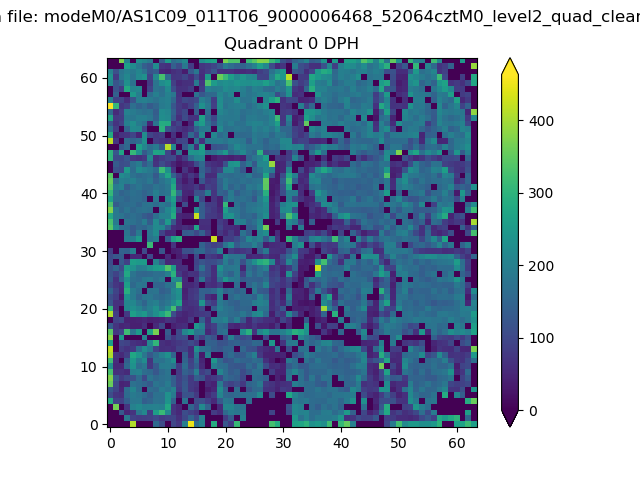 |
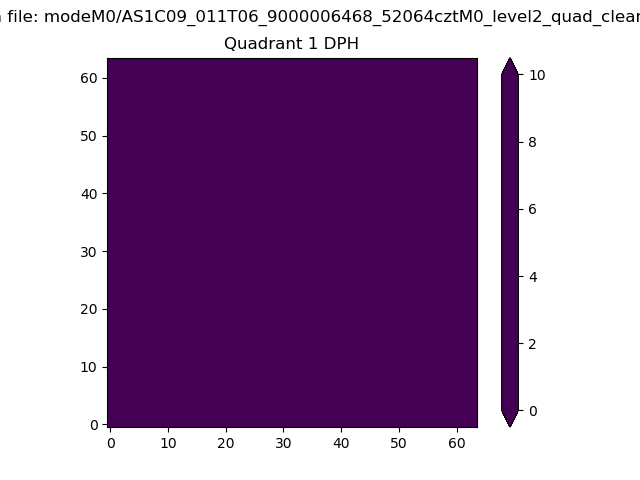 |
Quadrant B |
|---|---|---|---|
| Quadrant D | 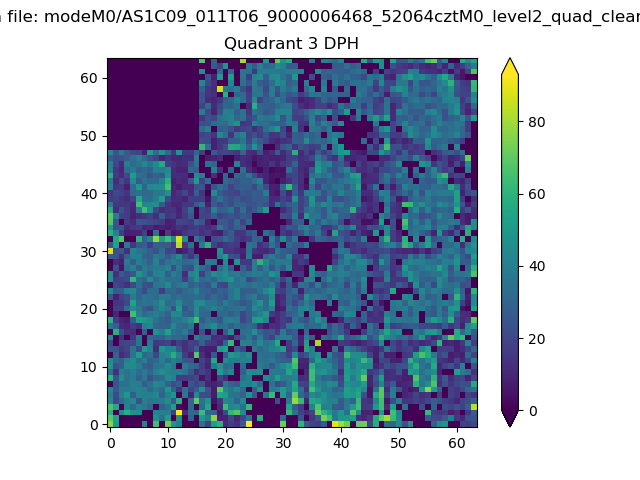 |
 |
Quadrant C |
| Plot type | Count rate plots | Images |
|---|---|---|
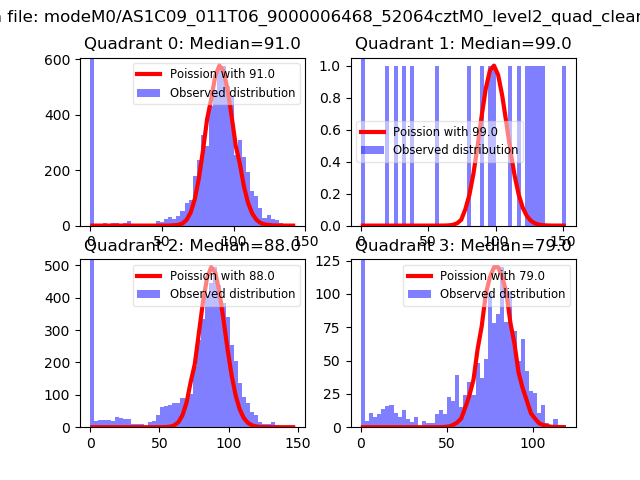
| Comparison with Poisson distribution Blue bars denote a histogram of data divided into 1 sec bins. Red curve is a Poisson curve with rate = median count rate of data. |
 |
 |
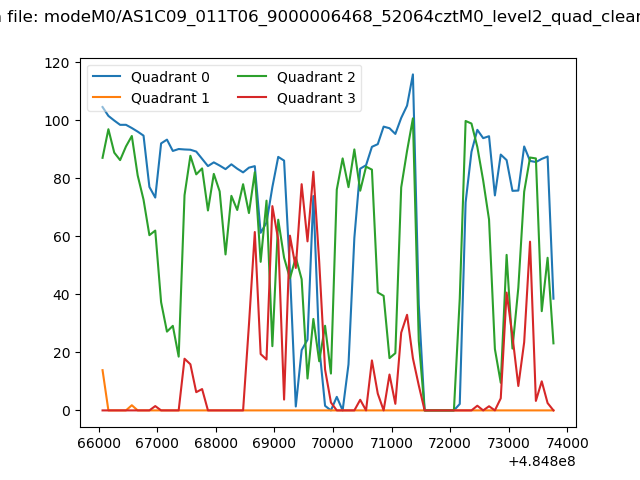
| Quadrant-wise count rates Data is divided into 100 sec bins |
 |
|
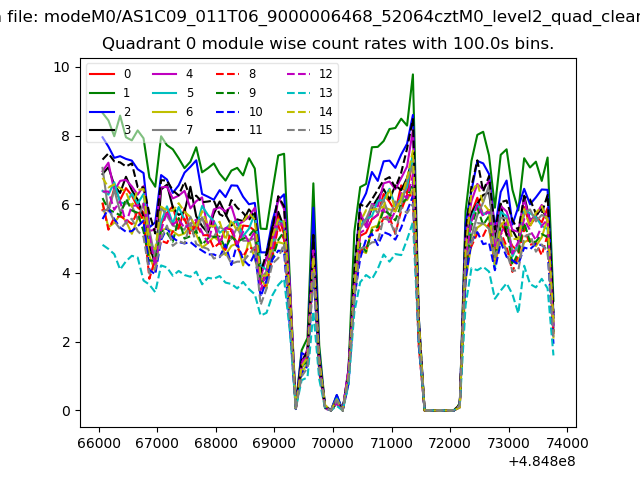
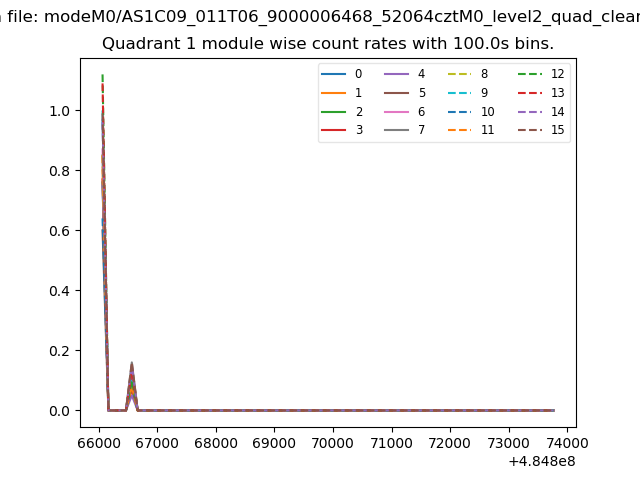
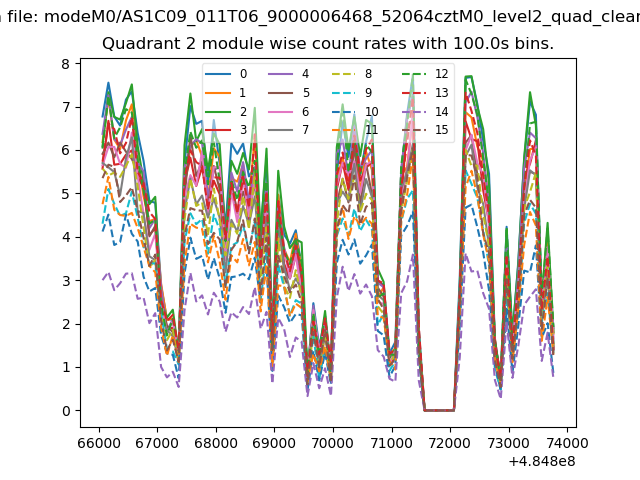
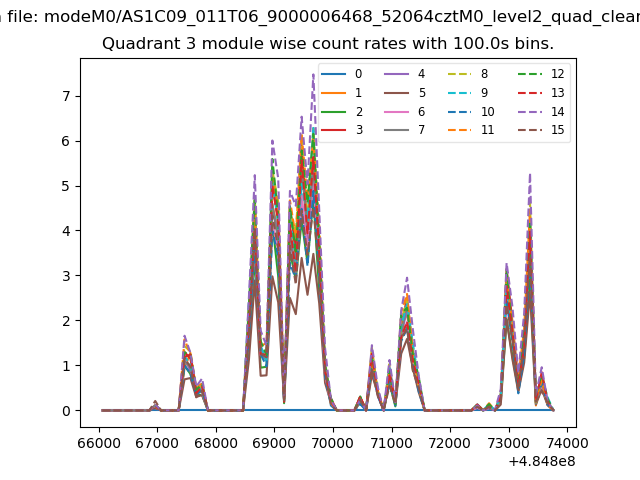
| Module-wise count rates for Quadrant A Data is divided into 100 sec bins |
 |
 |
| Module-wise count rates for Quadrant B Data is divided into 100 sec bins |
 |
 |
| Module-wise count rates for Quadrant C Data is divided into 100 sec bins |
 |
 |
| Module-wise count rates for Quadrant D Data is divided into 100 sec bins |
 |
 |
| Parameter | Plot |
|---|---|
| CZT HV Monitor | 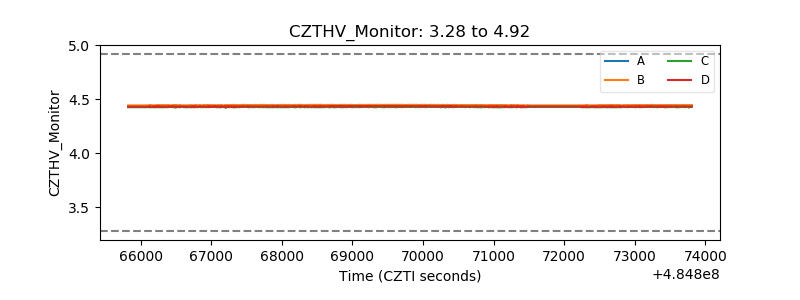 |
| D_VDD | 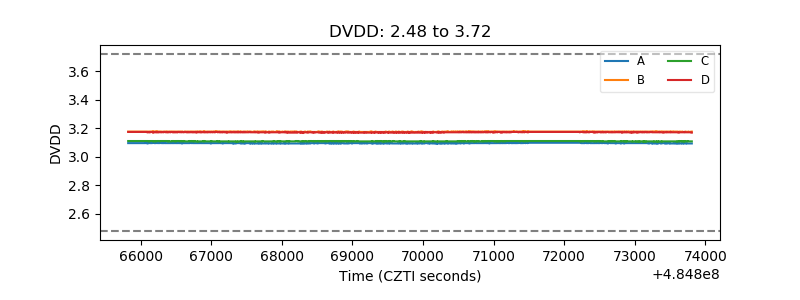 |
| Temperature 1 | 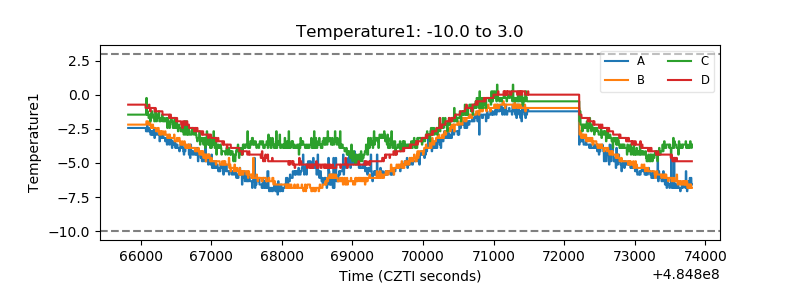 |
| Veto HV Monitor | 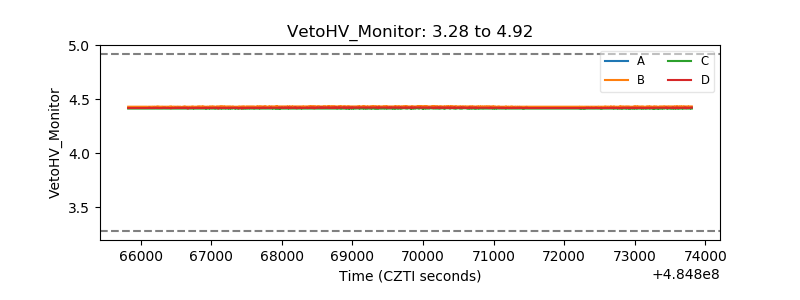 |
| Veto LLD | 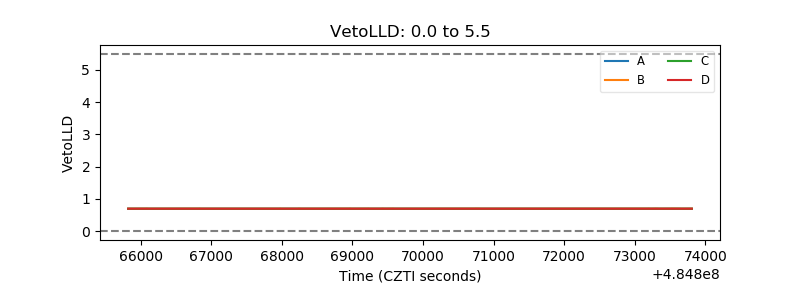 |
| Alpha Counter | 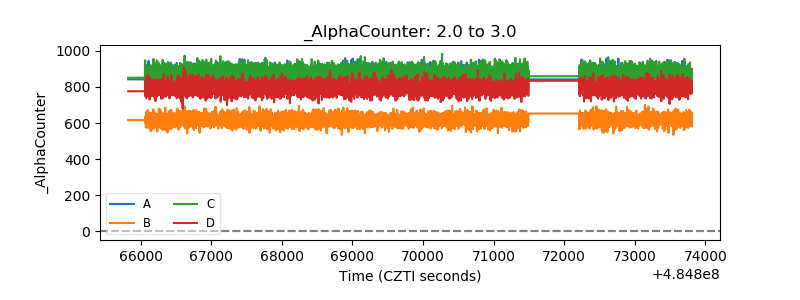 |
| _CPM_Rate | 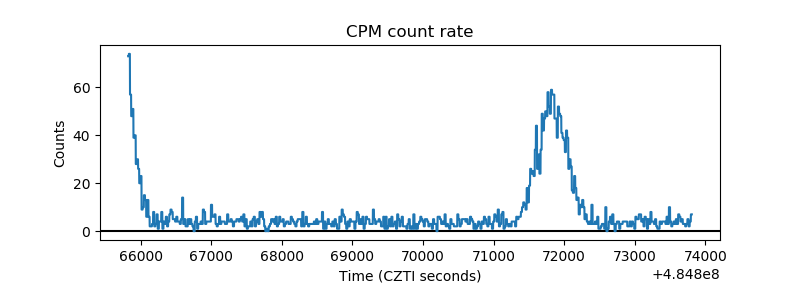 |
| CZT Counter | 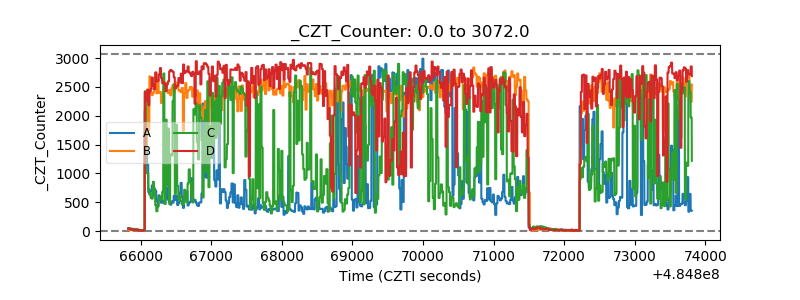 |
| +2.5 Volts monitor | 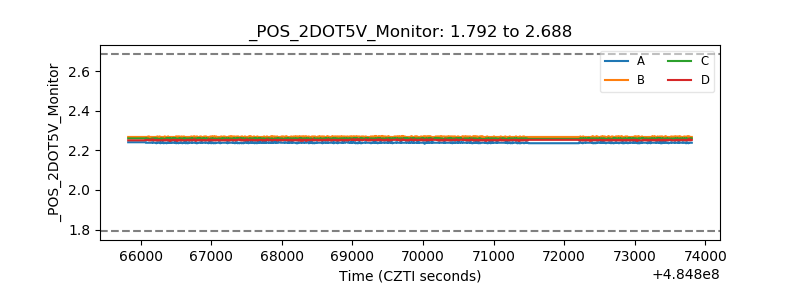 |
| +5 Volts monitor | 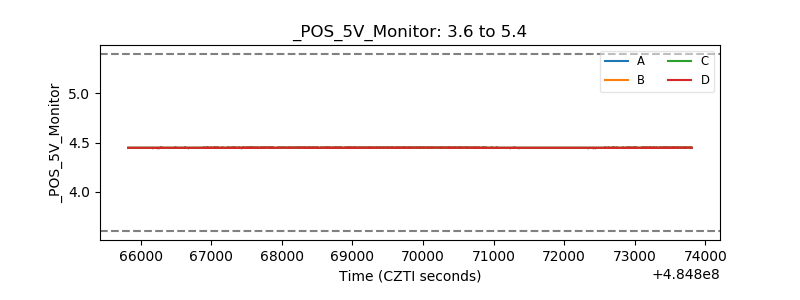 |
| _ROLL_ROT | 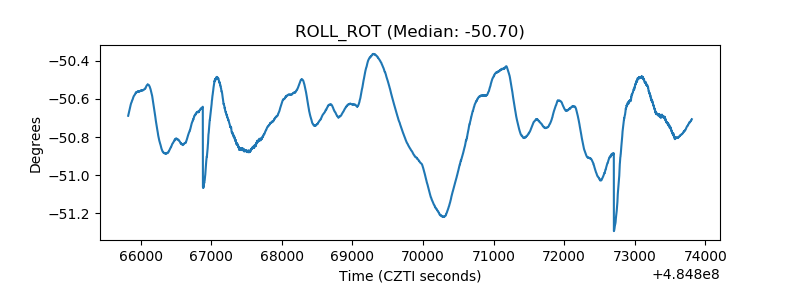 |
| _Roll_DEC | 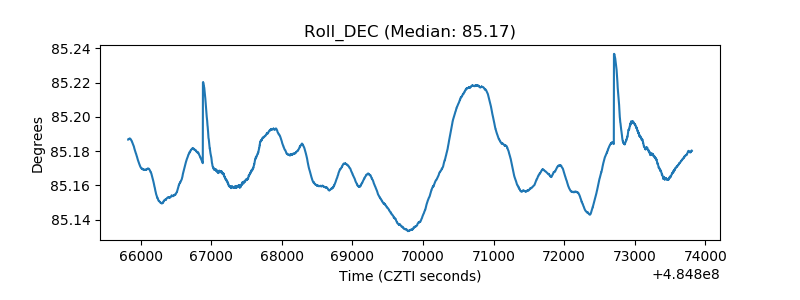 |
| _Roll_RA | 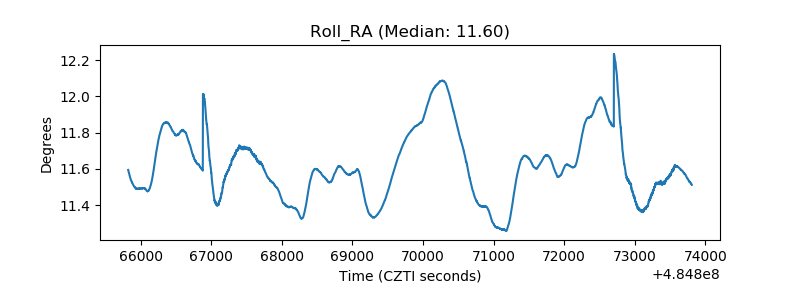 |
| Veto Counter | 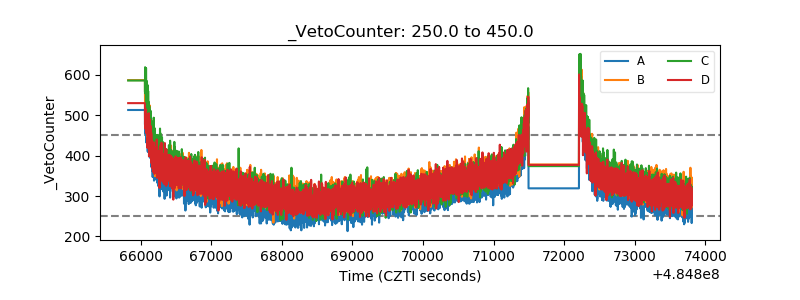 |