| Param | Original file | Final file |
|---|---|---|
| Filename | modeM0/AS1C09_011T06_9000006468_52071cztM0_level2.fits | modeM0/AS1C09_011T06_9000006468_52071cztM0_level2_quad_clean.evt |
| Size (bytes) | 774,506,880 | 44,864,640 |
| Size | 738.6 MB | 42.8 MB |
| Events in quadrant A | 4,346,974 | 357,536 |
| Events in quadrant B | 6,701,314 | 289,513 |
| Events in quadrant C | 6,465,708 | 286,720 |
| Events in quadrant D | 10,803,615 | 104,133 |
| Mode M0 | |||
|---|---|---|---|
| Quadrant | BADHDUFLAG | Total packets | Discarded packets |
| A | 0 | 16058 | 0 |
| B | 0 | 23037 | 0 |
| C | 0 | 22342 | 0 |
| D | 0 | 35190 | 0 |
| Mode M9 | |||
|---|---|---|---|
| Quadrant | BADHDUFLAG | Total packets | Discarded packets |
| A | 0 | 8 | 0 |
| B | 0 | 8 | 0 |
| C | 0 | 8 | 0 |
| D | 0 | 8 | 0 |
| Mode SS | |||
|---|---|---|---|
| Quadrant | BADHDUFLAG | Total packets | Discarded packets |
| A | 0 | 92 | 0 |
| B | 0 | 92 | 0 |
| C | 0 | 92 | 0 |
| D | 0 | 92 | 0 |
| Quadrant | Total seconds | Saturated seconds | Saturation percentage |
|---|---|---|---|
| A | 4554 | 784 | 17.215635% |
| B | 4554 | 1798 | 39.481774% |
| C | 4555 | 1622 | 35.609221% |
| D | 4555 | 3511 | 77.080132% |
Noise dominated data is calculated using 1-second bins in cleaned event files. If a bin has >2000 counts, and if more than 50% of those come from <1% of pixels, then it is considered to be noise-dominated and hence unusable.
| Quadrant | # 1 sec bins | Bins with >0 counts | Bins with >2000 counts | High rate bins dominated by noise | Noise dominated (total time) | Noise dominated (detector-on time) | Marked lightcurve |
|---|---|---|---|---|---|---|---|
| A | 4554 | 4554 | 733 | 733 | 16.10% | 16.10% | 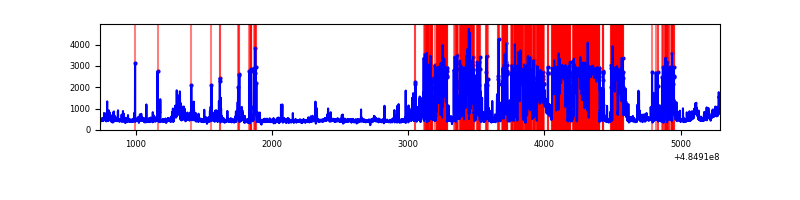 |
| B | 4554 | 4554 | 1610 | 1610 | 35.35% | 35.35% | 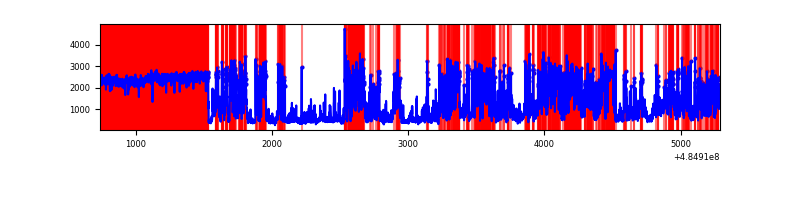 |
| C | 4554 | 4554 | 1268 | 1268 | 27.84% | 27.84% | 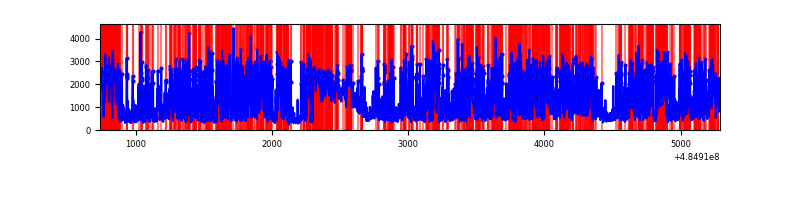 |
| D | 4554 | 4554 | 3558 | 3558 | 78.13% | 78.13% | 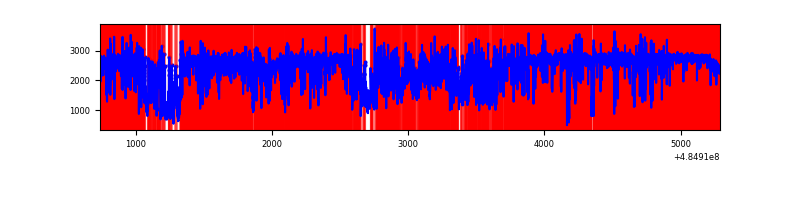 |
Top three noisy pixels from each quadrant. If the there are fewer than three noisy pixels in the level2.evt file, extra rows are filled as -1
| Pixel properties | Quadrant properties | ||||||
|---|---|---|---|---|---|---|---|
| Quadrant | DetID | PixID | Counts | Sigma | Mean | Median | Sigma |
| A | 3 | 95 | 1904915 | 17793.68 | 421 | 410 | 107.0 |
| A | 6 | 196 | 187483 | 1747.81 | 421 | 410 | 107.0 |
| A | 4 | 249 | 81545 | 758.04 | 421 | 410 | 107.0 |
| B | 10 | 128 | 3052806 | 40673.71 | 350 | 338 | 75.0 |
| B | 8 | 3 | 1752258 | 23344.09 | 350 | 338 | 75.0 |
| B | 5 | 185 | 136198 | 1810.32 | 350 | 338 | 75.0 |
| C | 15 | 224 | 4342095 | 41781.89 | 371 | 367 | 103.9 |
| C | 13 | 3 | 225443 | 2165.98 | 371 | 367 | 103.9 |
| C | 5 | 80 | 134814 | 1293.83 | 371 | 367 | 103.9 |
| D | 6 | 42 | 4250006 | 52813.5 | 275 | 262 | 80.5 |
| D | 15 | 94 | 3503281 | 43533.61 | 275 | 262 | 80.5 |
| D | 8 | 176 | 475843 | 5910.26 | 275 | 262 | 80.5 |
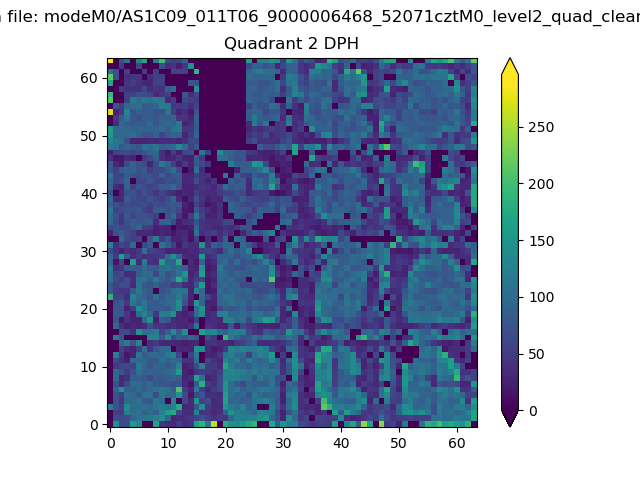
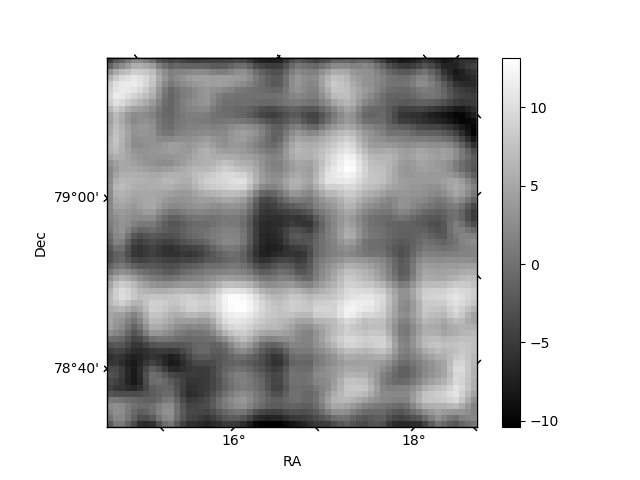
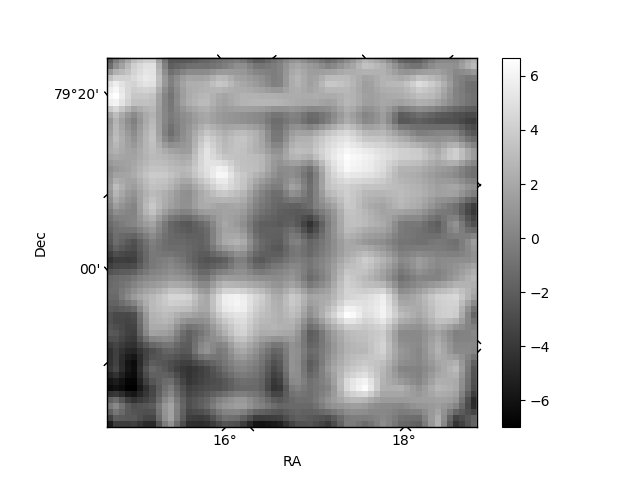
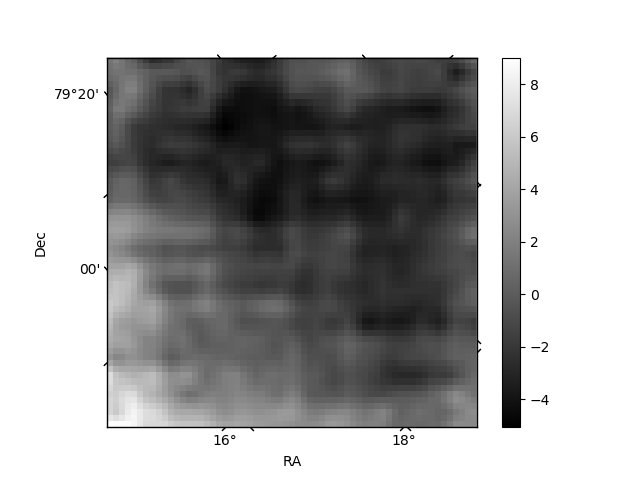
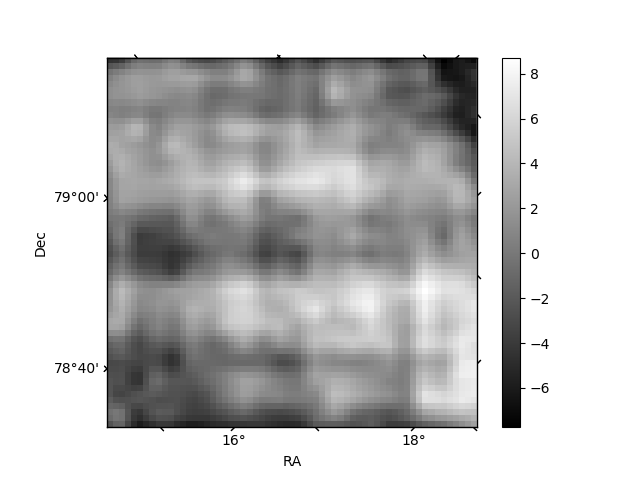
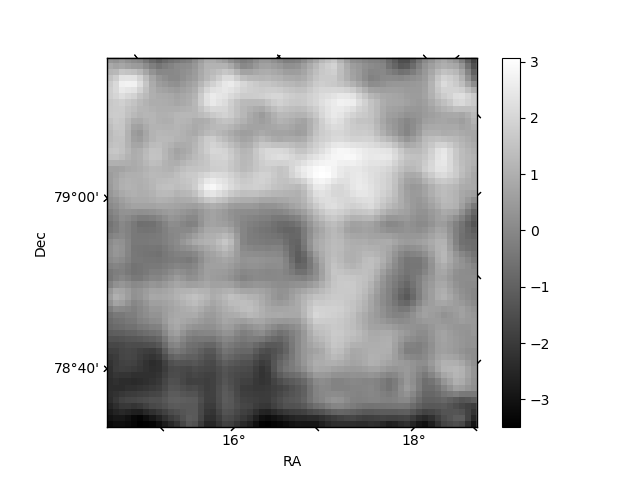
Histogram calculated using DETX and DETY for each event in the final _common_clean file
| Quadrant A | 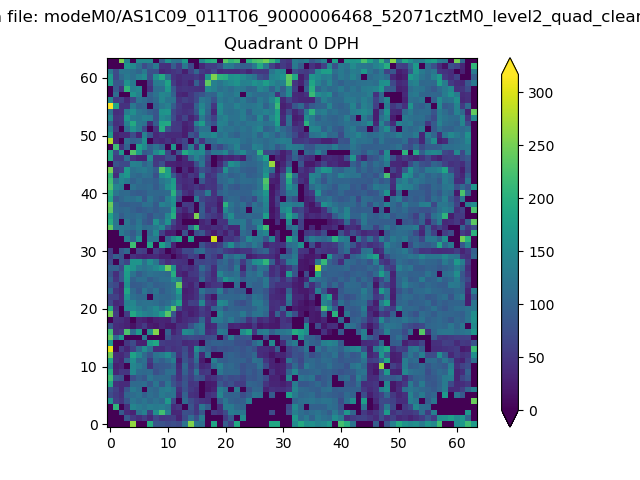 |
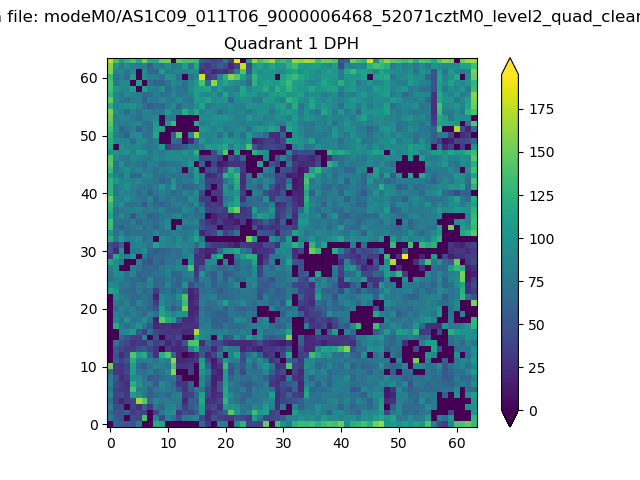 |
Quadrant B |
|---|---|---|---|
| Quadrant D | 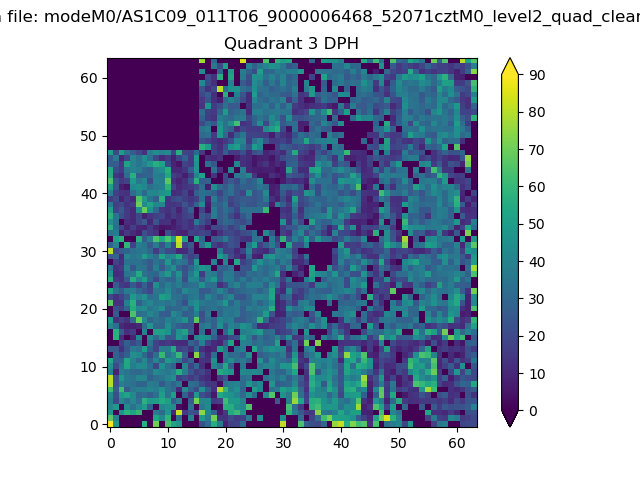 |
 |
Quadrant C |
| Plot type | Count rate plots | Images |
|---|---|---|
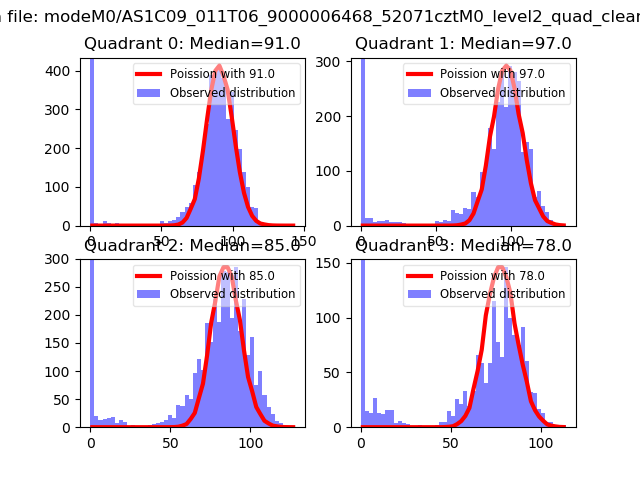
| Comparison with Poisson distribution Blue bars denote a histogram of data divided into 1 sec bins. Red curve is a Poisson curve with rate = median count rate of data. |
 |
 |
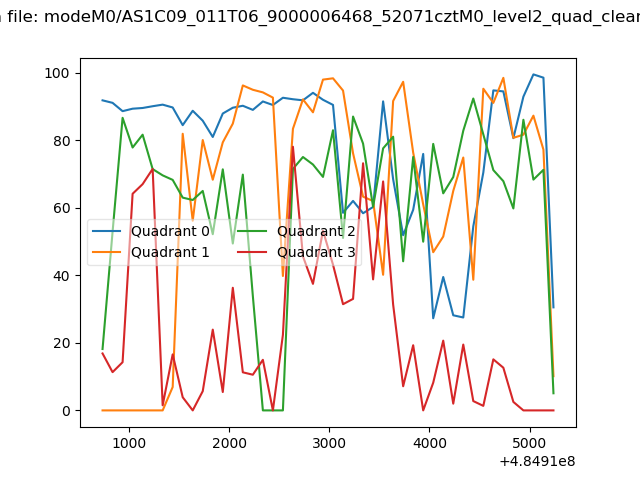
| Quadrant-wise count rates Data is divided into 100 sec bins |
 |
|
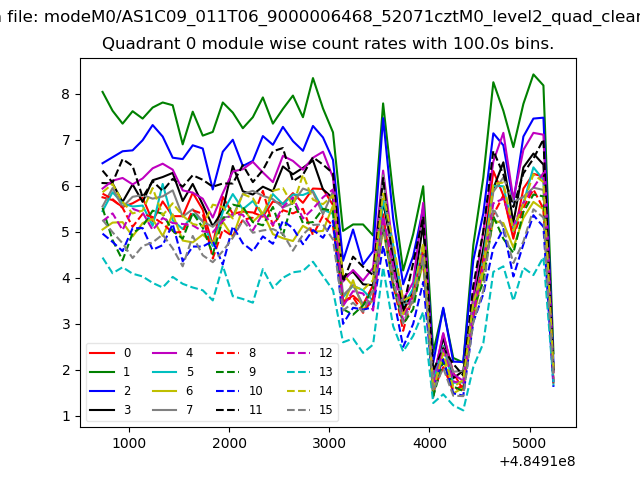
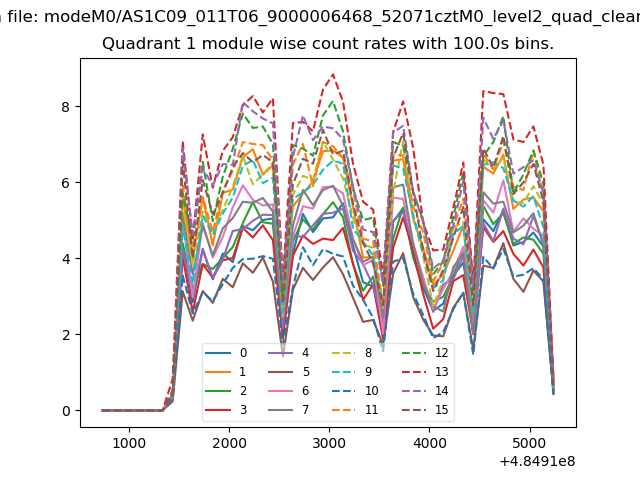
| Module-wise count rates for Quadrant A Data is divided into 100 sec bins |
 |
 |
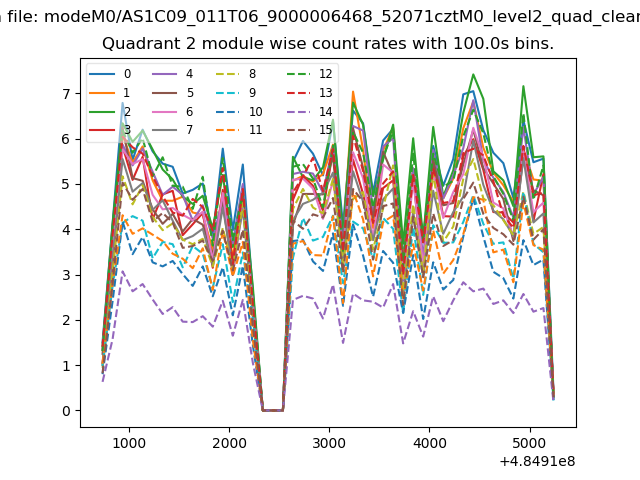
| Module-wise count rates for Quadrant B Data is divided into 100 sec bins |
 |
 |
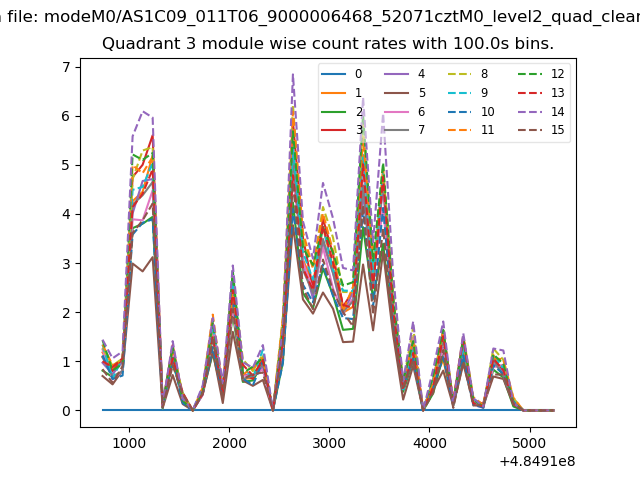
| Module-wise count rates for Quadrant C Data is divided into 100 sec bins |
 |
 |
| Module-wise count rates for Quadrant D Data is divided into 100 sec bins |
 |
 |
| Parameter | Plot |
|---|---|
| CZT HV Monitor | 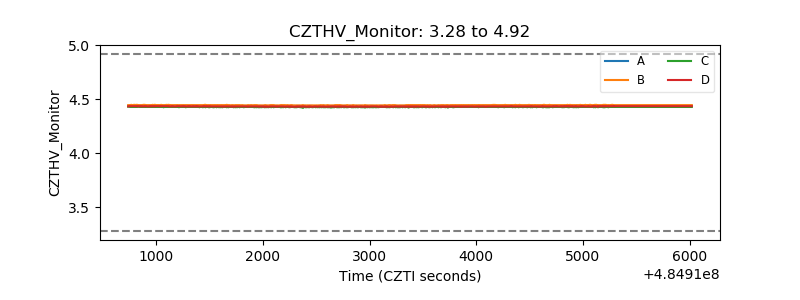 |
| D_VDD | 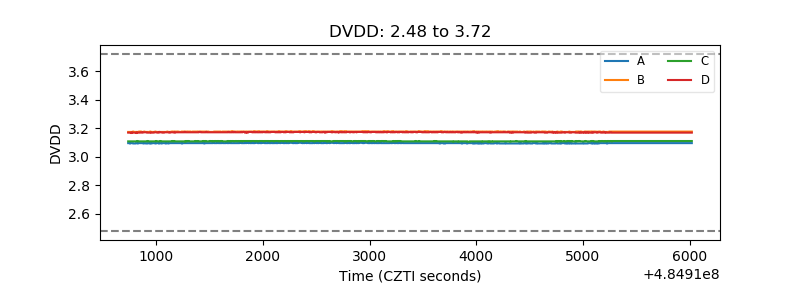 |
| Temperature 1 | 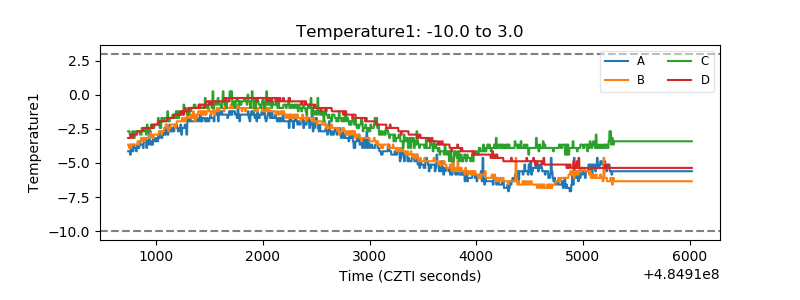 |
| Veto HV Monitor | 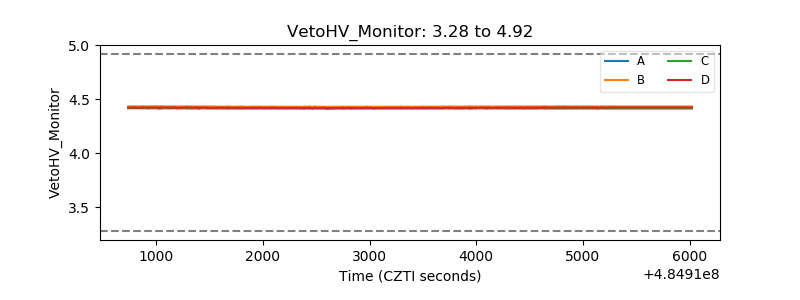 |
| Veto LLD | 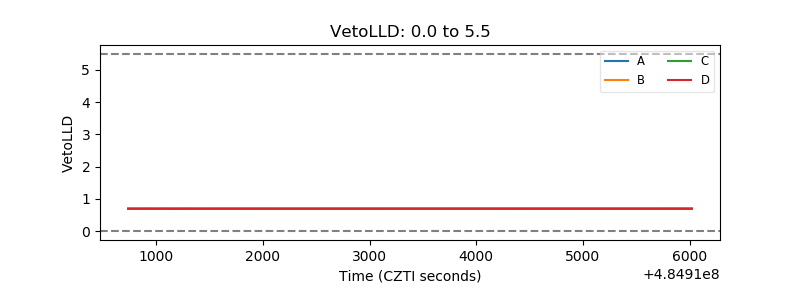 |
| Alpha Counter | 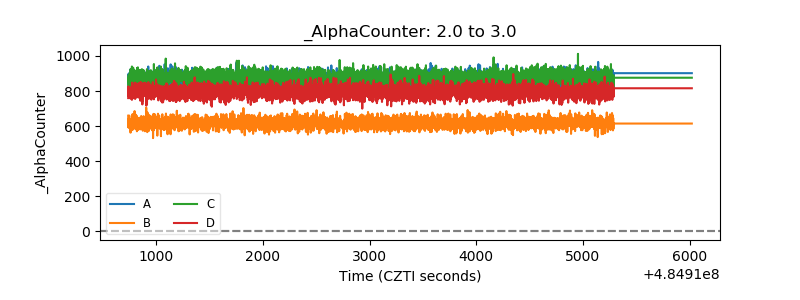 |
| _CPM_Rate | 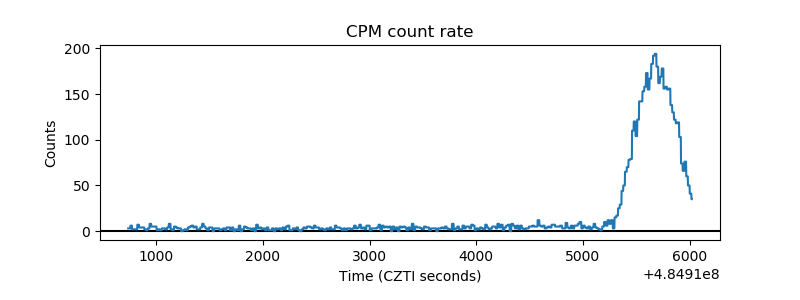 |
| CZT Counter | 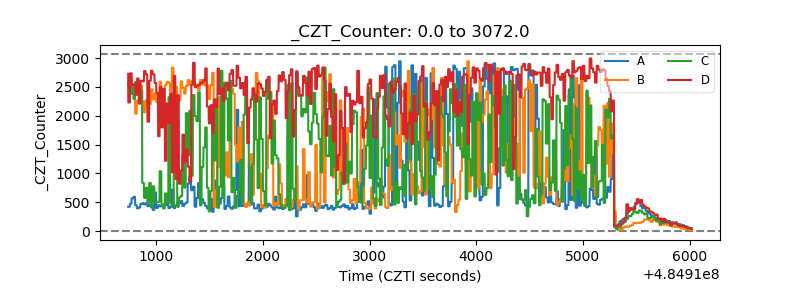 |
| +2.5 Volts monitor | 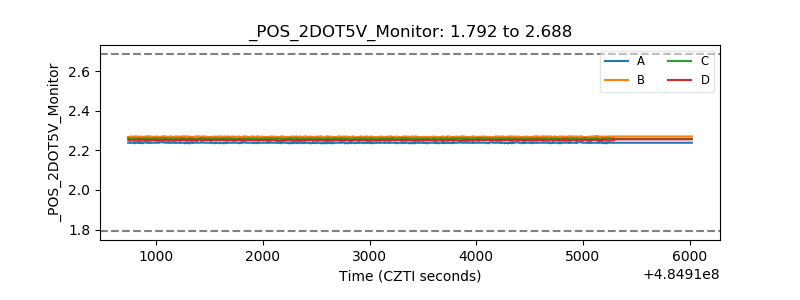 |
| +5 Volts monitor | 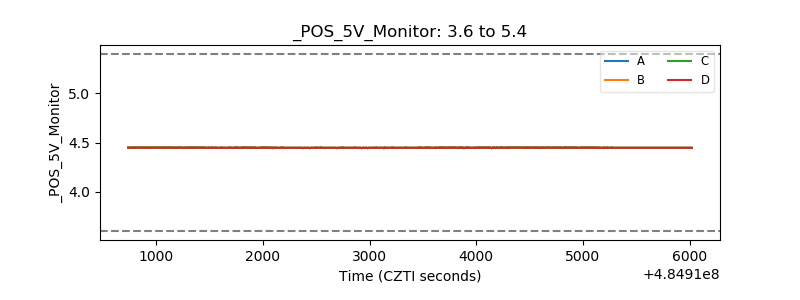 |
| _ROLL_ROT | 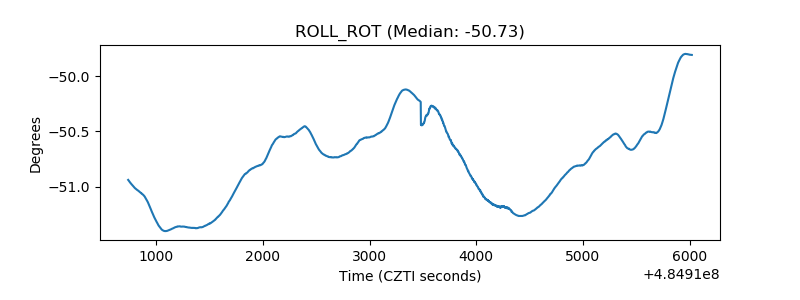 |
| _Roll_DEC | 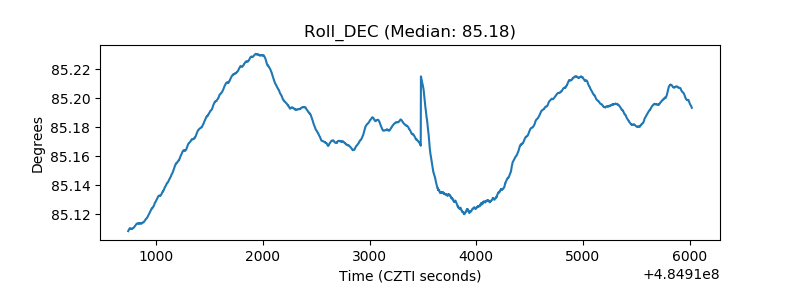 |
| _Roll_RA | 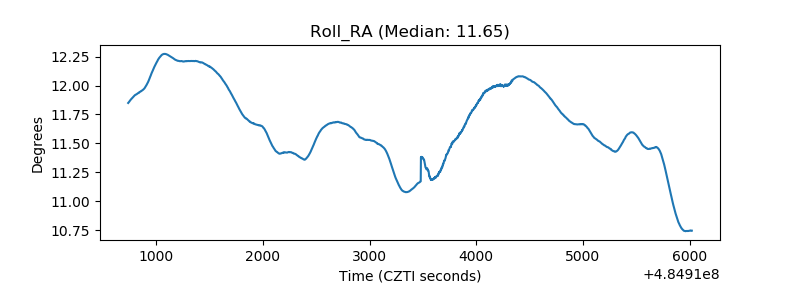 |
| Veto Counter | 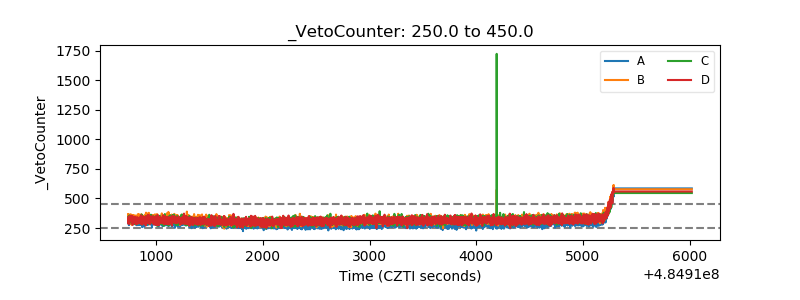 |