| Param | Original file | Final file |
|---|---|---|
| Filename | modeM0/AS1C09_011T07_9000006470_52071cztM0_level2.fits | modeM0/AS1C09_011T07_9000006470_52071cztM0_level2_quad_clean.evt |
| Size (bytes) | 203,751,360 | 11,450,880 |
| Size | 194.3 MB | 10.9 MB |
| Events in quadrant A | 1,879,425 | 66,134 |
| Events in quadrant B | 1,143,631 | 103,816 |
| Events in quadrant C | 1,630,535 | 81,202 |
| Events in quadrant D | 2,796,178 | 7,624 |
| Mode SS | |||
|---|---|---|---|
| Quadrant | BADHDUFLAG | Total packets | Discarded packets |
| A | 0 | 24 | 0 |
| B | 0 | 24 | 0 |
| C | 0 | 24 | 0 |
| D | 0 | 24 | 0 |
| Mode M0 | |||
|---|---|---|---|
| Quadrant | BADHDUFLAG | Total packets | Discarded packets |
| A | 0 | 6394 | 0 |
| B | 0 | 4164 | 0 |
| C | 0 | 5655 | 2 |
| D | 0 | 9081 | 0 |
| Quadrant | Total seconds | Saturated seconds | Saturation percentage |
|---|---|---|---|
| A | 1159 | 533 | 45.987921% |
| B | 1159 | 179 | 15.444349% |
| C | 1158 | 338 | 29.188256% |
| D | 1158 | 1088 | 93.955095% |
Noise dominated data is calculated using 1-second bins in cleaned event files. If a bin has >2000 counts, and if more than 50% of those come from <1% of pixels, then it is considered to be noise-dominated and hence unusable.
| Quadrant | # 1 sec bins | Bins with >0 counts | Bins with >2000 counts | High rate bins dominated by noise | Noise dominated (total time) | Noise dominated (detector-on time) | Marked lightcurve |
|---|---|---|---|---|---|---|---|
| A | 1159 | 1159 | 473 | 473 | 40.81% | 40.81% | 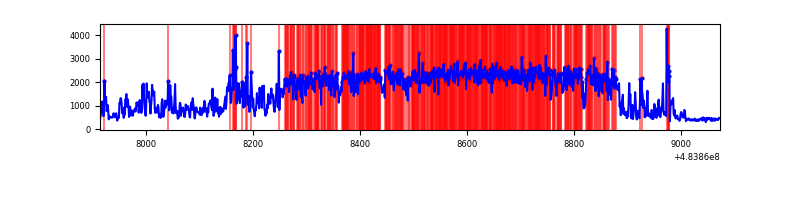 |
| B | 1159 | 1159 | 133 | 133 | 11.48% | 11.48% | 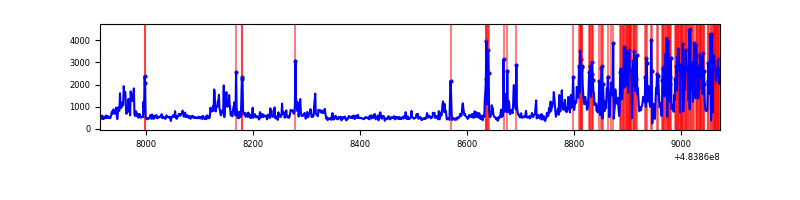 |
| C | 1158 | 1158 | 274 | 274 | 23.66% | 23.66% | 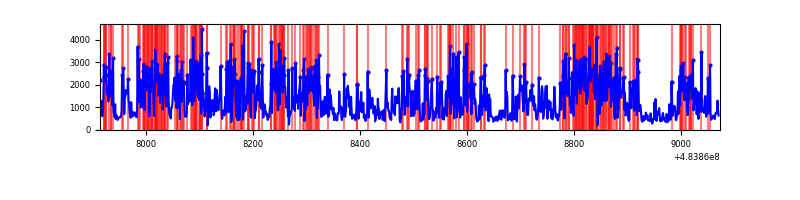 |
| D | 1158 | 1158 | 896 | 896 | 77.37% | 77.37% | 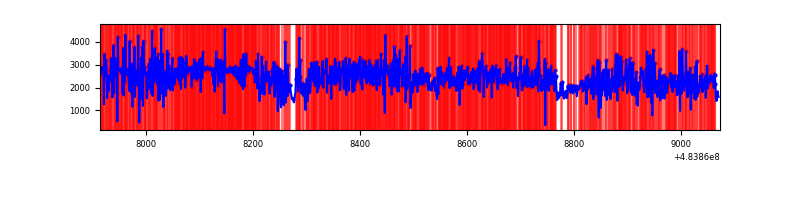 |
Top three noisy pixels from each quadrant. If the there are fewer than three noisy pixels in the level2.evt file, extra rows are filled as -1
| Pixel properties | Quadrant properties | ||||||
|---|---|---|---|---|---|---|---|
| Quadrant | DetID | PixID | Counts | Sigma | Mean | Median | Sigma |
| A | 4 | 95 | 1298020 | 44299.18 | 113 | 110 | 29.3 |
| A | 5 | 240 | 44342 | 1509.69 | 113 | 110 | 29.3 |
| A | 6 | 196 | 30913 | 1051.34 | 113 | 110 | 29.3 |
| B | 10 | 128 | 580328 | 21900.76 | 115 | 112 | 26.5 |
| B | 10 | 254 | 26866 | 1009.85 | 115 | 112 | 26.5 |
| B | 4 | 171 | 18767 | 704.15 | 115 | 112 | 26.5 |
| C | 15 | 224 | 1144940 | 37342.83 | 105 | 103 | 30.7 |
| C | 13 | 3 | 18314 | 594.01 | 105 | 103 | 30.7 |
| C | 12 | 252 | 13455 | 435.52 | 105 | 103 | 30.7 |
| D | 6 | 42 | 1092925 | 54481.08 | 64 | 61 | 20.1 |
| D | 15 | 94 | 689712 | 34380.24 | 64 | 61 | 20.1 |
| D | 13 | 187 | 344825 | 17187.06 | 64 | 61 | 20.1 |
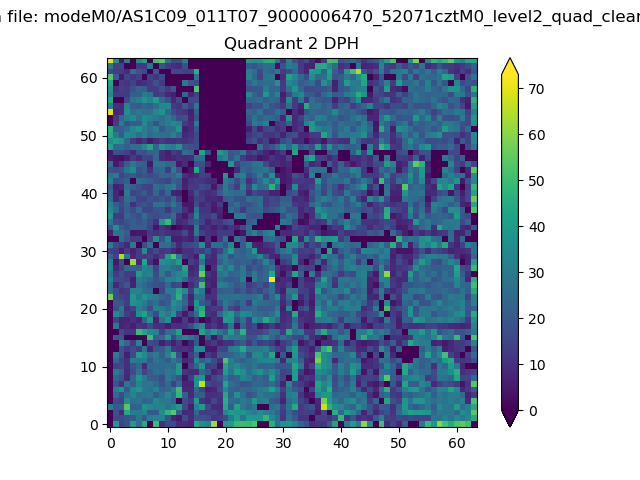
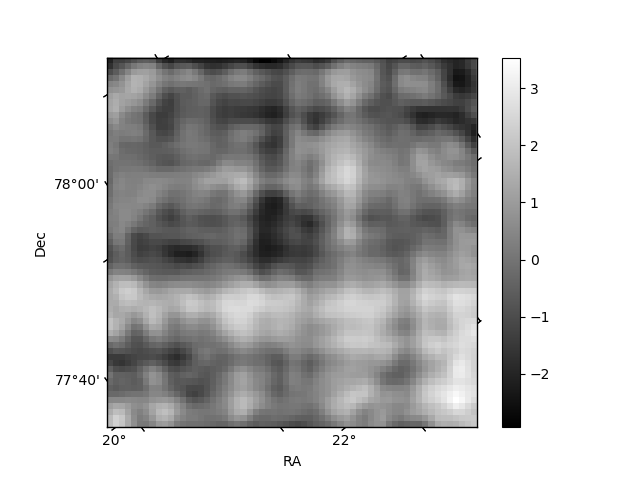
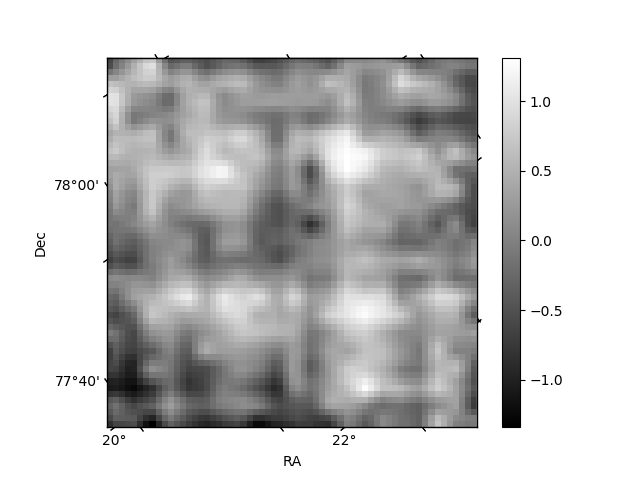
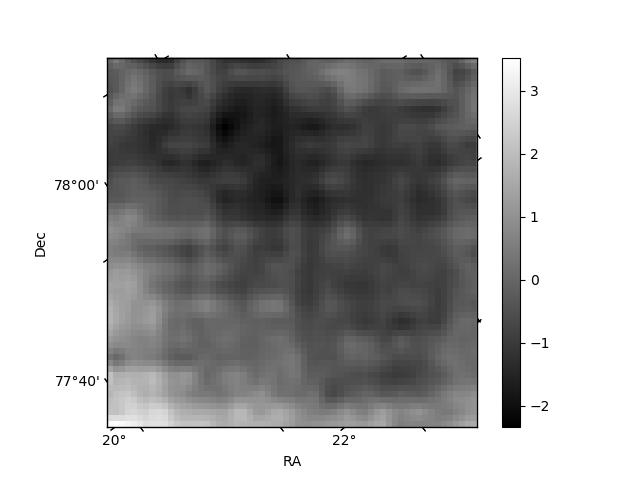
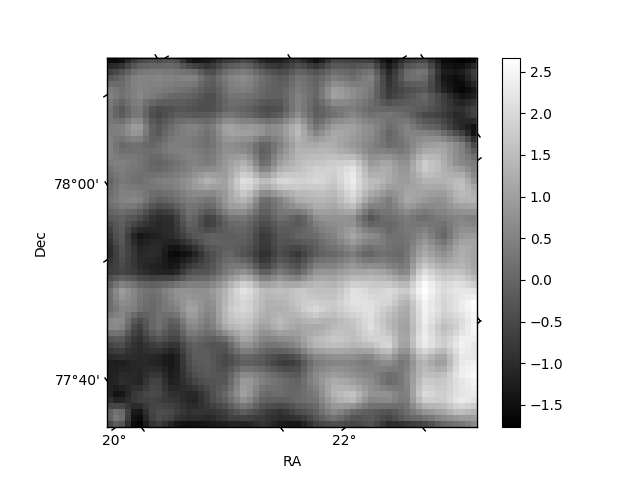
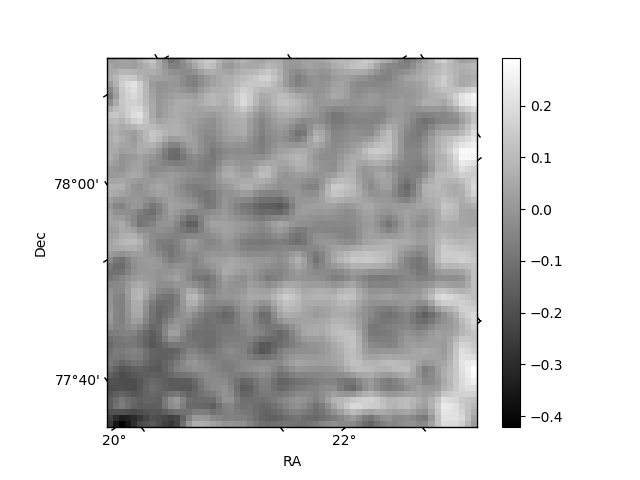
Histogram calculated using DETX and DETY for each event in the final _common_clean file
| Quadrant A | 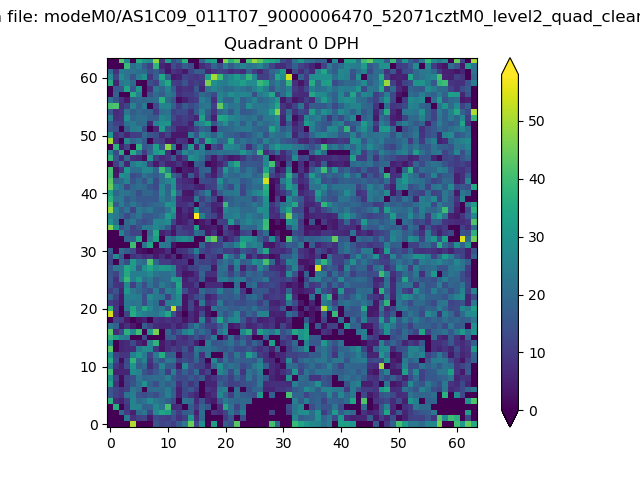 |
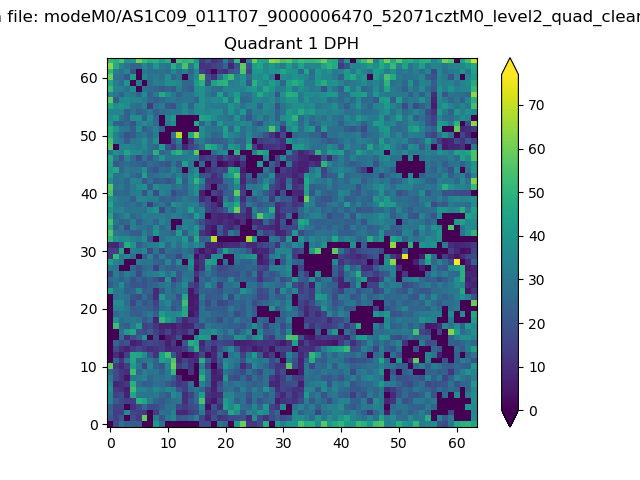 |
Quadrant B |
|---|---|---|---|
| Quadrant D | 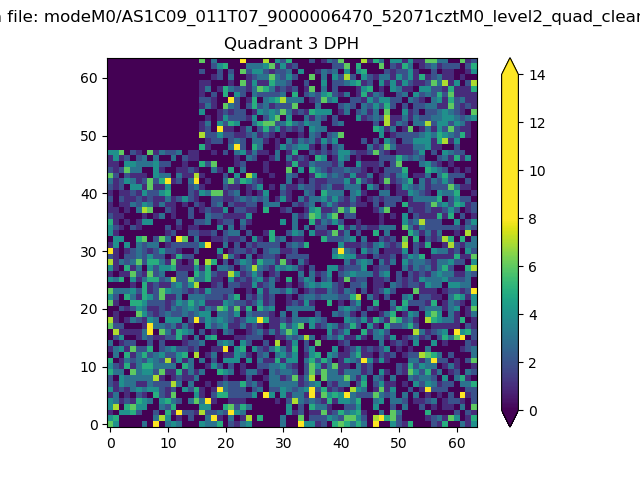 |
 |
Quadrant C |
| Plot type | Count rate plots | Images |
|---|---|---|
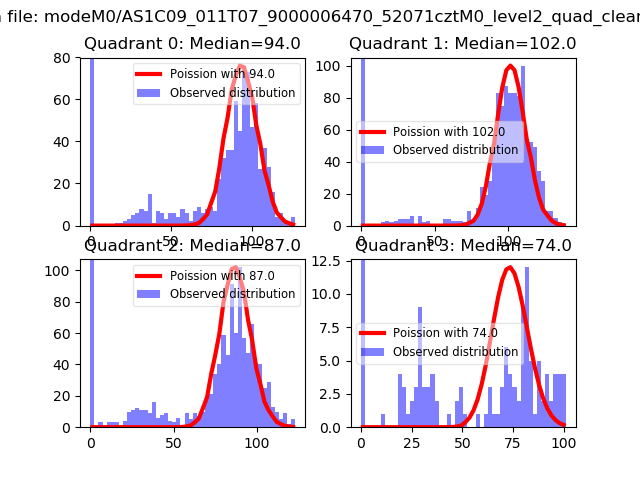
| Comparison with Poisson distribution Blue bars denote a histogram of data divided into 1 sec bins. Red curve is a Poisson curve with rate = median count rate of data. |
 |
 |
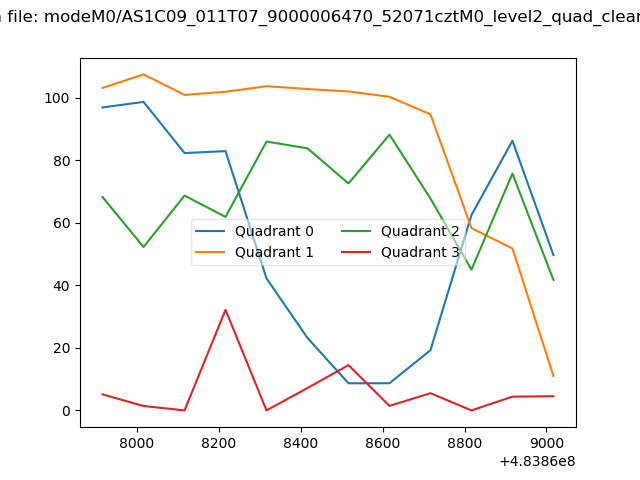
| Quadrant-wise count rates Data is divided into 100 sec bins |
 |
|
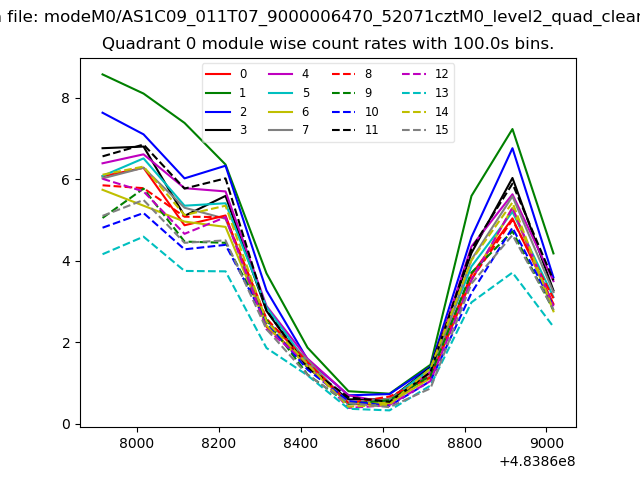
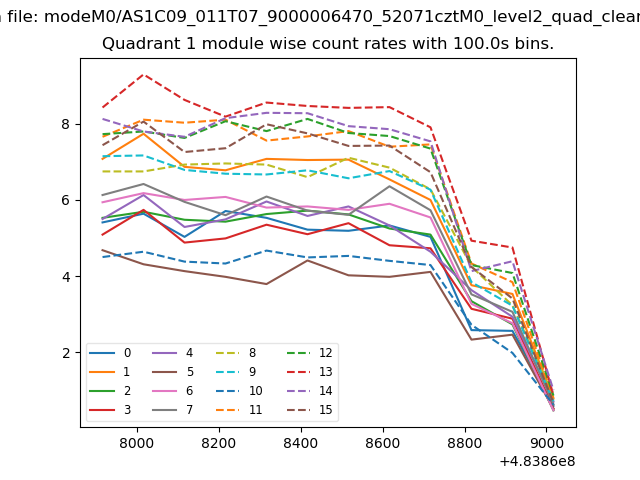
| Module-wise count rates for Quadrant A Data is divided into 100 sec bins |
 |
 |
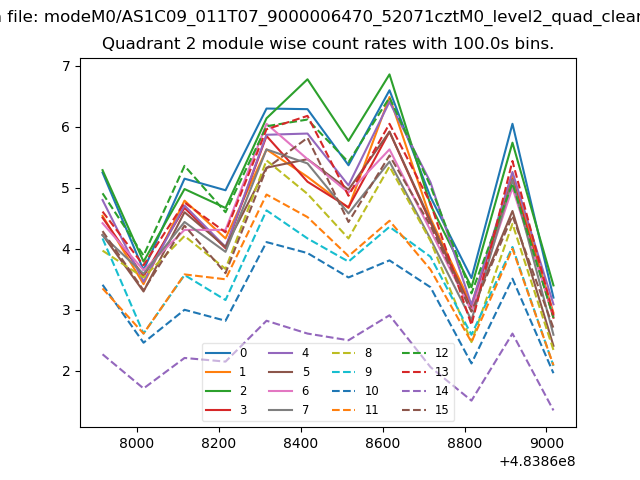
| Module-wise count rates for Quadrant B Data is divided into 100 sec bins |
 |
 |
| Module-wise count rates for Quadrant C Data is divided into 100 sec bins |
 |
 |
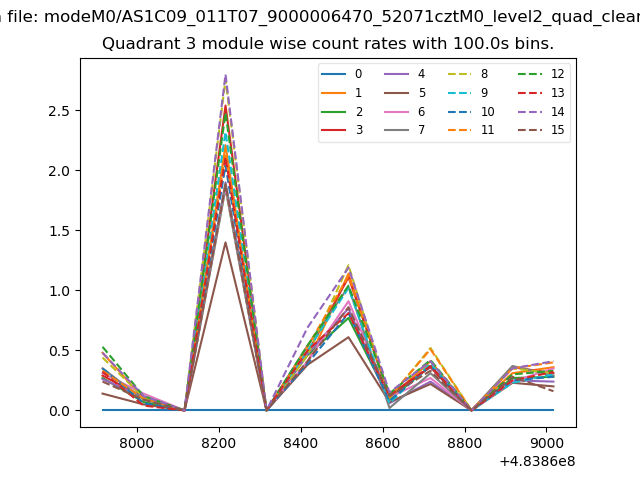
| Module-wise count rates for Quadrant D Data is divided into 100 sec bins |
 |
 |
| Parameter | Plot |
|---|---|
| CZT HV Monitor | 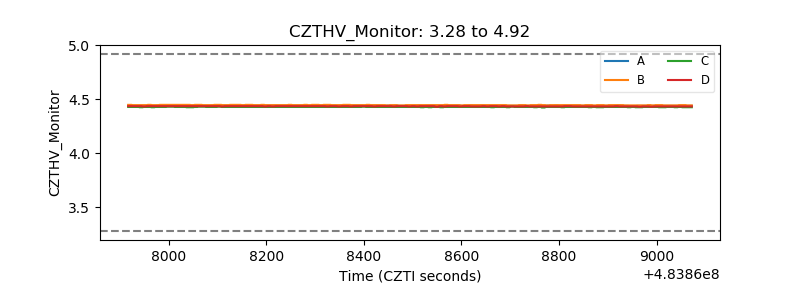 |
| D_VDD | 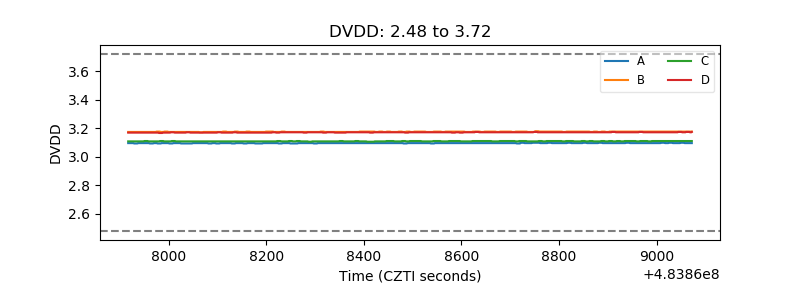 |
| Temperature 1 | 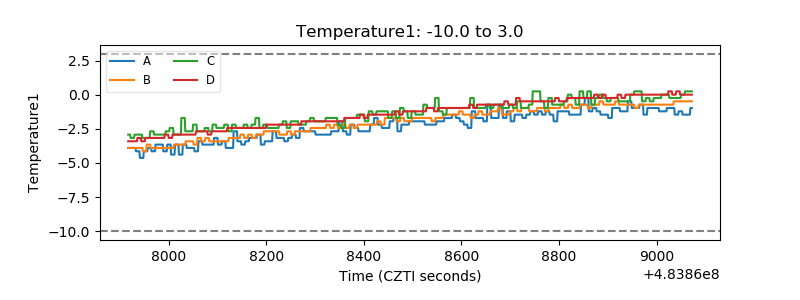 |
| Veto HV Monitor | 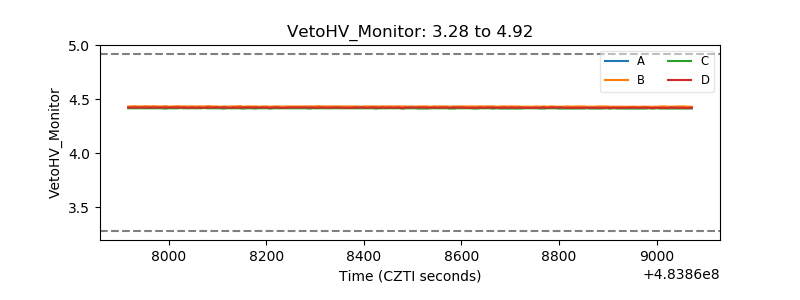 |
| Veto LLD | 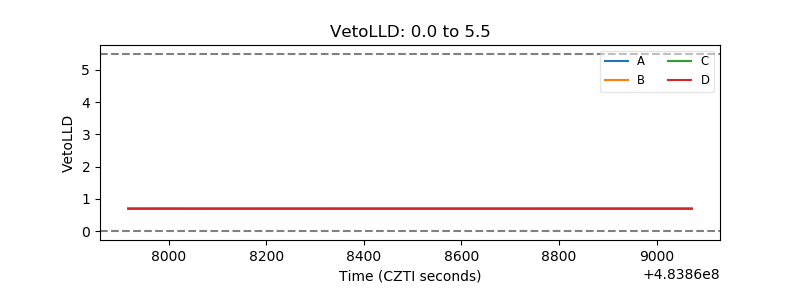 |
| Alpha Counter | 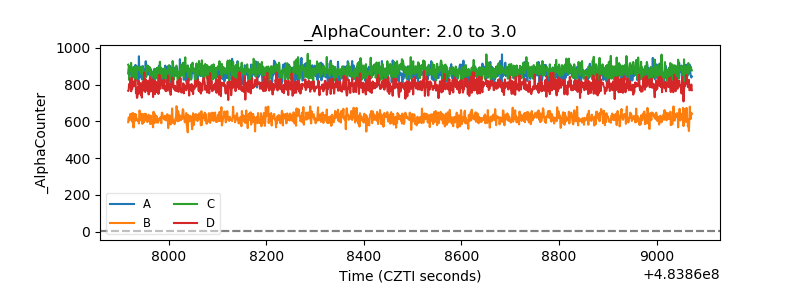 |
| _CPM_Rate | 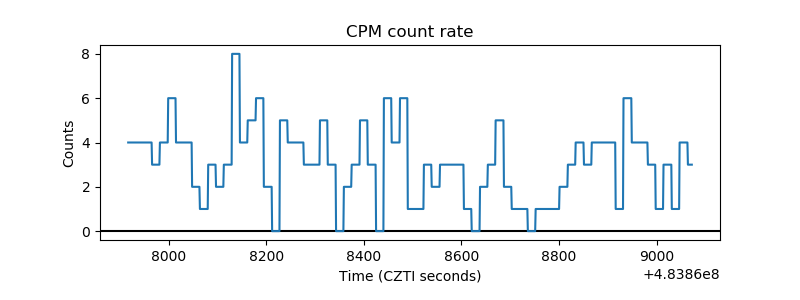 |
| CZT Counter | 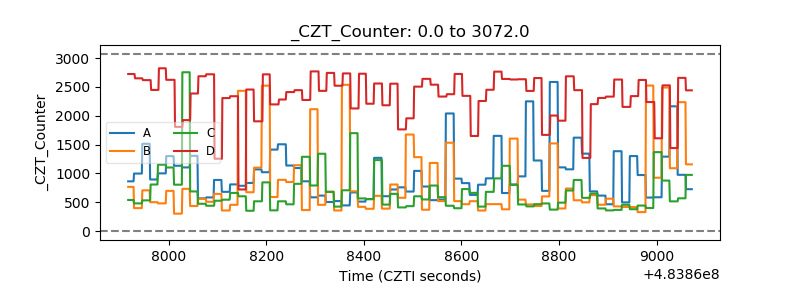 |
| +2.5 Volts monitor | 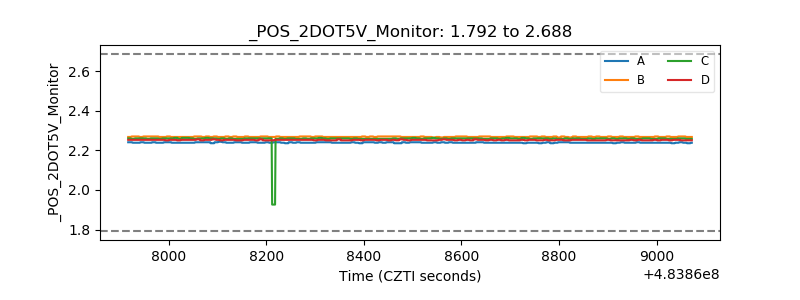 |
| +5 Volts monitor | 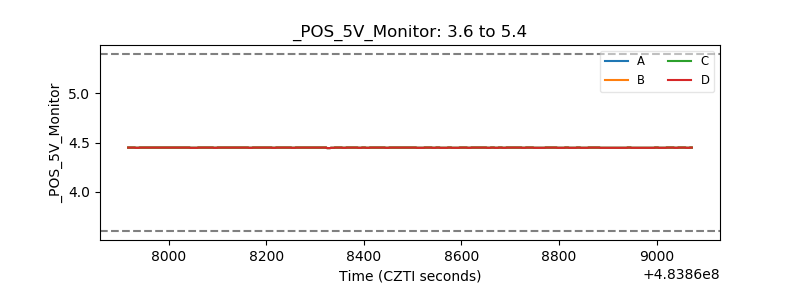 |
| _ROLL_ROT | 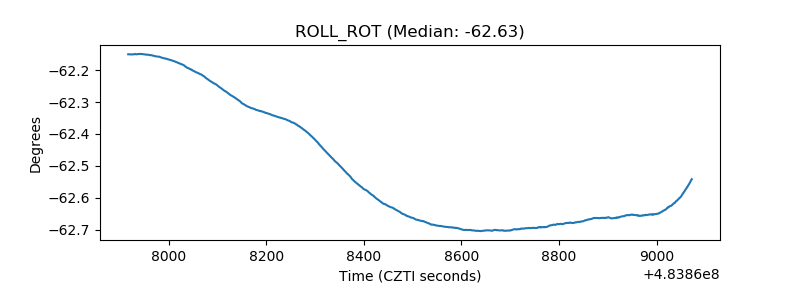 |
| _Roll_DEC | 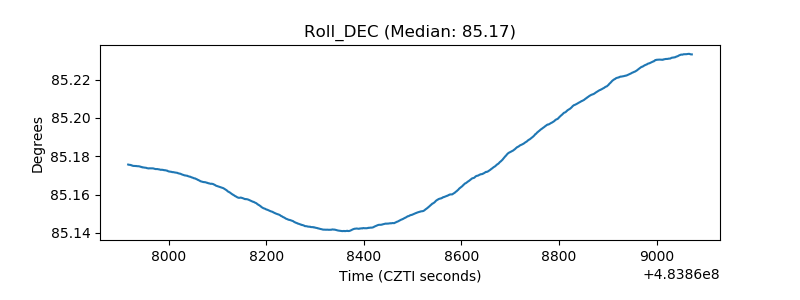 |
| _Roll_RA | 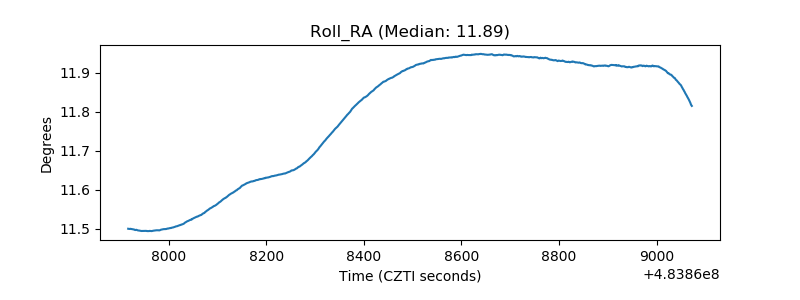 |
| Veto Counter | 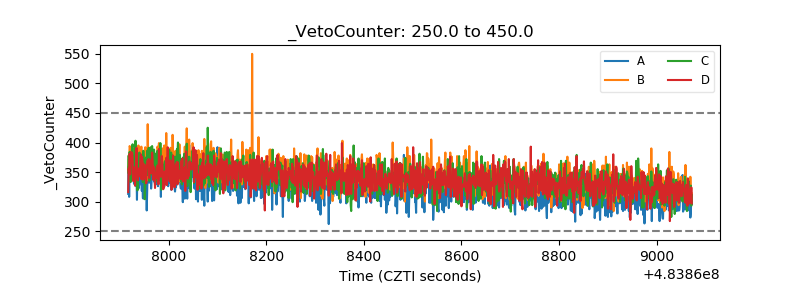 |