| Param | Original file | Final file |
|---|---|---|
| Filename | modeM0/AS1C09_011T07_9000006470_52073cztM0_level2.fits | modeM0/AS1C09_011T07_9000006470_52073cztM0_level2_quad_clean.evt |
| Size (bytes) | 923,667,840 | 70,297,920 |
| Size | 880.9 MB | 67.0 MB |
| Events in quadrant A | 5,864,045 | 503,849 |
| Events in quadrant B | 6,837,466 | 511,779 |
| Events in quadrant C | 8,804,298 | 413,679 |
| Events in quadrant D | 12,208,550 | 267,095 |
| Mode SS | |||
|---|---|---|---|
| Quadrant | BADHDUFLAG | Total packets | Discarded packets |
| A | 0 | 126 | 0 |
| B | 0 | 126 | 0 |
| C | 0 | 126 | 0 |
| D | 0 | 126 | 0 |
| Mode M9 | |||
|---|---|---|---|
| Quadrant | BADHDUFLAG | Total packets | Discarded packets |
| A | 0 | 10 | 0 |
| B | 0 | 10 | 0 |
| C | 0 | 10 | 0 |
| D | 0 | 10 | 0 |
| Mode M0 | |||
|---|---|---|---|
| Quadrant | BADHDUFLAG | Total packets | Discarded packets |
| A | 0 | 21671 | 6 |
| B | 0 | 24562 | 1 |
| C | 0 | 30437 | 17 |
| D | 0 | 40535 | 19 |
| Quadrant | Total seconds | Saturated seconds | Saturation percentage |
|---|---|---|---|
| A | 6178 | 1037 | 16.785367% |
| B | 6181 | 1276 | 20.643909% |
| C | 6177 | 1985 | 32.135341% |
| D | 6177 | 3344 | 54.136312% |
Noise dominated data is calculated using 1-second bins in cleaned event files. If a bin has >2000 counts, and if more than 50% of those come from <1% of pixels, then it is considered to be noise-dominated and hence unusable.
| Quadrant | # 1 sec bins | Bins with >0 counts | Bins with >2000 counts | High rate bins dominated by noise | Noise dominated (total time) | Noise dominated (detector-on time) | Marked lightcurve |
|---|---|---|---|---|---|---|---|
| A | 7165 | 6179 | 914 | 914 | 12.76% | 14.79% | 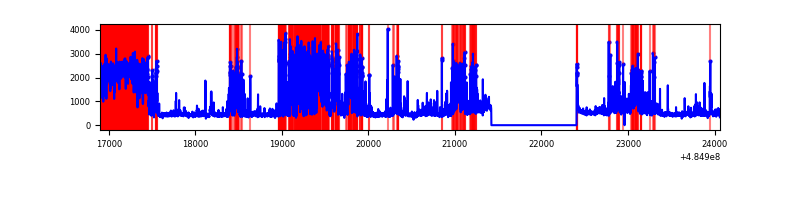 |
| B | 7166 | 6181 | 1092 | 1092 | 15.24% | 17.67% | 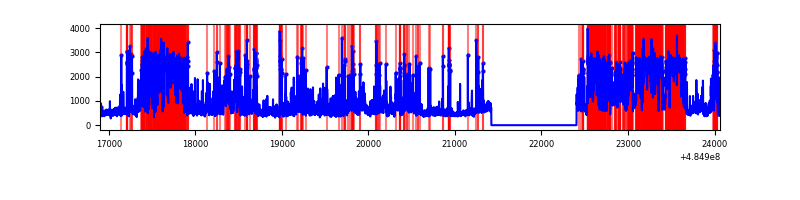 |
| C | 7166 | 6181 | 1793 | 1793 | 25.02% | 29.01% | 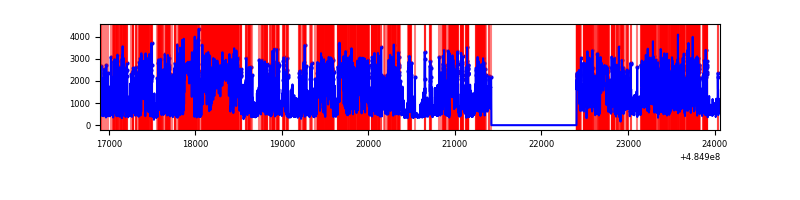 |
| D | 7166 | 6180 | 3336 | 3336 | 46.55% | 53.98% | 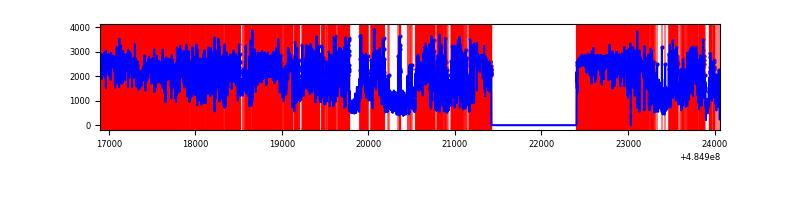 |
Top three noisy pixels from each quadrant. If the there are fewer than three noisy pixels in the level2.evt file, extra rows are filled as -1
| Pixel properties | Quadrant properties | ||||||
|---|---|---|---|---|---|---|---|
| Quadrant | DetID | PixID | Counts | Sigma | Mean | Median | Sigma |
| A | 4 | 95 | 1245640 | 8071.21 | 617 | 601 | 154.3 |
| A | 3 | 95 | 971087 | 6291.36 | 617 | 601 | 154.3 |
| A | 3 | 14 | 256703 | 1660.23 | 617 | 601 | 154.3 |
| B | 5 | 172 | 1742579 | 13872.05 | 587 | 567 | 125.6 |
| B | 10 | 128 | 1721733 | 13706.05 | 587 | 567 | 125.6 |
| B | 10 | 254 | 157060 | 1246.19 | 587 | 567 | 125.6 |
| C | 15 | 224 | 5060710 | 33582.39 | 542 | 536 | 150.7 |
| C | 15 | 254 | 249545 | 1652.57 | 542 | 536 | 150.7 |
| C | 15 | 215 | 241611 | 1599.92 | 542 | 536 | 150.7 |
| D | 15 | 94 | 3892748 | 27946.42 | 476 | 453 | 139.3 |
| D | 6 | 42 | 3787947 | 27193.95 | 476 | 453 | 139.3 |
| D | 13 | 187 | 762350 | 5470.37 | 476 | 453 | 139.3 |
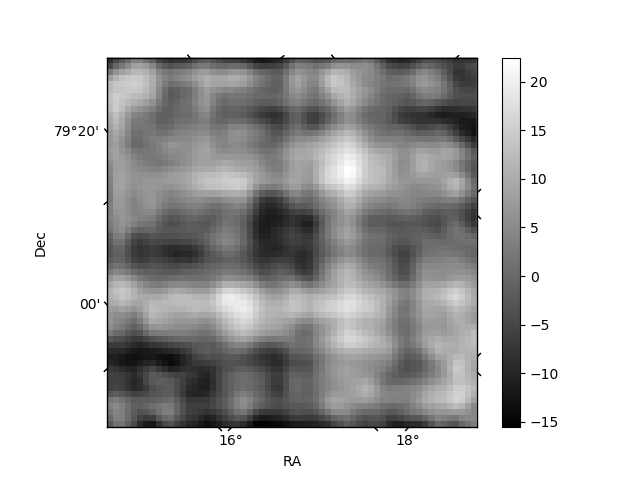
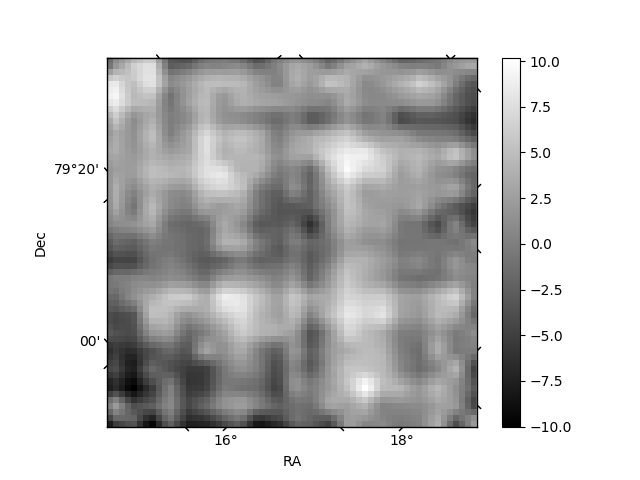
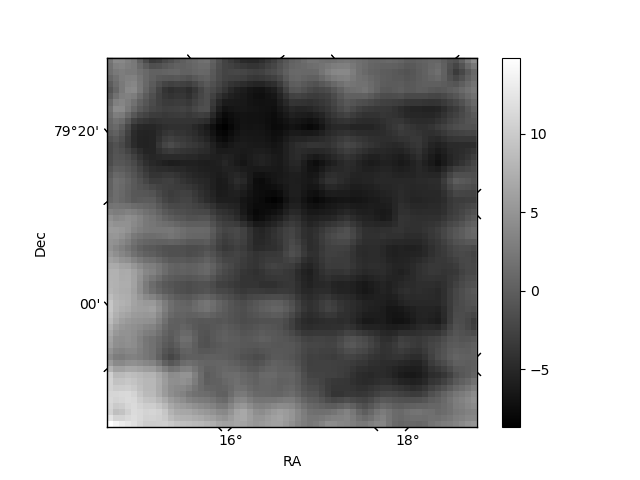
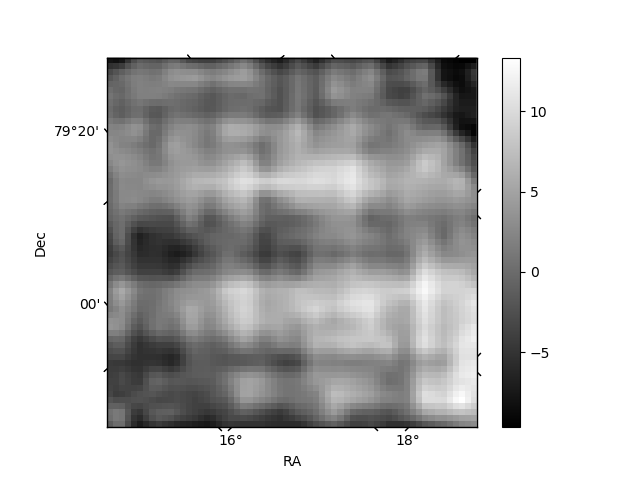
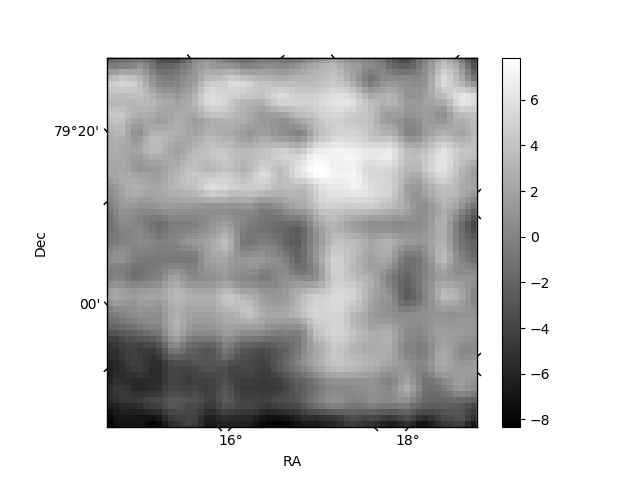
Histogram calculated using DETX and DETY for each event in the final _common_clean file
| Quadrant A | 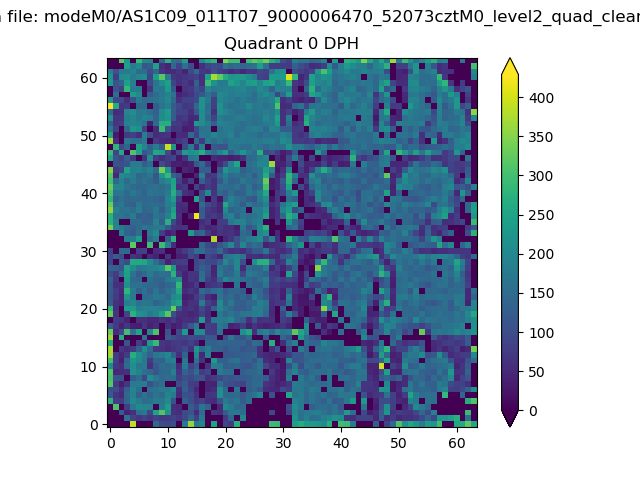 |
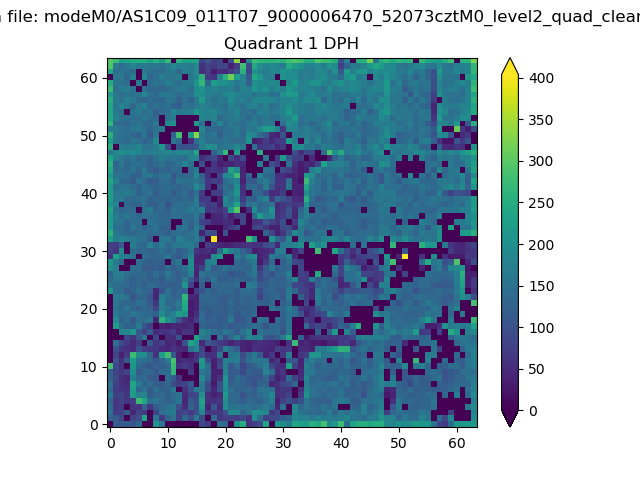 |
Quadrant B |
|---|---|---|---|
| Quadrant D | 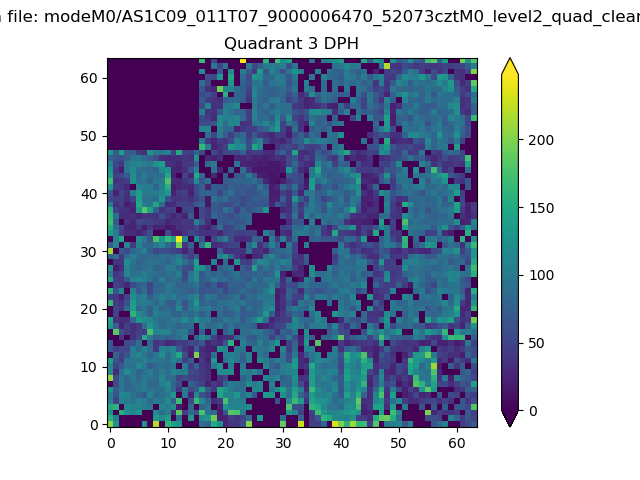 |
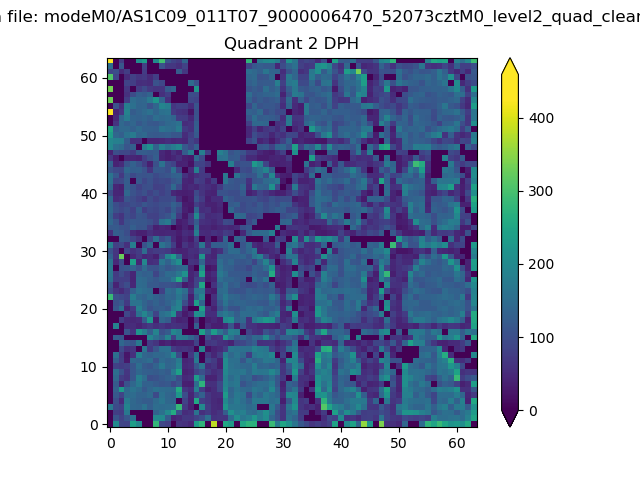 |
Quadrant C |
| Plot type | Count rate plots | Images |
|---|---|---|
| Comparison with Poisson distribution Blue bars denote a histogram of data divided into 1 sec bins. Red curve is a Poisson curve with rate = median count rate of data. |
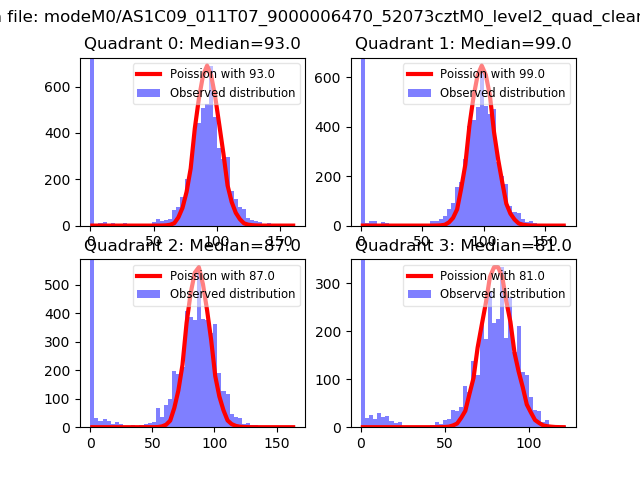 |
 |
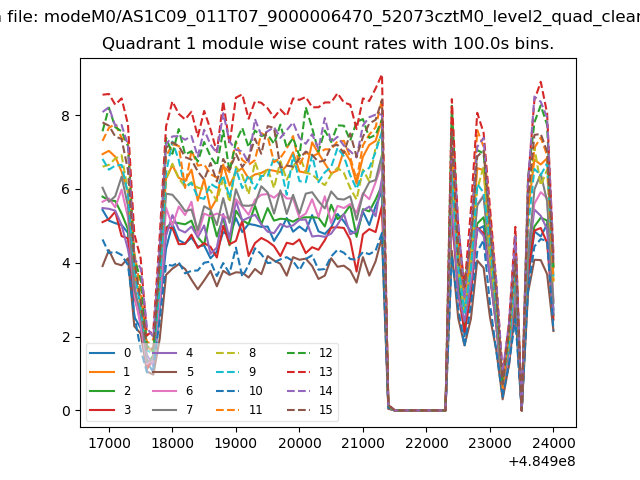
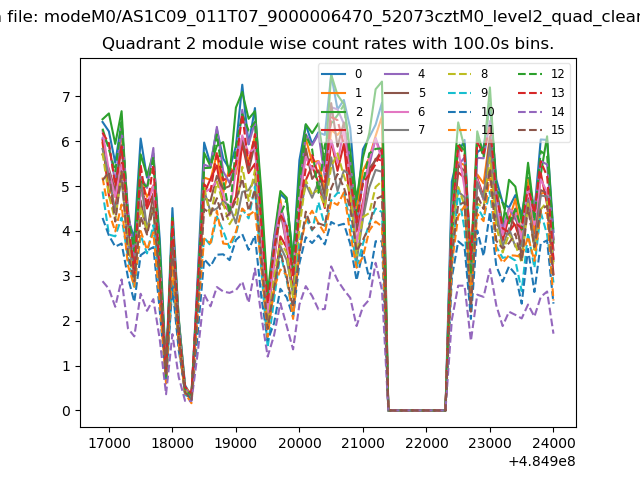
| Quadrant-wise count rates Data is divided into 100 sec bins |
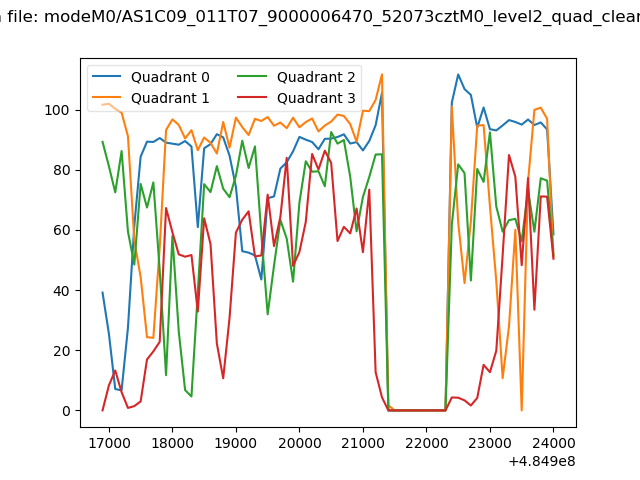 |
|
| Module-wise count rates for Quadrant A Data is divided into 100 sec bins |
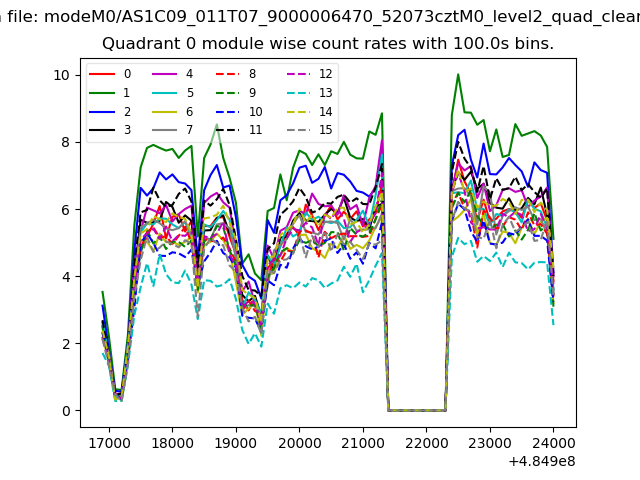 |
 |
| Module-wise count rates for Quadrant B Data is divided into 100 sec bins |
 |
 |
| Module-wise count rates for Quadrant C Data is divided into 100 sec bins |
 |
 |
| Module-wise count rates for Quadrant D Data is divided into 100 sec bins |
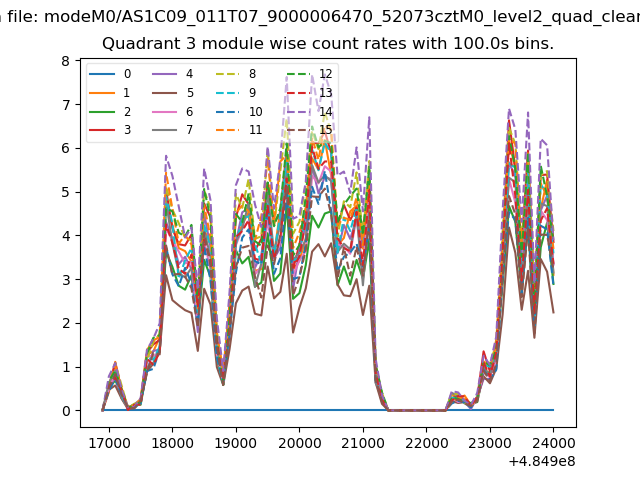 |
 |
| Parameter | Plot |
|---|---|
| CZT HV Monitor | 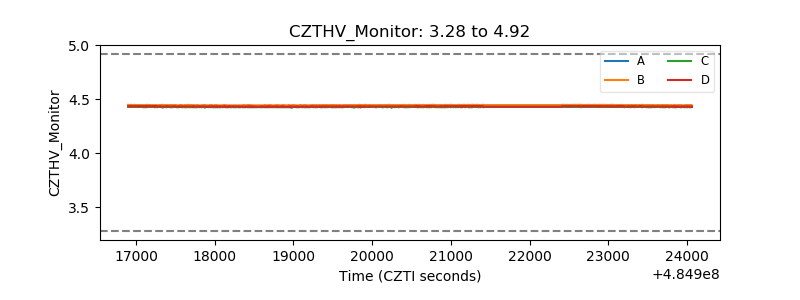 |
| D_VDD | 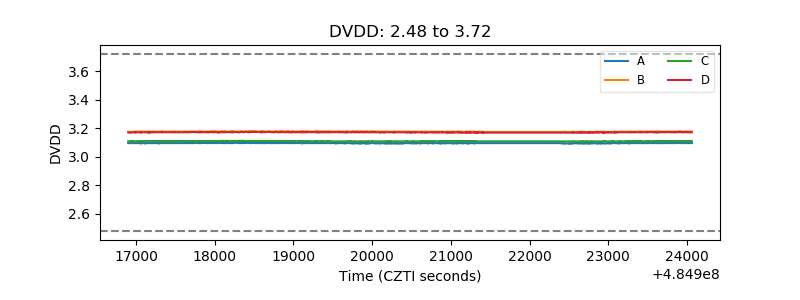 |
| Temperature 1 | 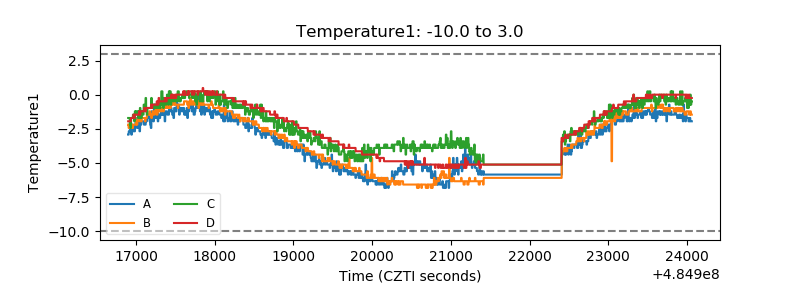 |
| Veto HV Monitor | 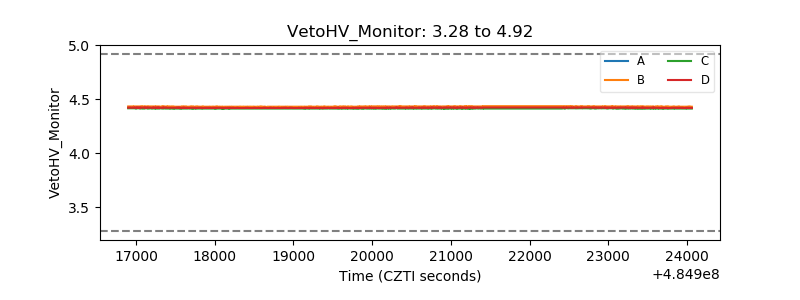 |
| Veto LLD | 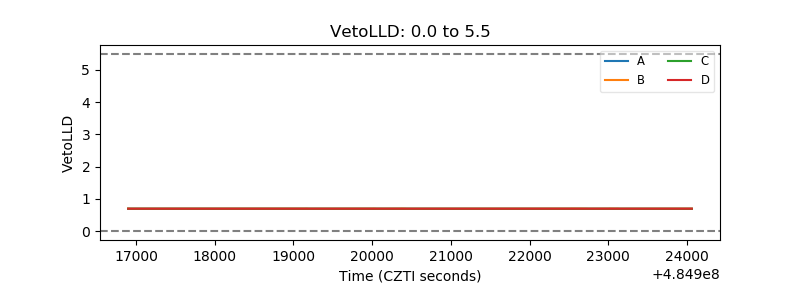 |
| Alpha Counter | 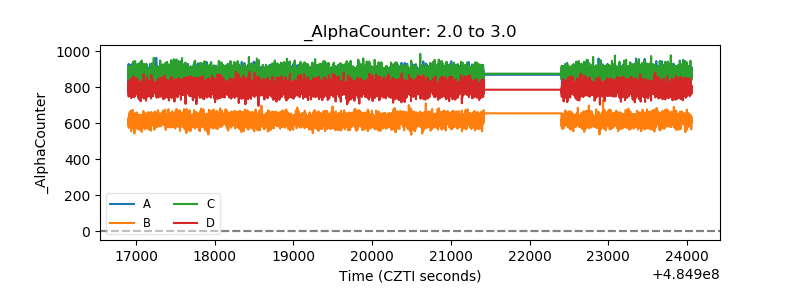 |
| _CPM_Rate | 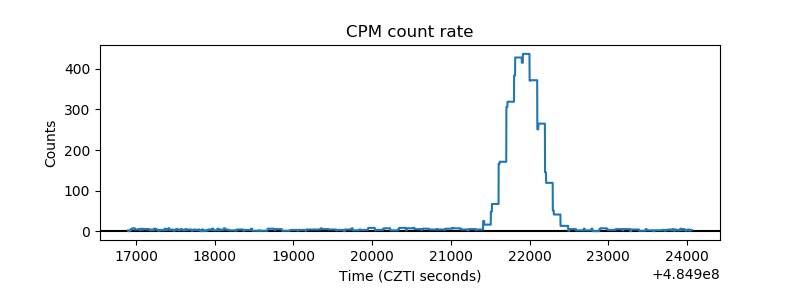 |
| CZT Counter | 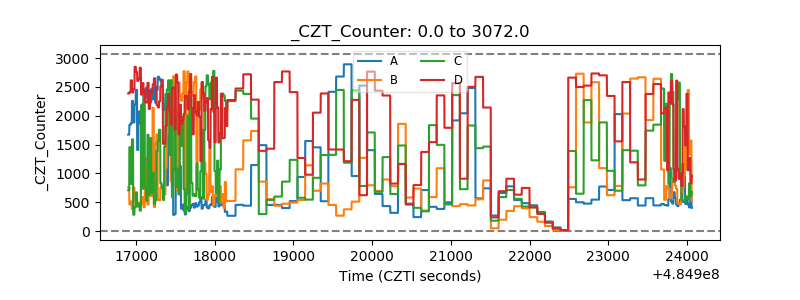 |
| +2.5 Volts monitor | 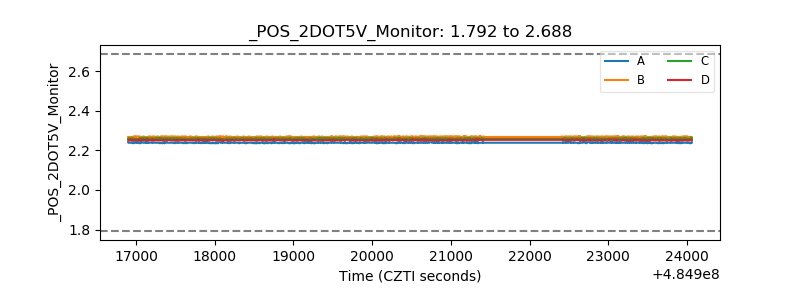 |
| +5 Volts monitor | 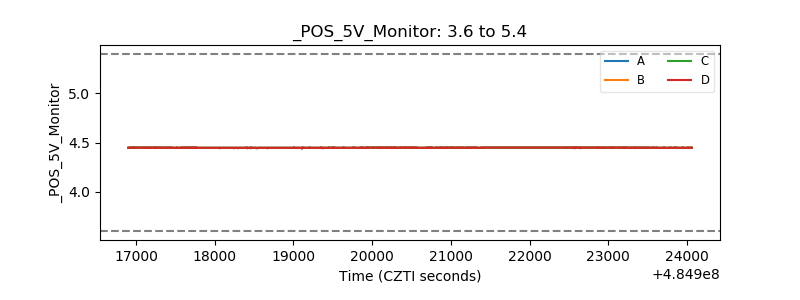 |
| _ROLL_ROT | 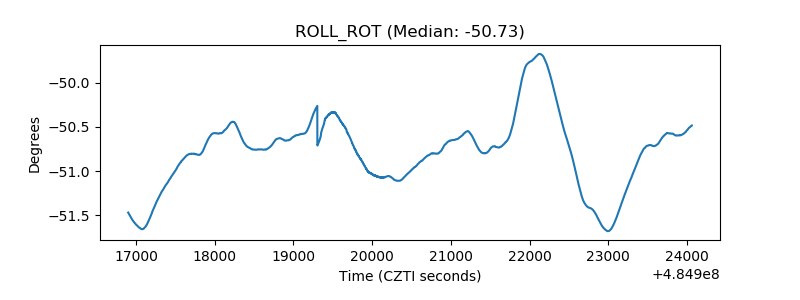 |
| _Roll_DEC | 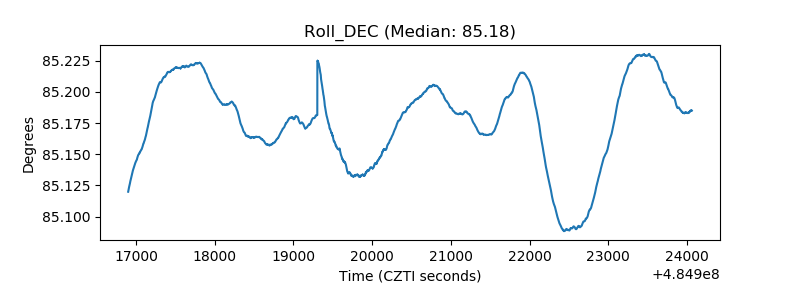 |
| _Roll_RA | 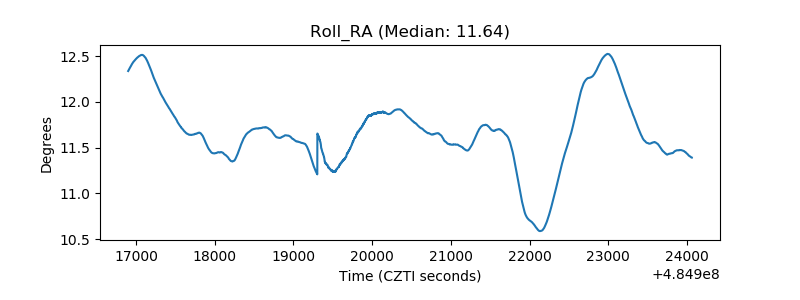 |
| Veto Counter | 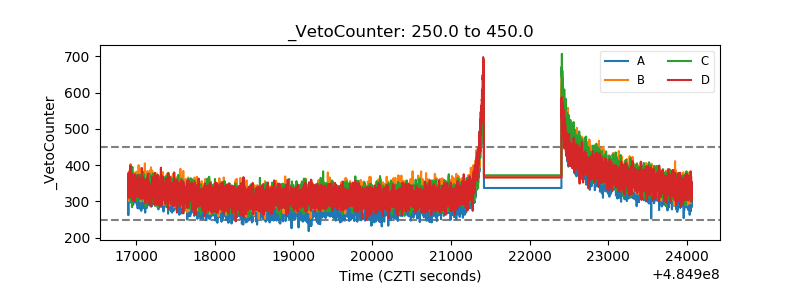 |