| Param | Original file | Final file |
|---|---|---|
| Filename | modeM0/AS1C09_011T07_9000006470_52074cztM0_level2.fits | modeM0/AS1C09_011T07_9000006470_52074cztM0_level2_quad_clean.evt |
| Size (bytes) | 804,841,920 | 71,112,960 |
| Size | 767.6 MB | 67.8 MB |
| Events in quadrant A | 3,745,971 | 582,654 |
| Events in quadrant B | 6,033,131 | 532,507 |
| Events in quadrant C | 8,078,889 | 405,711 |
| Events in quadrant D | 11,491,938 | 231,373 |
| Mode SS | |||
|---|---|---|---|
| Quadrant | BADHDUFLAG | Total packets | Discarded packets |
| A | 0 | 118 | 2 |
| B | 0 | 116 | 0 |
| C | 0 | 117 | 1 |
| D | 0 | 117 | 1 |
| Mode M9 | |||
|---|---|---|---|
| Quadrant | BADHDUFLAG | Total packets | Discarded packets |
| A | 0 | 12 | 1 |
| B | 0 | 11 | 0 |
| C | 0 | 11 | 0 |
| D | 0 | 12 | 1 |
| Mode M0 | |||
|---|---|---|---|
| Quadrant | BADHDUFLAG | Total packets | Discarded packets |
| A | 0 | 15172 | 249 |
| B | 0 | 22132 | 263 |
| C | 0 | 28427 | 492 |
| D | 0 | 38650 | 556 |
| Quadrant | Total seconds | Saturated seconds | Saturation percentage |
|---|---|---|---|
| A | 5736 | 228 | 3.974895% |
| B | 5735 | 908 | 15.832607% |
| C | 5722 | 1830 | 31.981825% |
| D | 5726 | 3236 | 56.514146% |
Noise dominated data is calculated using 1-second bins in cleaned event files. If a bin has >2000 counts, and if more than 50% of those come from <1% of pixels, then it is considered to be noise-dominated and hence unusable.
| Quadrant | # 1 sec bins | Bins with >0 counts | Bins with >2000 counts | High rate bins dominated by noise | Noise dominated (total time) | Noise dominated (detector-on time) | Marked lightcurve |
|---|---|---|---|---|---|---|---|
| A | 7009 | 5753 | 153 | 153 | 2.18% | 2.66% | 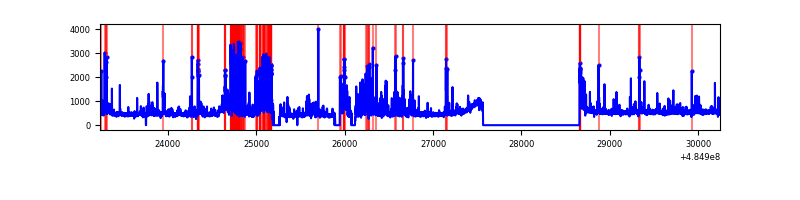 |
| B | 7009 | 5755 | 670 | 670 | 9.56% | 11.64% | 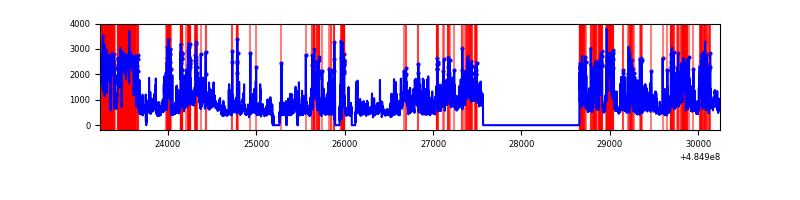 |
| C | 7009 | 5736 | 1622 | 1622 | 23.14% | 28.28% | 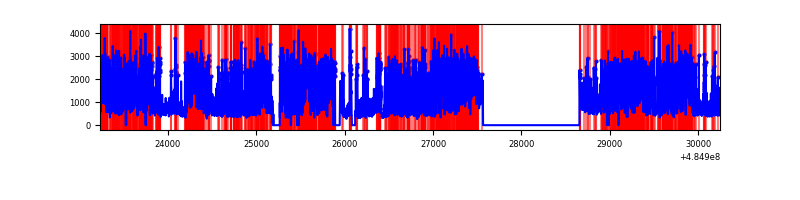 |
| D | 7009 | 5740 | 3244 | 3244 | 46.28% | 56.52% |  |
Top three noisy pixels from each quadrant. If the there are fewer than three noisy pixels in the level2.evt file, extra rows are filled as -1
| Pixel properties | Quadrant properties | ||||||
|---|---|---|---|---|---|---|---|
| Quadrant | DetID | PixID | Counts | Sigma | Mean | Median | Sigma |
| A | 3 | 14 | 492392 | 3140.39 | 618 | 604 | 156.6 |
| A | 3 | 95 | 174036 | 1107.48 | 618 | 604 | 156.6 |
| A | 4 | 3 | 137218 | 872.37 | 618 | 604 | 156.6 |
| B | 5 | 172 | 1378151 | 11319.26 | 572 | 554 | 121.7 |
| B | 10 | 128 | 1186581 | 9745.19 | 572 | 554 | 121.7 |
| B | 12 | 3 | 306639 | 2515.0 | 572 | 554 | 121.7 |
| C | 15 | 224 | 5044193 | 33933.34 | 523 | 519 | 148.6 |
| C | 5 | 80 | 148269 | 994.05 | 523 | 519 | 148.6 |
| C | 13 | 3 | 106369 | 712.15 | 523 | 519 | 148.6 |
| D | 15 | 94 | 4685641 | 38296.35 | 423 | 404 | 122.3 |
| D | 6 | 42 | 3735589 | 30530.79 | 423 | 404 | 122.3 |
| D | 12 | 3 | 455825 | 3722.54 | 423 | 404 | 122.3 |
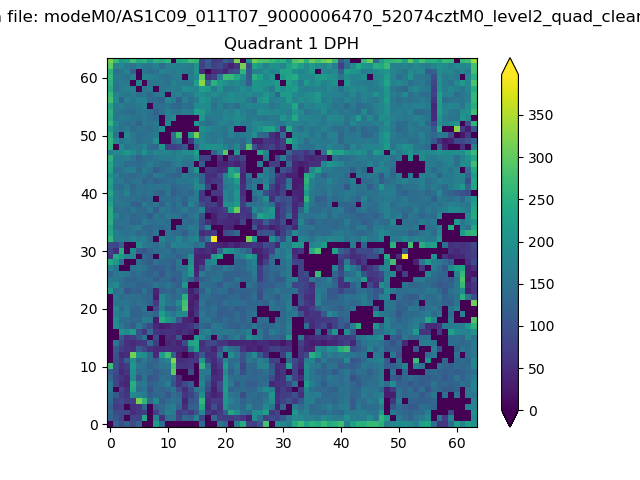
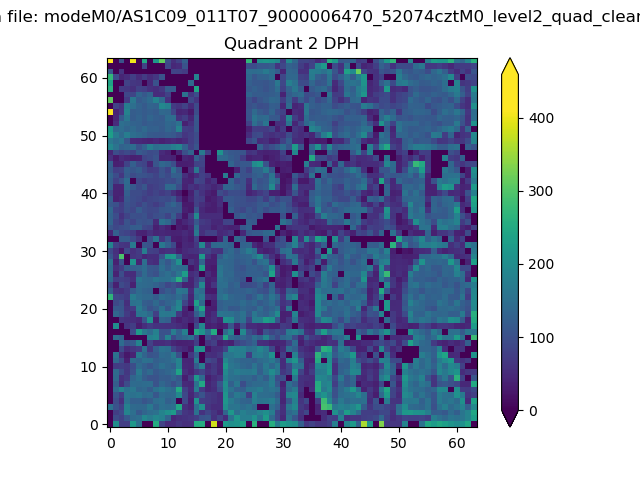
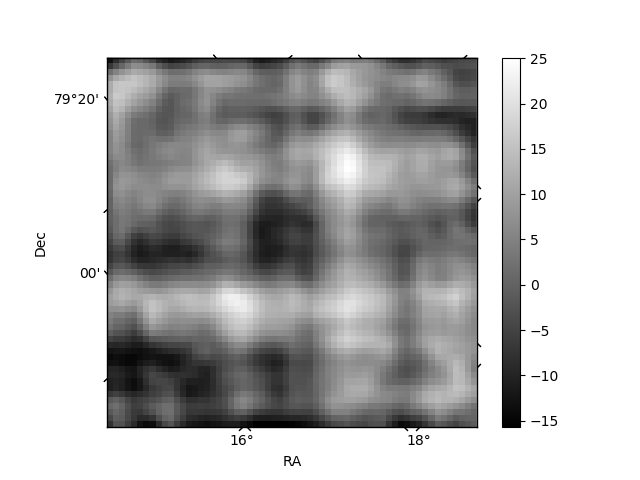
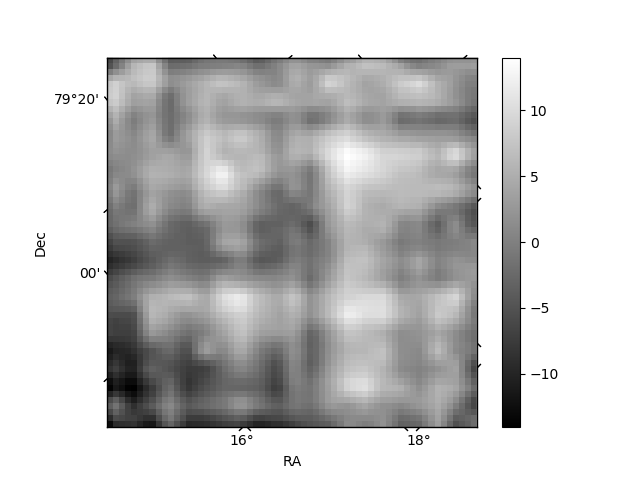
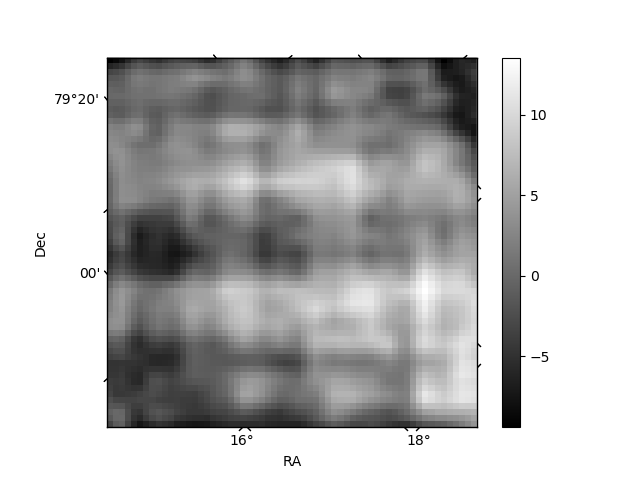
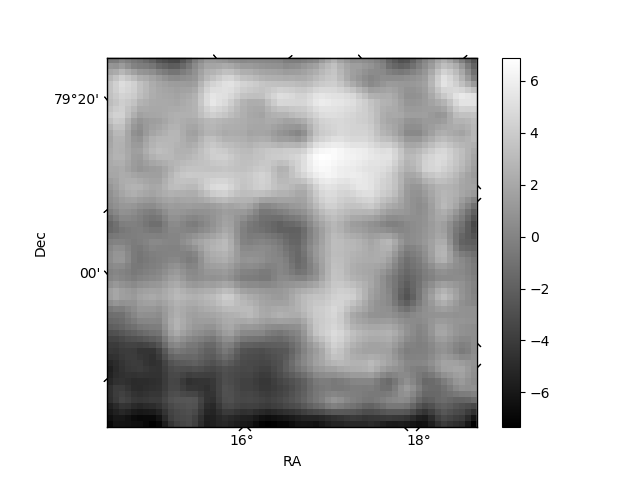
Histogram calculated using DETX and DETY for each event in the final _common_clean file
| Quadrant A | 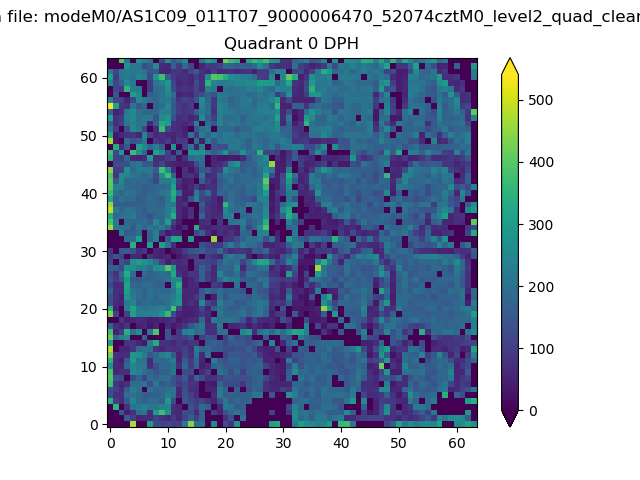 |
 |
Quadrant B |
|---|---|---|---|
| Quadrant D | 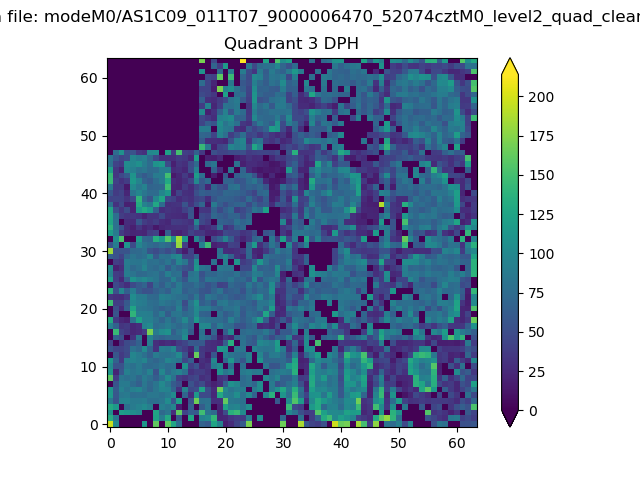 |
 |
Quadrant C |
| Plot type | Count rate plots | Images |
|---|---|---|
| Comparison with Poisson distribution Blue bars denote a histogram of data divided into 1 sec bins. Red curve is a Poisson curve with rate = median count rate of data. |
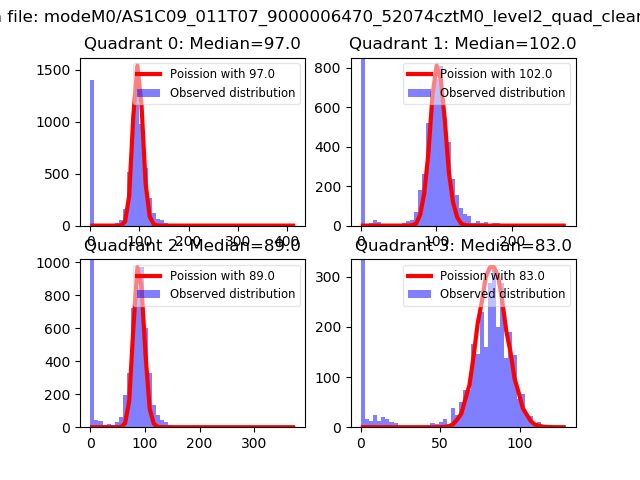 |
 |
| Quadrant-wise count rates Data is divided into 100 sec bins |
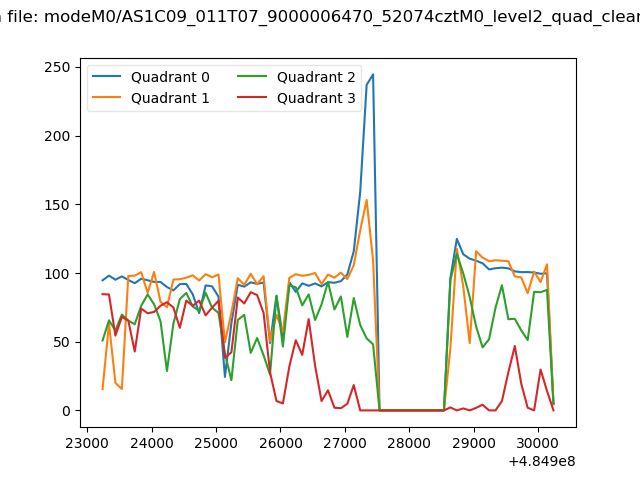 |
|
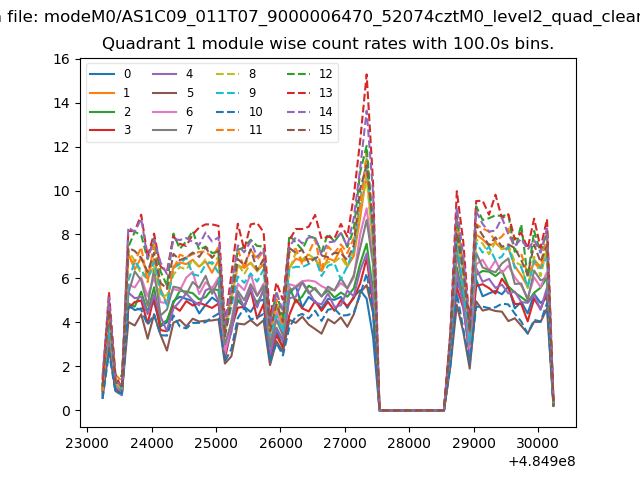
| Module-wise count rates for Quadrant A Data is divided into 100 sec bins |
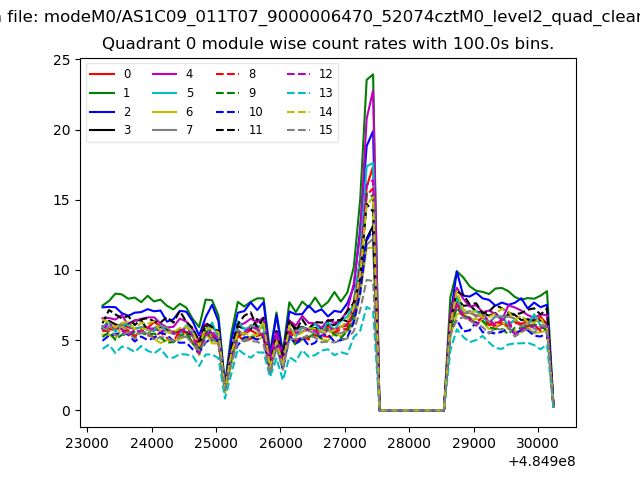 |
 |
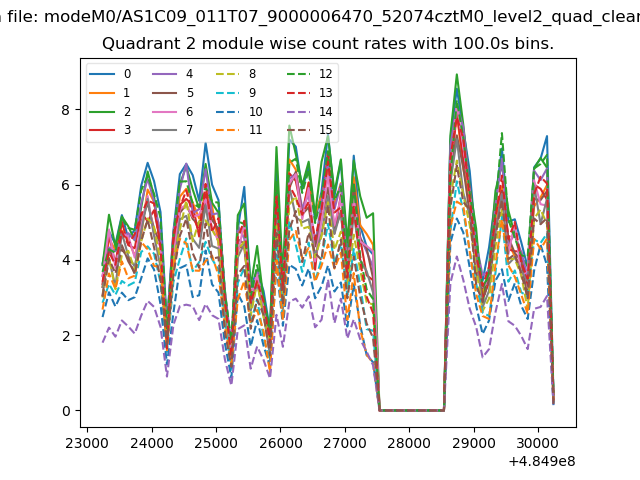
| Module-wise count rates for Quadrant B Data is divided into 100 sec bins |
 |
 |
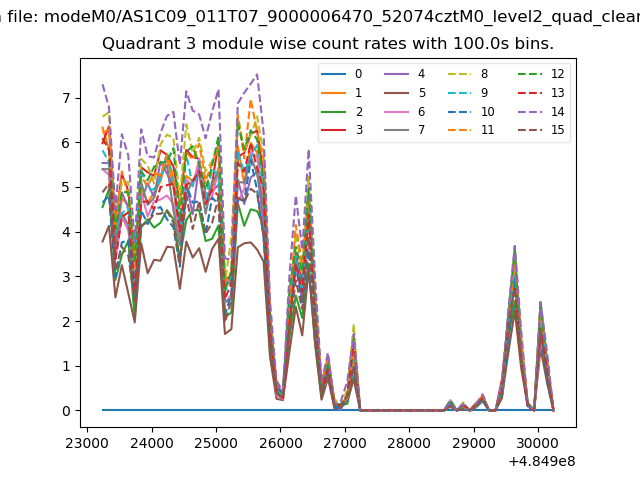
| Module-wise count rates for Quadrant C Data is divided into 100 sec bins |
 |
 |
| Module-wise count rates for Quadrant D Data is divided into 100 sec bins |
 |
 |
| Parameter | Plot |
|---|---|
| CZT HV Monitor | 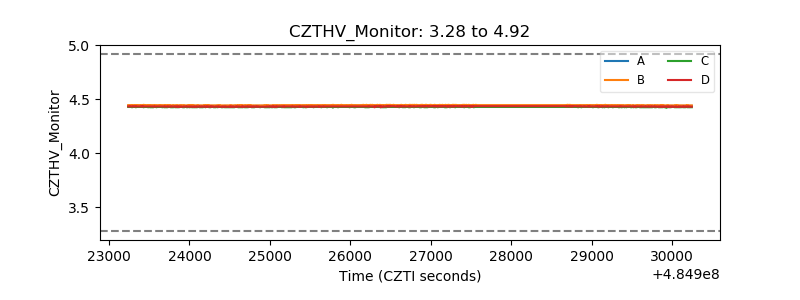 |
| D_VDD | 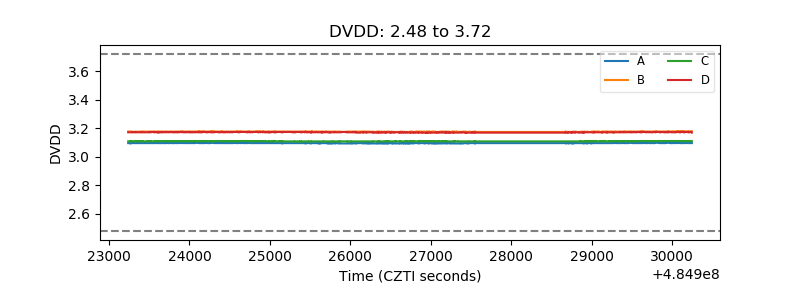 |
| Temperature 1 | 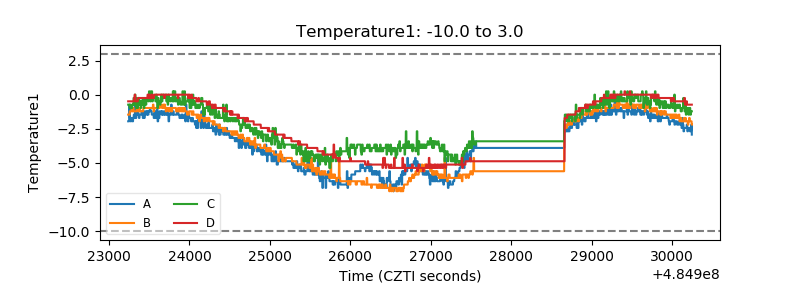 |
| Veto HV Monitor | 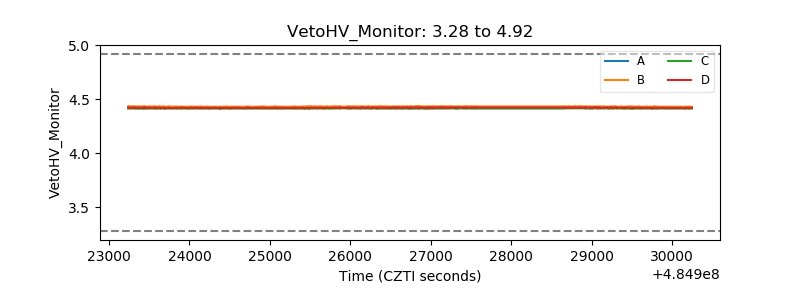 |
| Veto LLD | 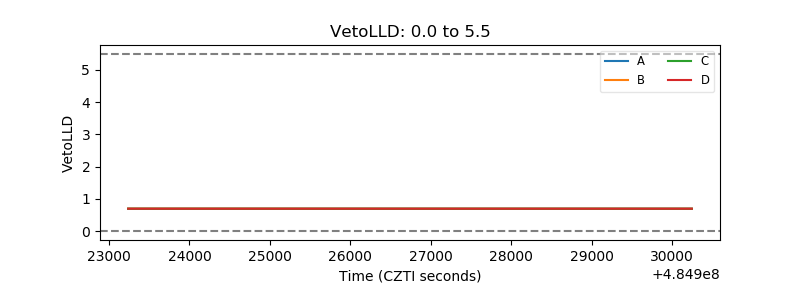 |
| Alpha Counter | 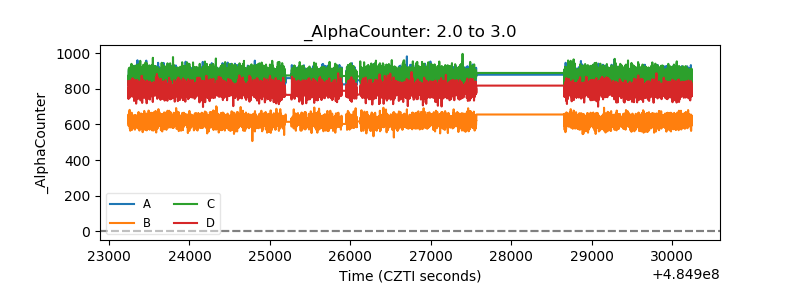 |
| _CPM_Rate | 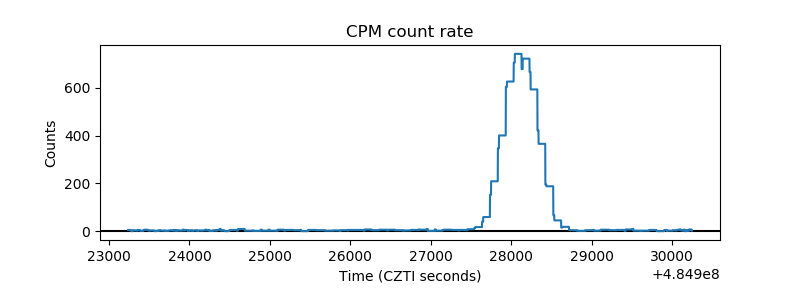 |
| CZT Counter | 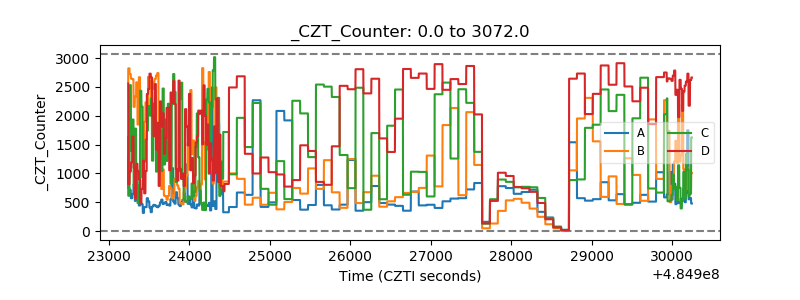 |
| +2.5 Volts monitor | 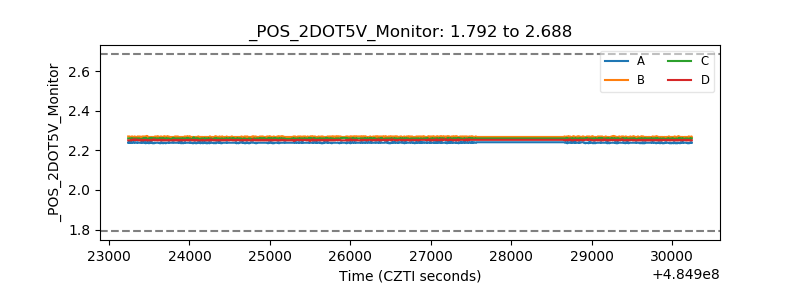 |
| +5 Volts monitor | 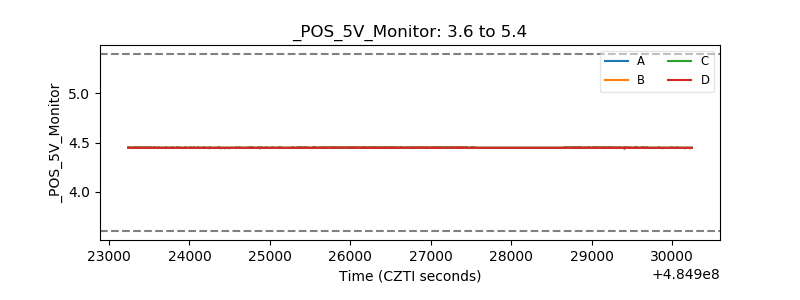 |
| _ROLL_ROT | 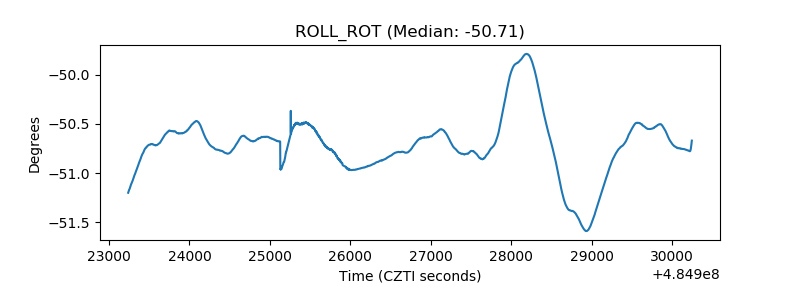 |
| _Roll_DEC | 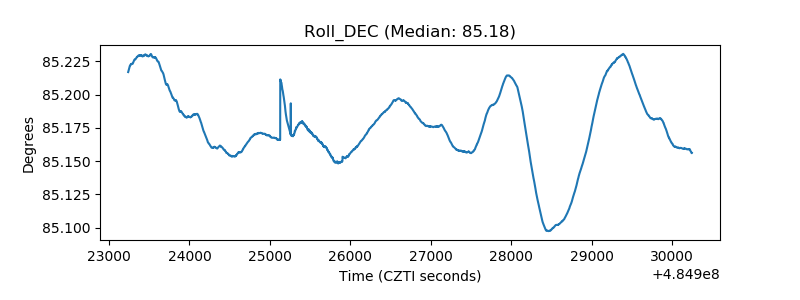 |
| _Roll_RA | 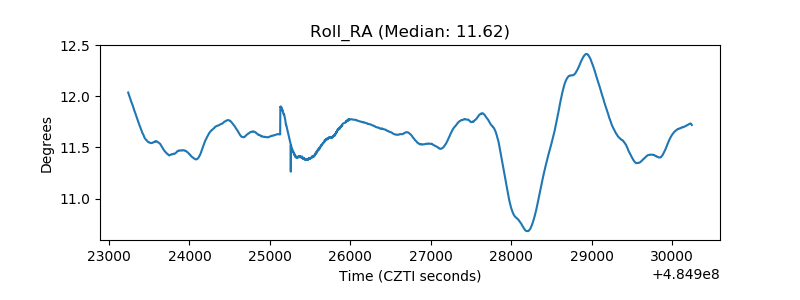 |
| Veto Counter | 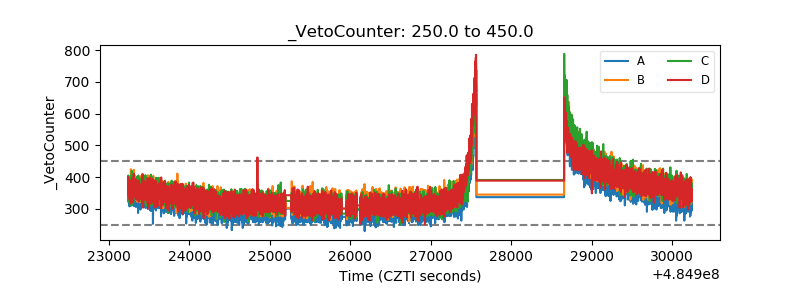 |