| Param | Original file | Final file |
|---|---|---|
| Filename | modeM0/AS1C09_011T07_9000006470_52075cztM0_level2.fits | modeM0/AS1C09_011T07_9000006470_52075cztM0_level2_quad_clean.evt |
| Size (bytes) | 939,672,000 | 68,362,560 |
| Size | 896.1 MB | 65.2 MB |
| Events in quadrant A | 4,091,368 | 582,987 |
| Events in quadrant B | 5,966,975 | 580,220 |
| Events in quadrant C | 8,963,561 | 404,885 |
| Events in quadrant D | 15,292,871 | 77,367 |
| Mode SS | |||
|---|---|---|---|
| Quadrant | BADHDUFLAG | Total packets | Discarded packets |
| A | 0 | 124 | 0 |
| B | 0 | 124 | 0 |
| C | 0 | 124 | 0 |
| D | 0 | 124 | 0 |
| Mode M9 | |||
|---|---|---|---|
| Quadrant | BADHDUFLAG | Total packets | Discarded packets |
| A | 0 | 11 | 0 |
| B | 0 | 11 | 0 |
| C | 0 | 11 | 0 |
| D | 0 | 11 | 0 |
| Mode M0 | |||
|---|---|---|---|
| Quadrant | BADHDUFLAG | Total packets | Discarded packets |
| A | 0 | 16115 | 1 |
| B | 0 | 21903 | 1 |
| C | 0 | 30820 | 1 |
| D | 0 | 49506 | 3 |
| Quadrant | Total seconds | Saturated seconds | Saturation percentage |
|---|---|---|---|
| A | 6069 | 301 | 4.959631% |
| B | 6070 | 796 | 13.113674% |
| C | 6070 | 2225 | 36.655684% |
| D | 6069 | 5383 | 88.696655% |
Noise dominated data is calculated using 1-second bins in cleaned event files. If a bin has >2000 counts, and if more than 50% of those come from <1% of pixels, then it is considered to be noise-dominated and hence unusable.
| Quadrant | # 1 sec bins | Bins with >0 counts | Bins with >2000 counts | High rate bins dominated by noise | Noise dominated (total time) | Noise dominated (detector-on time) | Marked lightcurve |
|---|---|---|---|---|---|---|---|
| A | 7209 | 6069 | 220 | 220 | 3.05% | 3.62% | 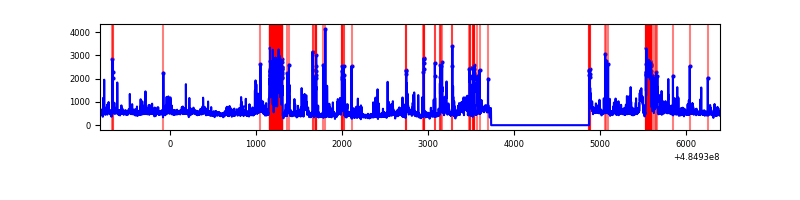 |
| B | 7210 | 6070 | 563 | 563 | 7.81% | 9.28% | 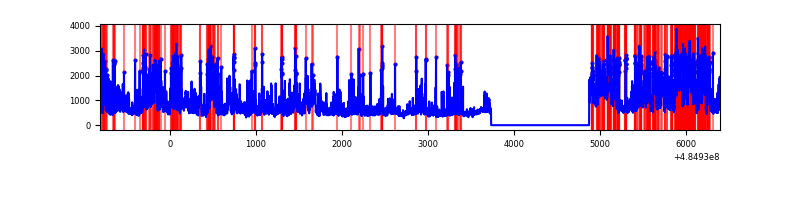 |
| C | 7210 | 6070 | 1959 | 1959 | 27.17% | 32.27% | 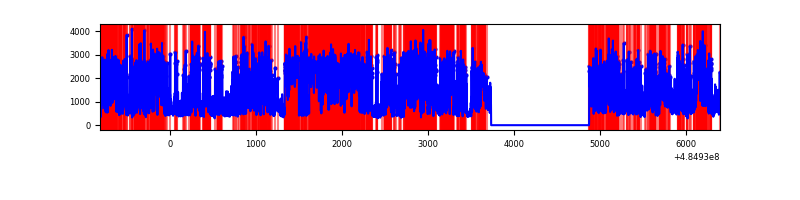 |
| D | 7208 | 6068 | 5380 | 5380 | 74.64% | 88.66% | 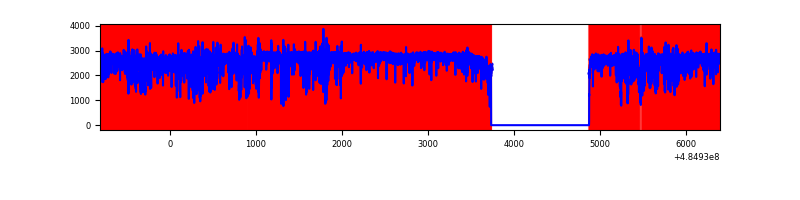 |
Top three noisy pixels from each quadrant. If the there are fewer than three noisy pixels in the level2.evt file, extra rows are filled as -1
| Pixel properties | Quadrant properties | ||||||
|---|---|---|---|---|---|---|---|
| Quadrant | DetID | PixID | Counts | Sigma | Mean | Median | Sigma |
| A | 8 | 43 | 460753 | 2875.69 | 640 | 624 | 160.0 |
| A | 6 | 196 | 313244 | 1953.8 | 640 | 624 | 160.0 |
| A | 4 | 3 | 250701 | 1562.92 | 640 | 624 | 160.0 |
| B | 10 | 128 | 2155783 | 16651.48 | 616 | 595 | 129.4 |
| B | 5 | 172 | 364469 | 2811.37 | 616 | 595 | 129.4 |
| B | 5 | 185 | 164399 | 1265.59 | 616 | 595 | 129.4 |
| C | 15 | 224 | 5065722 | 33536.15 | 540 | 533 | 151.0 |
| C | 5 | 80 | 947187 | 6267.71 | 540 | 533 | 151.0 |
| C | 13 | 3 | 304430 | 2012.07 | 540 | 533 | 151.0 |
| D | 15 | 94 | 8878570 | 99683.37 | 307 | 292 | 89.1 |
| D | 6 | 42 | 4131271 | 46381.73 | 307 | 292 | 89.1 |
| D | 12 | 3 | 428841 | 4811.65 | 307 | 292 | 89.1 |
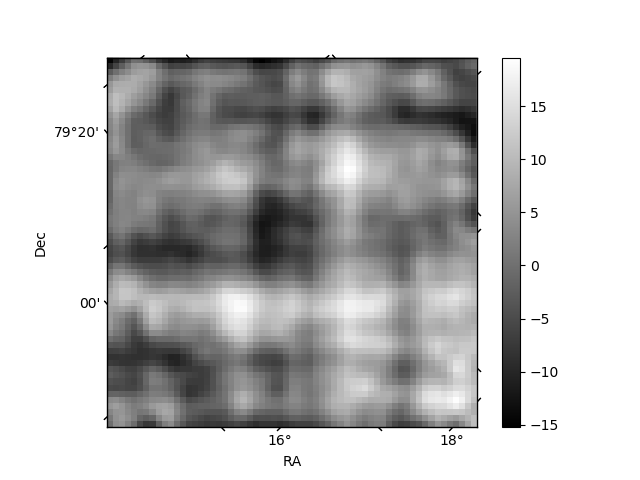
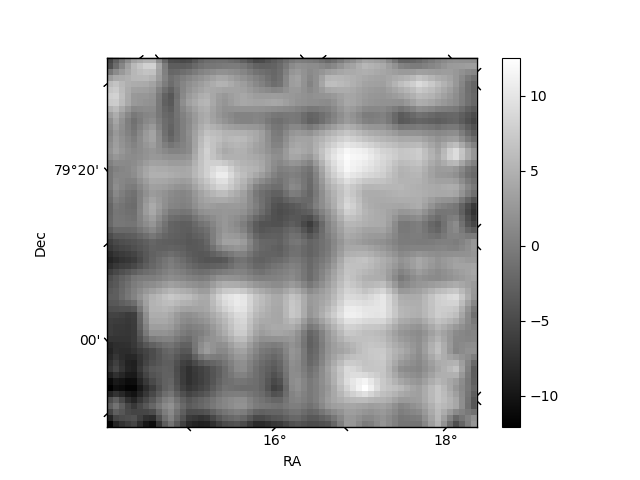
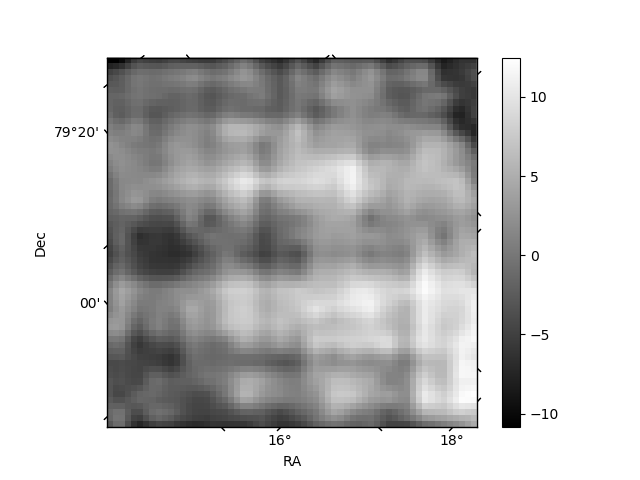
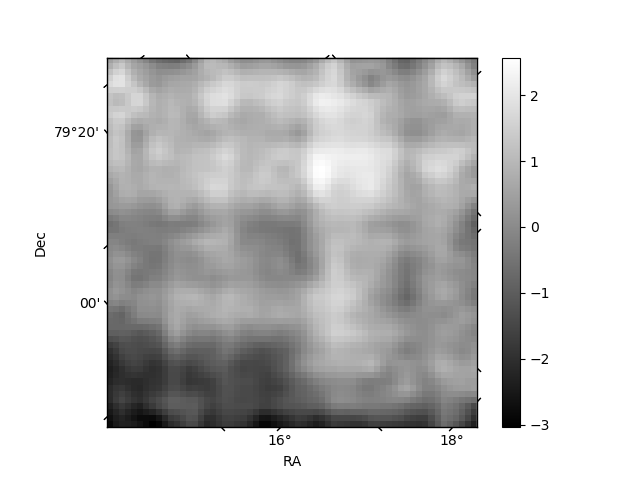
Histogram calculated using DETX and DETY for each event in the final _common_clean file
| Quadrant A | 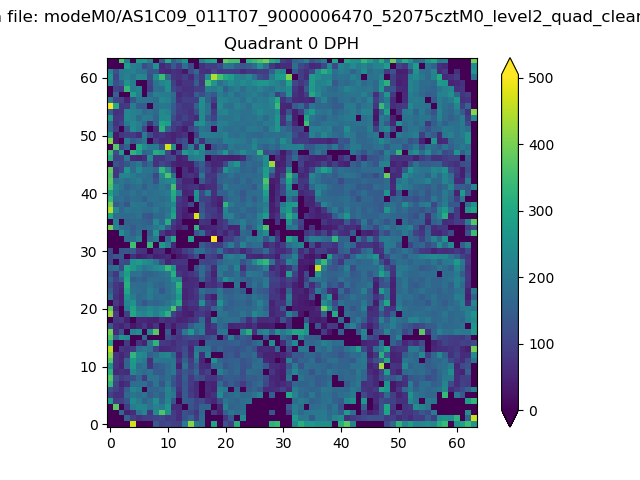 |
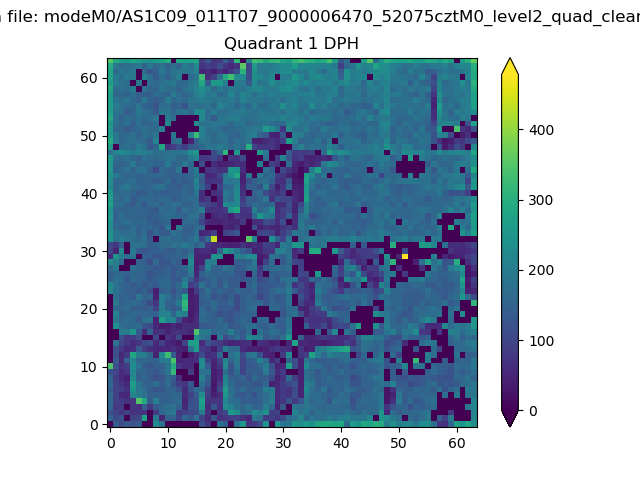 |
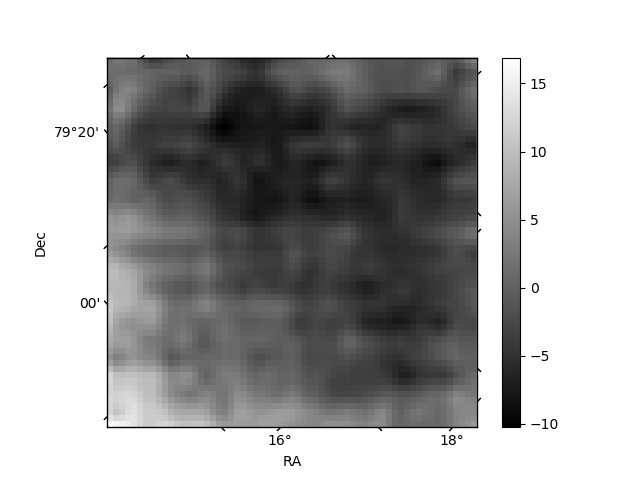
Quadrant B |
|---|---|---|---|
| Quadrant D | 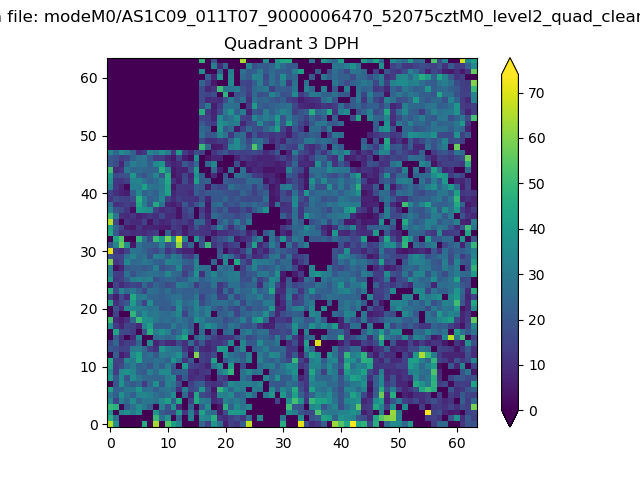 |
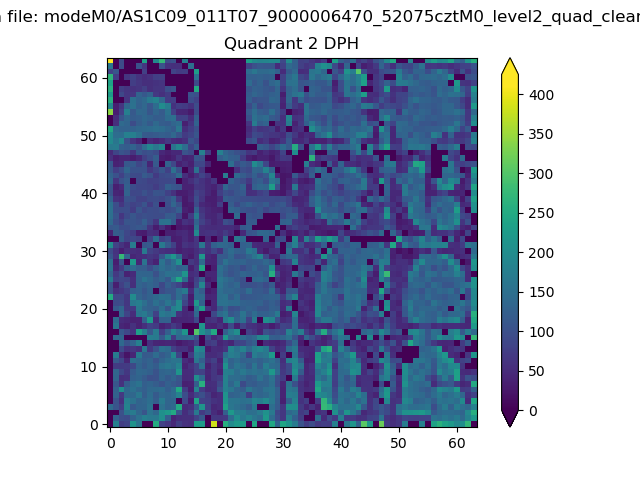 |
Quadrant C |
| Plot type | Count rate plots | Images |
|---|---|---|
| Comparison with Poisson distribution Blue bars denote a histogram of data divided into 1 sec bins. Red curve is a Poisson curve with rate = median count rate of data. |
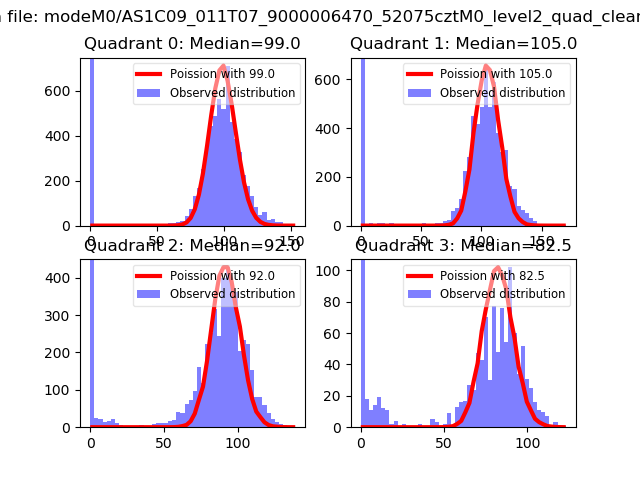 |
 |
| Quadrant-wise count rates Data is divided into 100 sec bins |
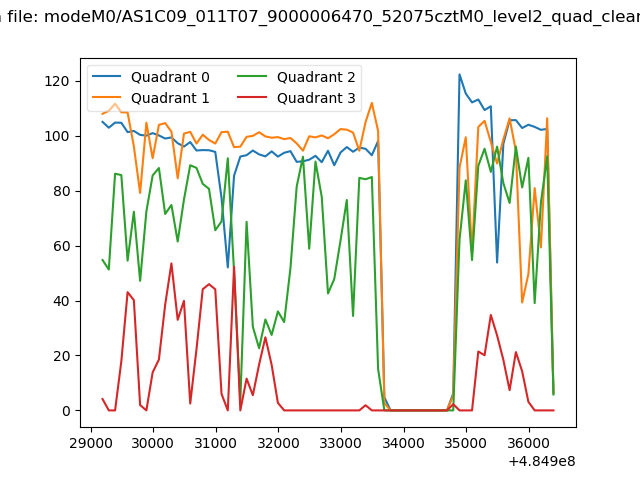 |
|
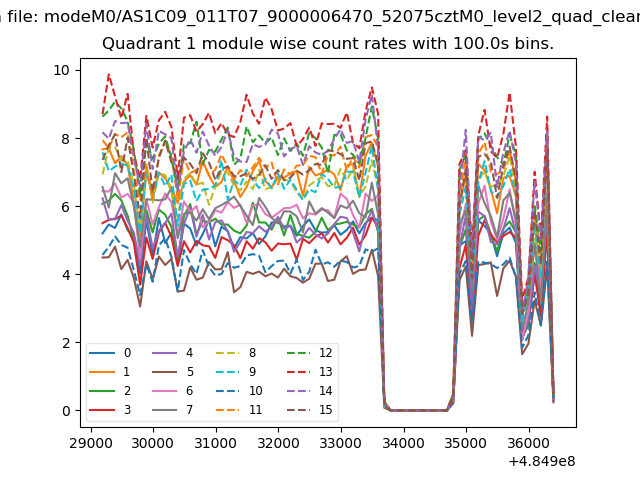
| Module-wise count rates for Quadrant A Data is divided into 100 sec bins |
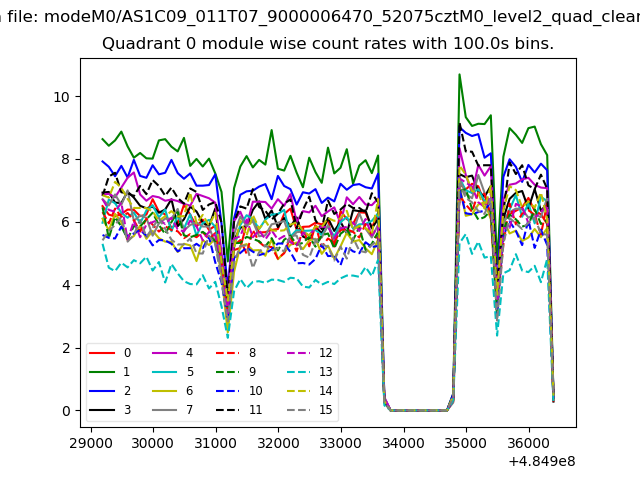 |
 |
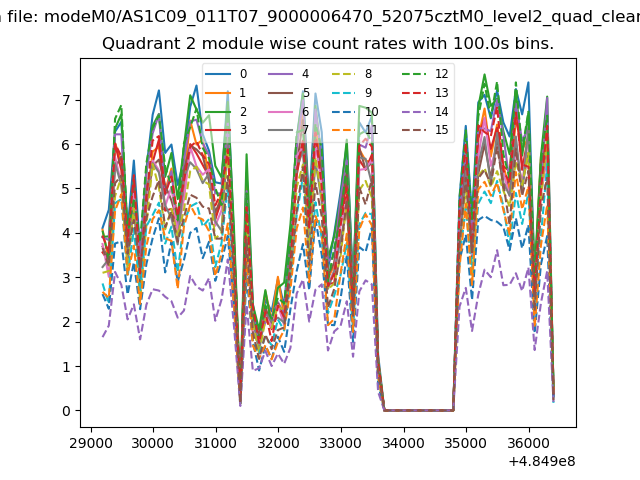
| Module-wise count rates for Quadrant B Data is divided into 100 sec bins |
 |
 |
| Module-wise count rates for Quadrant C Data is divided into 100 sec bins |
 |
 |
| Module-wise count rates for Quadrant D Data is divided into 100 sec bins |
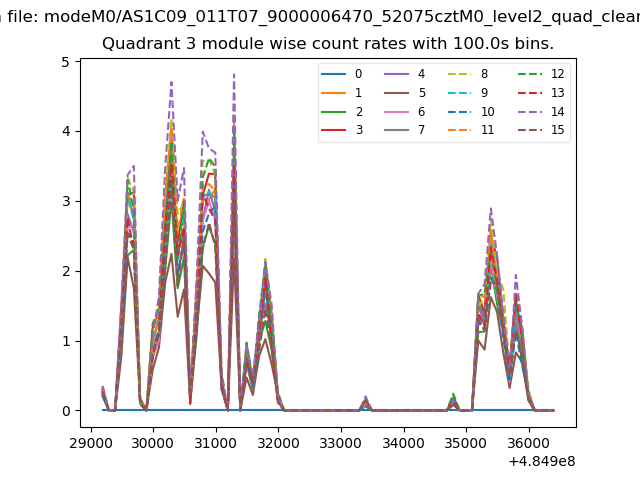 |
 |
| Parameter | Plot |
|---|---|
| CZT HV Monitor |  |
| D_VDD | 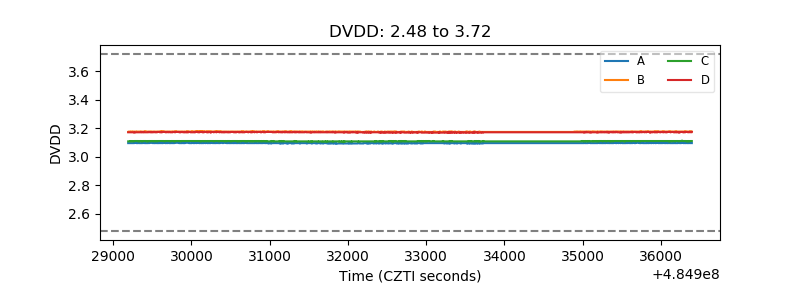 |
| Temperature 1 | 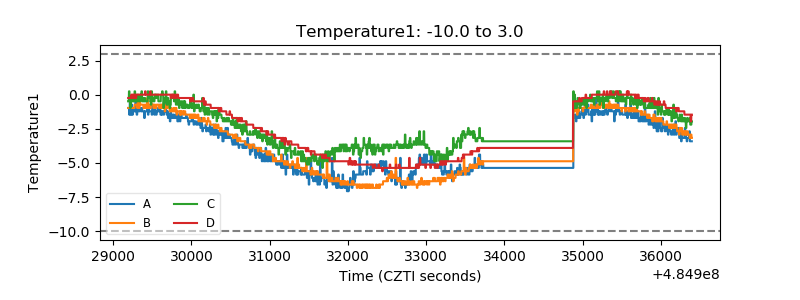 |
| Veto HV Monitor | 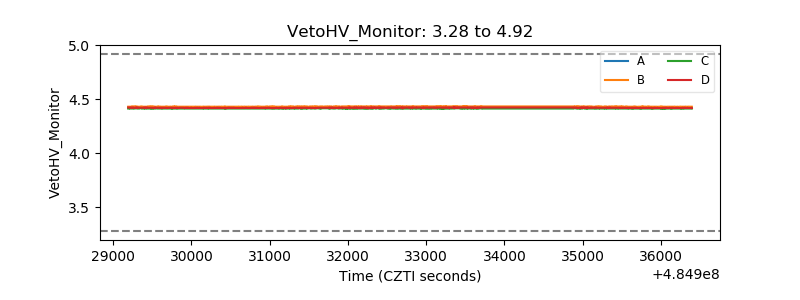 |
| Veto LLD | 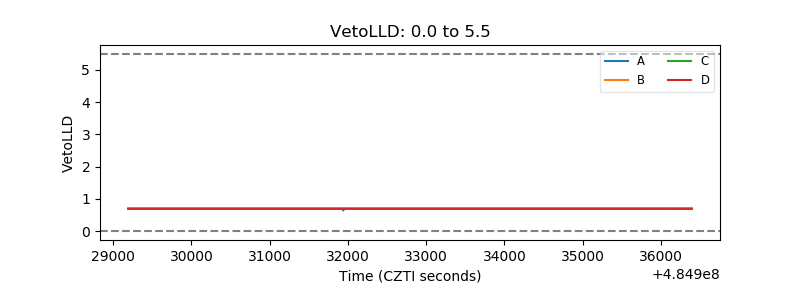 |
| Alpha Counter | 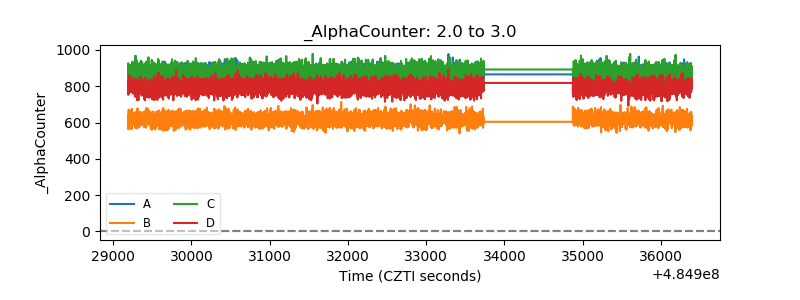 |
| _CPM_Rate | 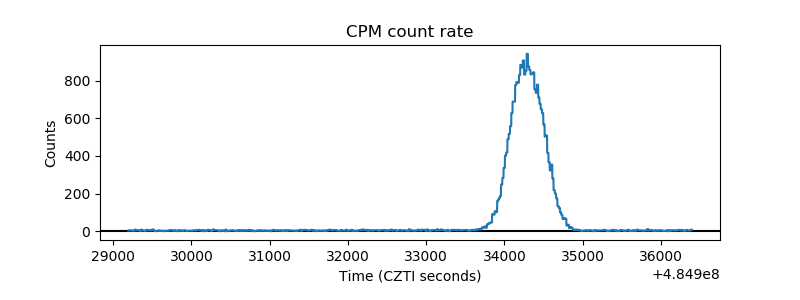 |
| CZT Counter | 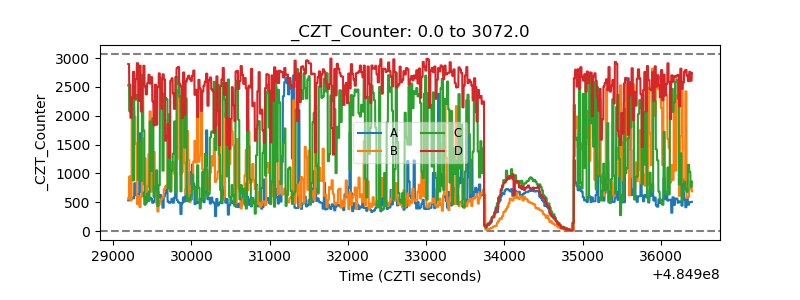 |
| +2.5 Volts monitor | 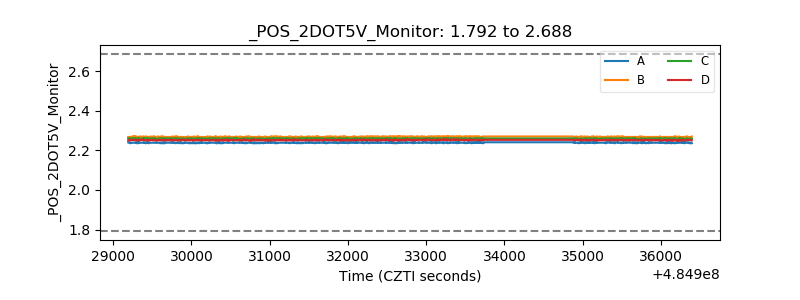 |
| +5 Volts monitor | 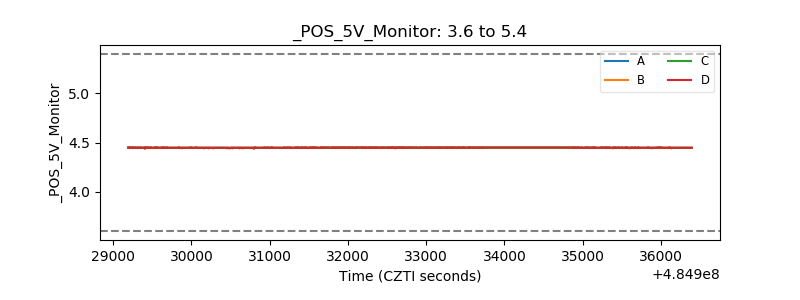 |
| _ROLL_ROT | 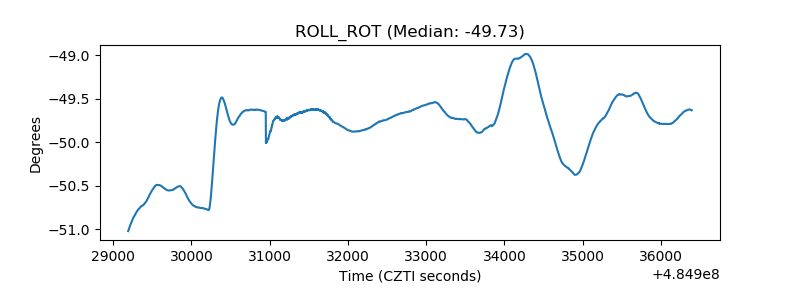 |
| _Roll_DEC | 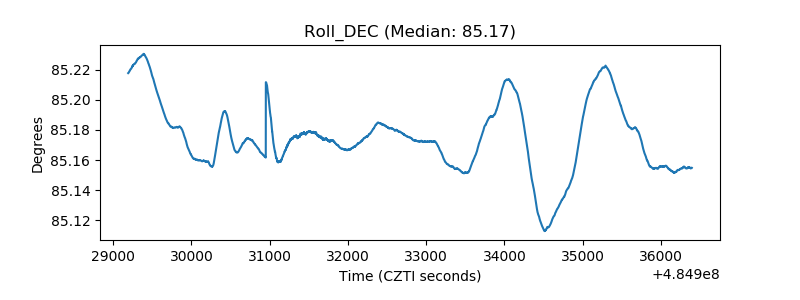 |
| _Roll_RA | 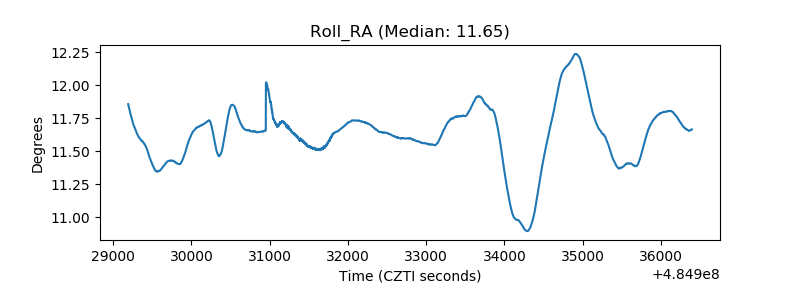 |
| Veto Counter | 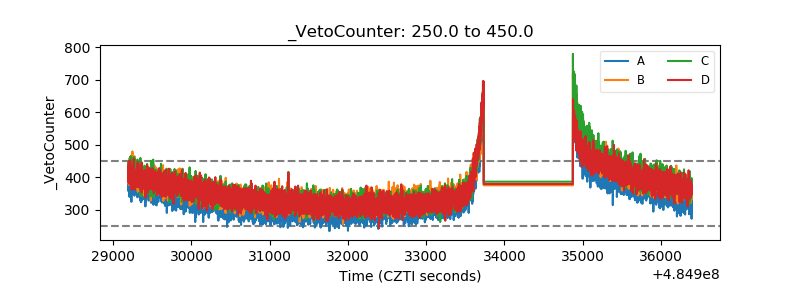 |