| Param | Original file | Final file |
|---|---|---|
| Filename | modeM0/AS1C09_011T07_9000006470_52076cztM0_level2.fits | modeM0/AS1C09_011T07_9000006470_52076cztM0_level2_quad_clean.evt |
| Size (bytes) | 825,120,000 | 64,722,240 |
| Size | 786.9 MB | 61.7 MB |
| Events in quadrant A | 3,412,619 | 548,025 |
| Events in quadrant B | 6,150,934 | 490,048 |
| Events in quadrant C | 6,931,001 | 442,273 |
| Events in quadrant D | 13,617,550 | 89,108 |
| Mode SS | |||
|---|---|---|---|
| Quadrant | BADHDUFLAG | Total packets | Discarded packets |
| A | 0 | 114 | 0 |
| B | 0 | 114 | 0 |
| C | 0 | 114 | 0 |
| D | 0 | 114 | 0 |
| Mode M9 | |||
|---|---|---|---|
| Quadrant | BADHDUFLAG | Total packets | Discarded packets |
| A | 0 | 12 | 0 |
| B | 0 | 12 | 0 |
| C | 0 | 12 | 0 |
| D | 0 | 12 | 0 |
| Mode M0 | |||
|---|---|---|---|
| Quadrant | BADHDUFLAG | Total packets | Discarded packets |
| A | 0 | 13803 | 1 |
| B | 0 | 22090 | 1 |
| C | 0 | 24517 | 5 |
| D | 0 | 44277 | 1 |
| Quadrant | Total seconds | Saturated seconds | Saturation percentage |
|---|---|---|---|
| A | 5571 | 135 | 2.423263% |
| B | 5571 | 1195 | 21.450368% |
| C | 5570 | 1351 | 24.254937% |
| D | 5571 | 4797 | 86.106624% |
Noise dominated data is calculated using 1-second bins in cleaned event files. If a bin has >2000 counts, and if more than 50% of those come from <1% of pixels, then it is considered to be noise-dominated and hence unusable.
| Quadrant | # 1 sec bins | Bins with >0 counts | Bins with >2000 counts | High rate bins dominated by noise | Noise dominated (total time) | Noise dominated (detector-on time) | Marked lightcurve |
|---|---|---|---|---|---|---|---|
| A | 6776 | 5572 | 101 | 101 | 1.49% | 1.81% | 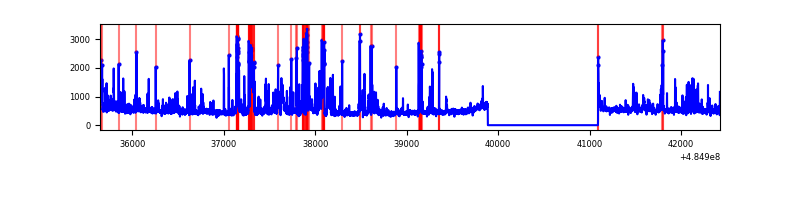 |
| B | 6776 | 5572 | 1075 | 1075 | 15.86% | 19.29% | 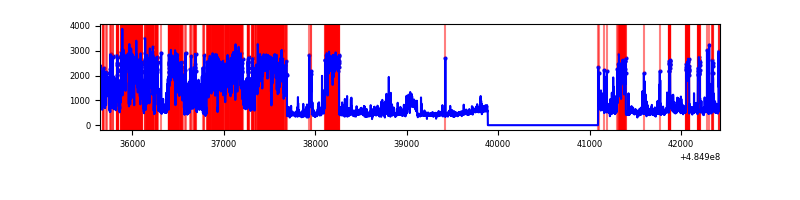 |
| C | 6774 | 5570 | 1231 | 1231 | 18.17% | 22.10% |  |
| D | 6775 | 5570 | 4727 | 4727 | 69.77% | 84.87% | 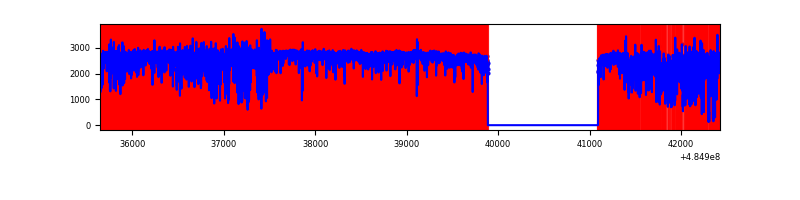 |
Top three noisy pixels from each quadrant. If the there are fewer than three noisy pixels in the level2.evt file, extra rows are filled as -1
| Pixel properties | Quadrant properties | ||||||
|---|---|---|---|---|---|---|---|
| Quadrant | DetID | PixID | Counts | Sigma | Mean | Median | Sigma |
| A | 6 | 196 | 396125 | 2701.06 | 585 | 569 | 146.4 |
| A | 4 | 3 | 185812 | 1264.93 | 585 | 569 | 146.4 |
| A | 6 | 162 | 110867 | 753.17 | 585 | 569 | 146.4 |
| B | 10 | 128 | 2978048 | 25613.38 | 550 | 532 | 116.2 |
| B | 5 | 172 | 442244 | 3799.72 | 550 | 532 | 116.2 |
| B | 8 | 128 | 69233 | 590.98 | 550 | 532 | 116.2 |
| C | 15 | 224 | 3725634 | 25357.4 | 533 | 529 | 146.9 |
| C | 5 | 80 | 252140 | 1712.76 | 533 | 529 | 146.9 |
| C | 13 | 3 | 234600 | 1593.36 | 533 | 529 | 146.9 |
| D | 15 | 94 | 8767998 | 114519.38 | 259 | 245 | 76.6 |
| D | 6 | 42 | 2542543 | 33206.04 | 259 | 245 | 76.6 |
| D | 3 | 12 | 383041 | 4999.86 | 259 | 245 | 76.6 |
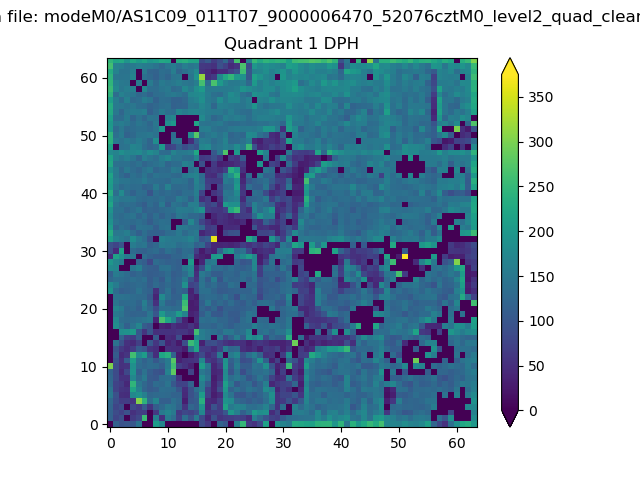
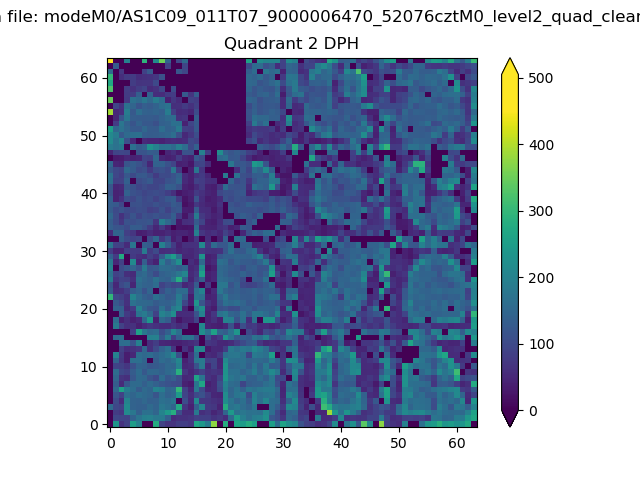
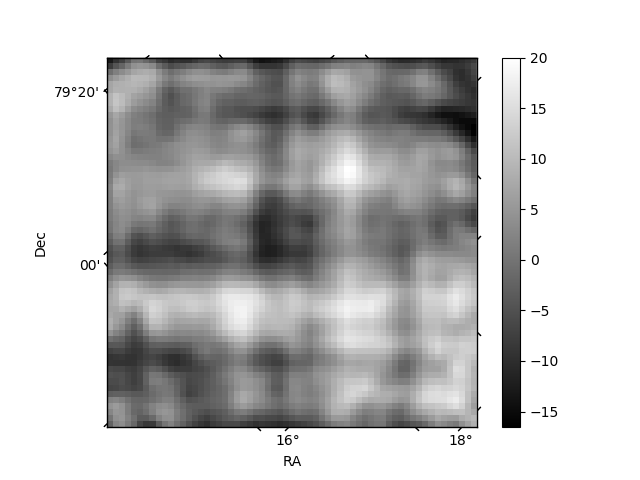
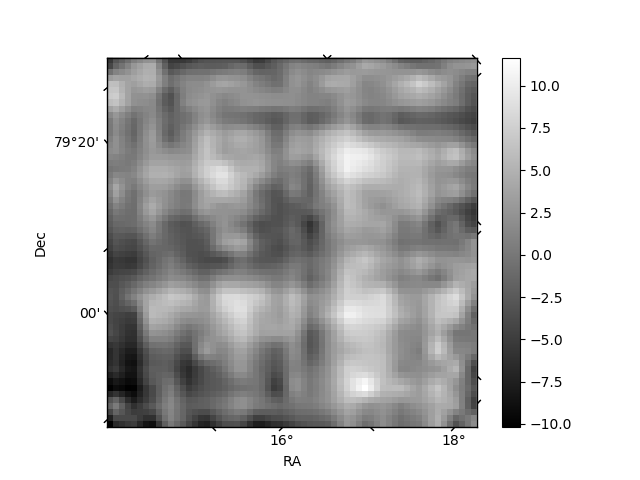
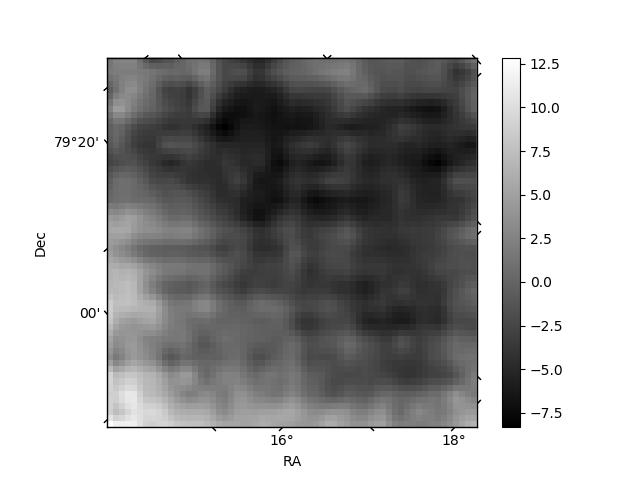
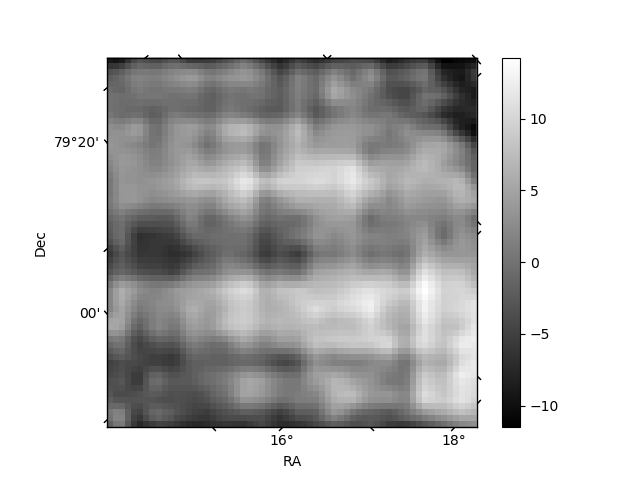
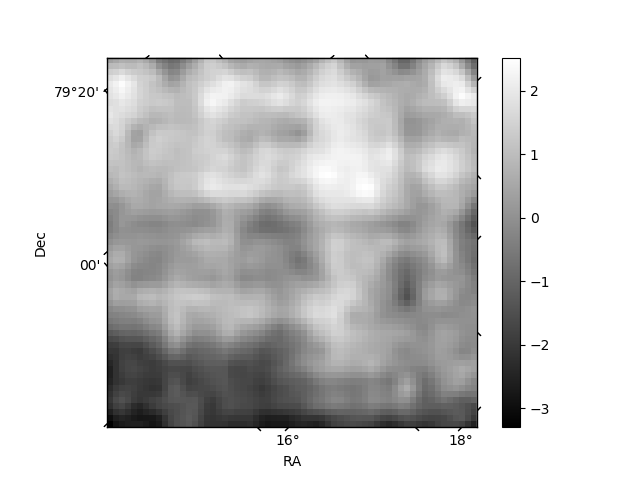
Histogram calculated using DETX and DETY for each event in the final _common_clean file
| Quadrant A | 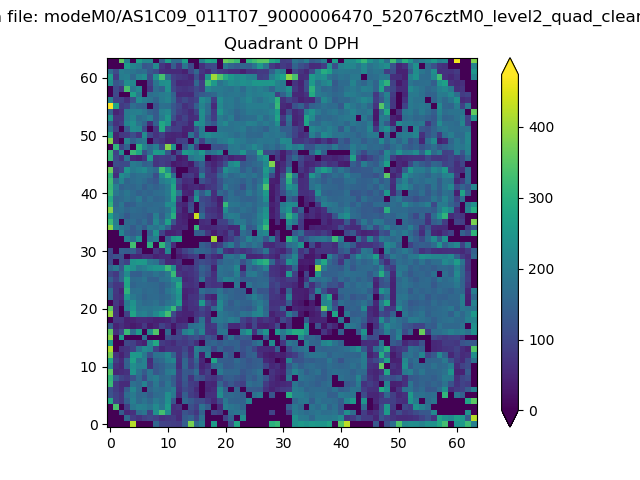 |
 |
Quadrant B |
|---|---|---|---|
| Quadrant D | 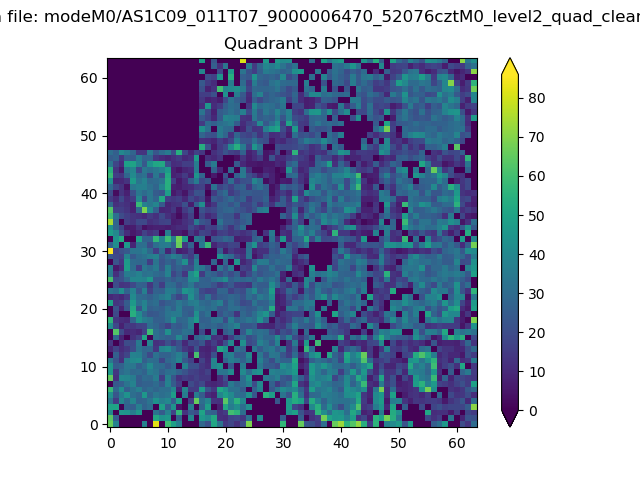 |
 |
Quadrant C |
| Plot type | Count rate plots | Images |
|---|---|---|
| Comparison with Poisson distribution Blue bars denote a histogram of data divided into 1 sec bins. Red curve is a Poisson curve with rate = median count rate of data. |
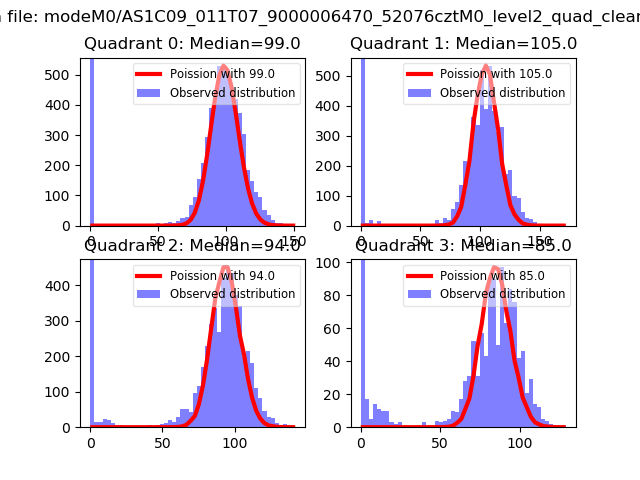 |
 |
| Quadrant-wise count rates Data is divided into 100 sec bins |
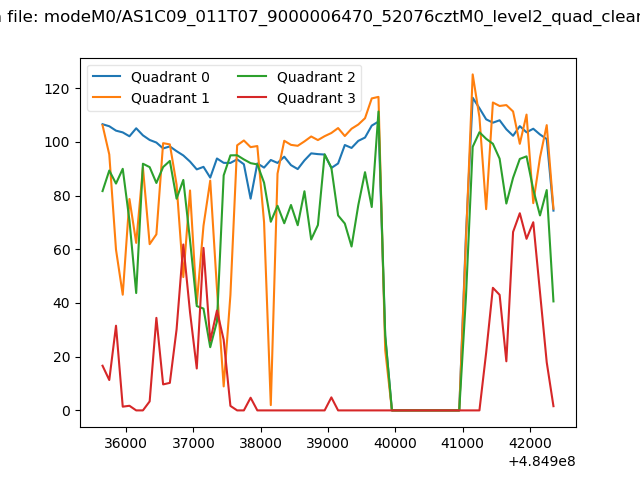 |
|
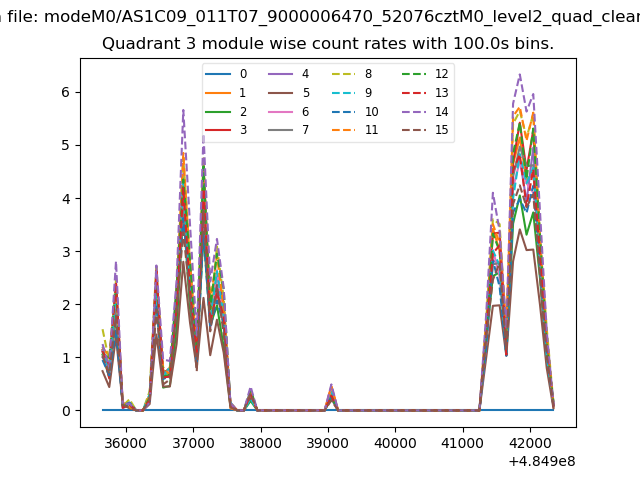
| Module-wise count rates for Quadrant A Data is divided into 100 sec bins |
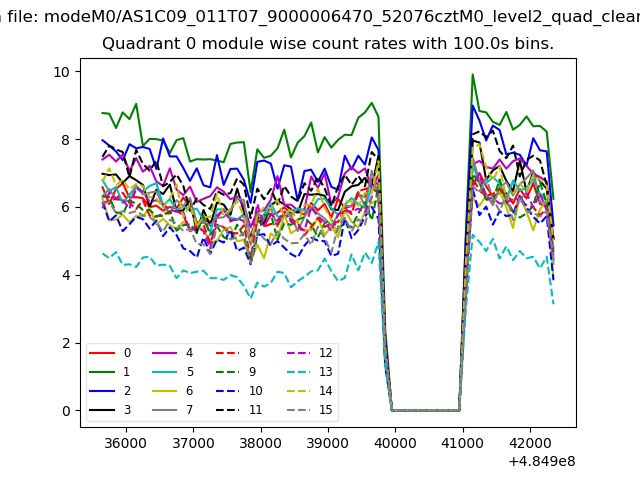 |
 |
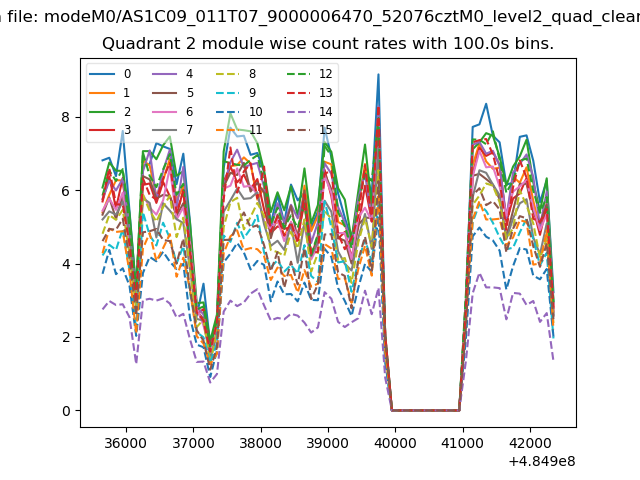
| Module-wise count rates for Quadrant B Data is divided into 100 sec bins |
 |
 |
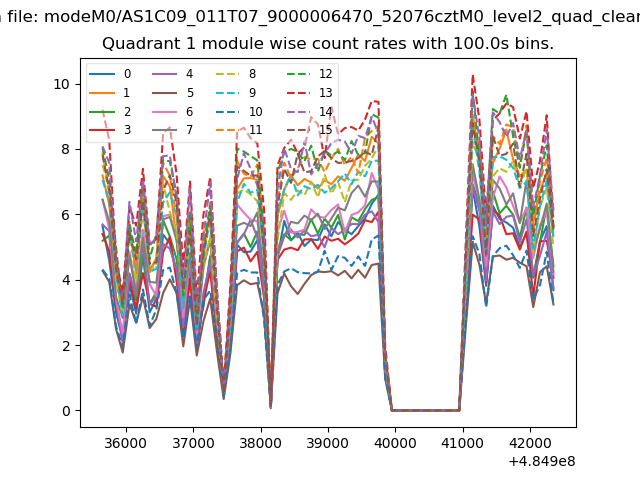
| Module-wise count rates for Quadrant C Data is divided into 100 sec bins |
 |
 |
| Module-wise count rates for Quadrant D Data is divided into 100 sec bins |
 |
 |
| Parameter | Plot |
|---|---|
| CZT HV Monitor | 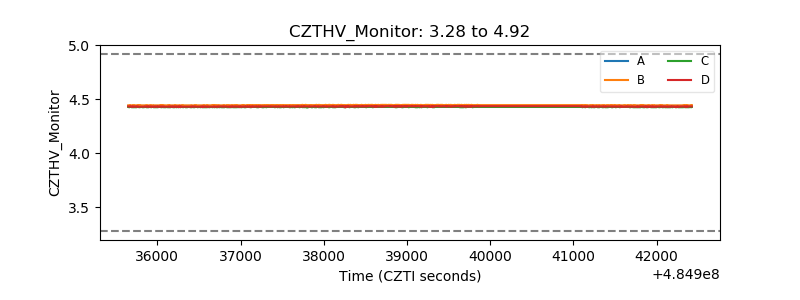 |
| D_VDD | 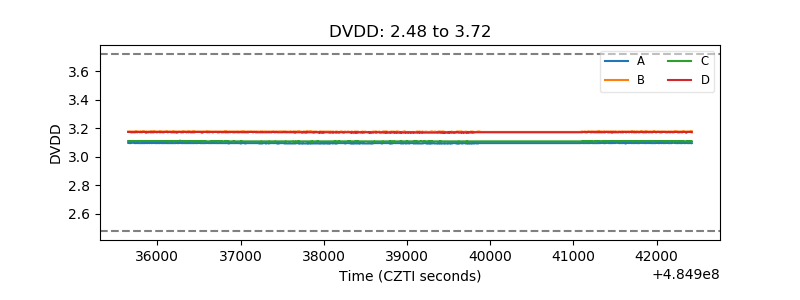 |
| Temperature 1 | 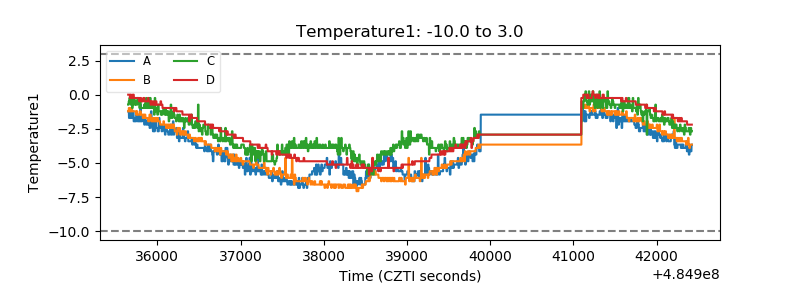 |
| Veto HV Monitor | 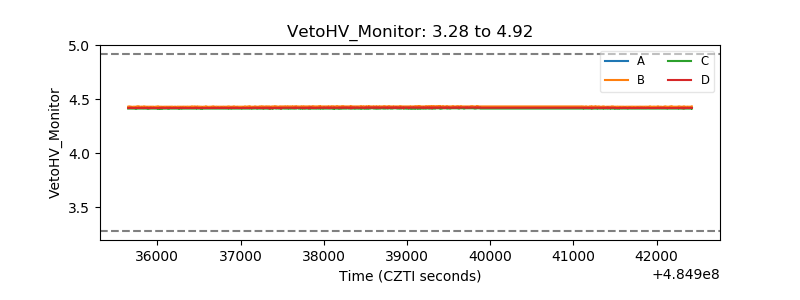 |
| Veto LLD | 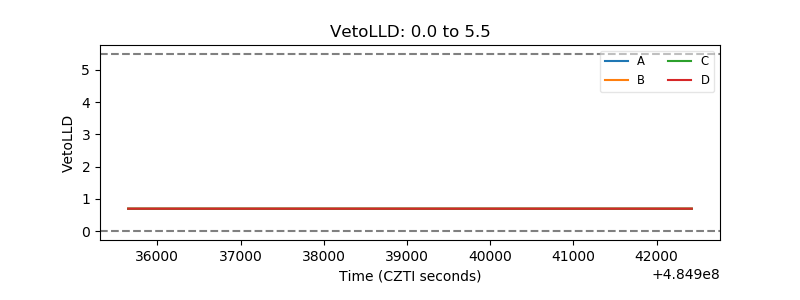 |
| Alpha Counter | 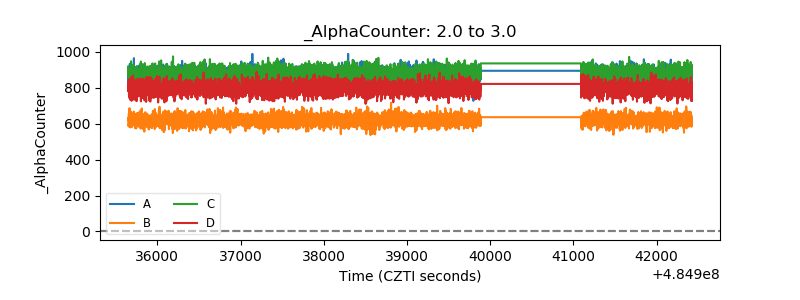 |
| _CPM_Rate | 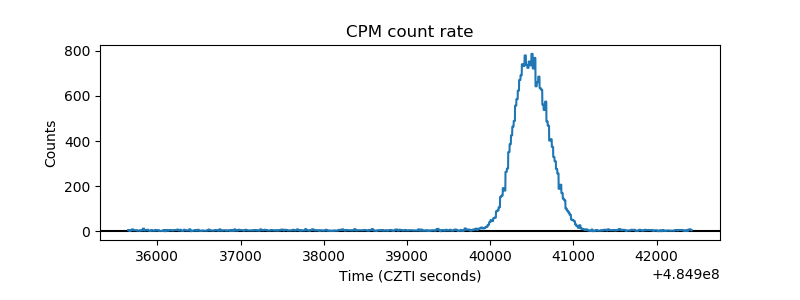 |
| CZT Counter | 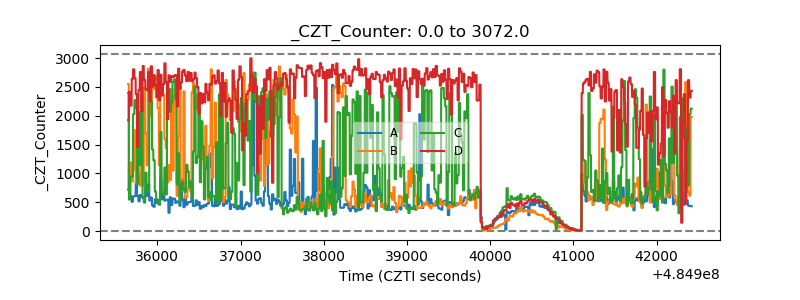 |
| +2.5 Volts monitor | 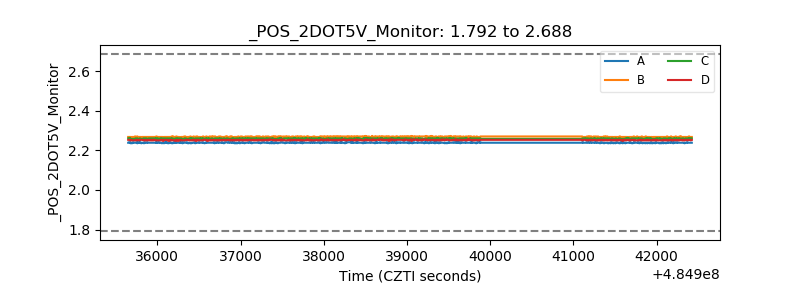 |
| +5 Volts monitor | 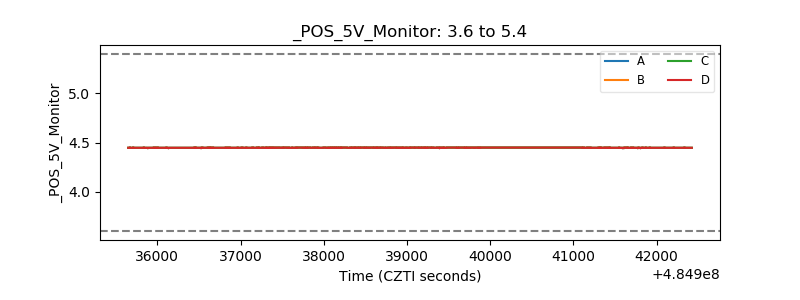 |
| _ROLL_ROT | 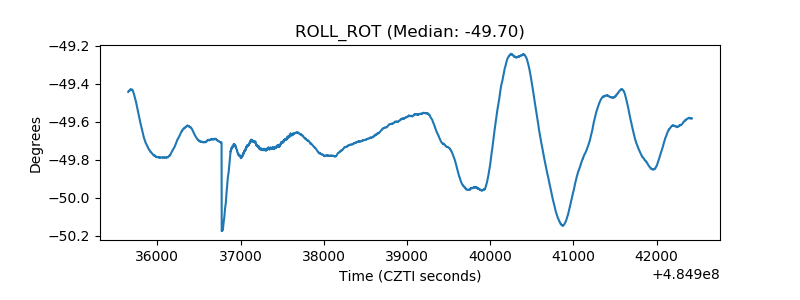 |
| _Roll_DEC | 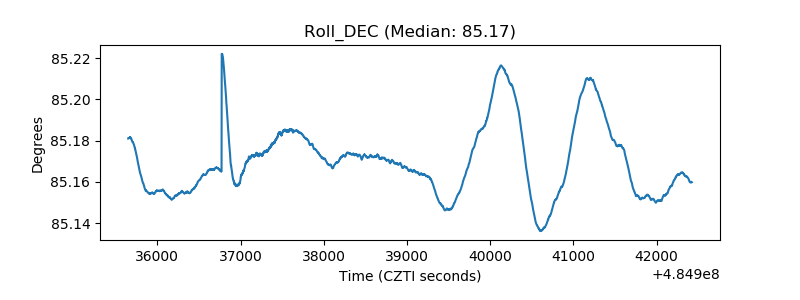 |
| _Roll_RA | 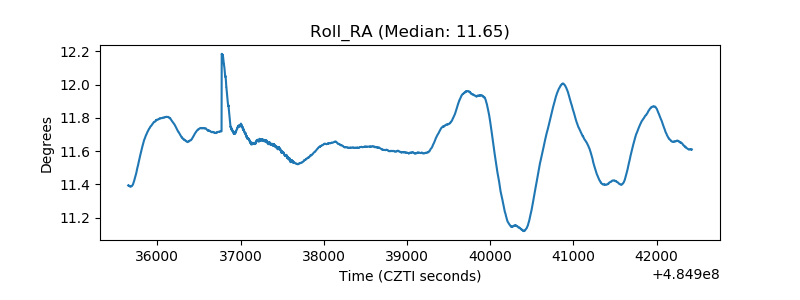 |
| Veto Counter | 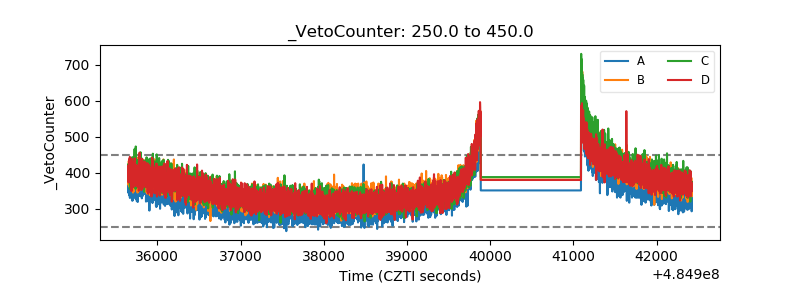 |