| Param | Original file | Final file |
|---|---|---|
| Filename | modeM0/AS1C09_011T07_9000006470_52077cztM0_level2.fits | modeM0/AS1C09_011T07_9000006470_52077cztM0_level2_quad_clean.evt |
| Size (bytes) | 896,192,640 | 69,379,200 |
| Size | 854.7 MB | 66.2 MB |
| Events in quadrant A | 4,219,501 | 549,549 |
| Events in quadrant B | 4,510,946 | 613,213 |
| Events in quadrant C | 9,094,395 | 410,107 |
| Events in quadrant D | 14,881,460 | 104,237 |
| Mode SS | |||
|---|---|---|---|
| Quadrant | BADHDUFLAG | Total packets | Discarded packets |
| A | 0 | 126 | 0 |
| B | 0 | 126 | 0 |
| C | 0 | 126 | 0 |
| D | 0 | 126 | 0 |
| Mode M9 | |||
|---|---|---|---|
| Quadrant | BADHDUFLAG | Total packets | Discarded packets |
| A | 0 | 11 | 0 |
| B | 0 | 11 | 0 |
| C | 0 | 11 | 0 |
| D | 0 | 11 | 0 |
| Mode M0 | |||
|---|---|---|---|
| Quadrant | BADHDUFLAG | Total packets | Discarded packets |
| A | 0 | 16602 | 1 |
| B | 0 | 17679 | 1 |
| C | 0 | 31199 | 2 |
| D | 0 | 48263 | 1 |
| Quadrant | Total seconds | Saturated seconds | Saturation percentage |
|---|---|---|---|
| A | 6051 | 500 | 8.263097% |
| B | 6052 | 348 | 5.750165% |
| C | 6051 | 2195 | 36.274996% |
| D | 6051 | 5081 | 83.969592% |
Noise dominated data is calculated using 1-second bins in cleaned event files. If a bin has >2000 counts, and if more than 50% of those come from <1% of pixels, then it is considered to be noise-dominated and hence unusable.
| Quadrant | # 1 sec bins | Bins with >0 counts | Bins with >2000 counts | High rate bins dominated by noise | Noise dominated (total time) | Noise dominated (detector-on time) | Marked lightcurve |
|---|---|---|---|---|---|---|---|
| A | 7221 | 6052 | 423 | 423 | 5.86% | 6.99% |  |
| B | 7222 | 6052 | 257 | 257 | 3.56% | 4.25% | 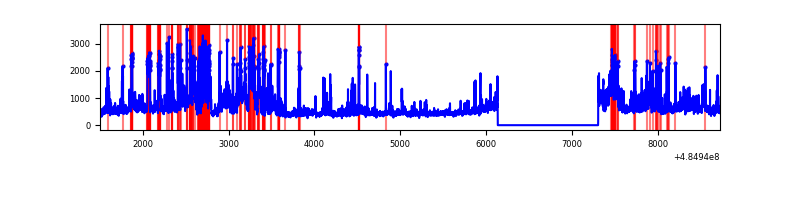 |
| C | 7220 | 6050 | 1987 | 1987 | 27.52% | 32.84% |  |
| D | 7220 | 6050 | 5035 | 5035 | 69.74% | 83.22% | 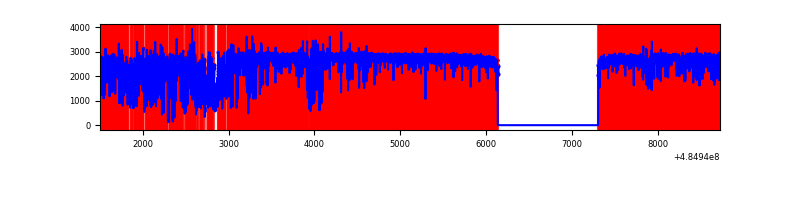 |
Top three noisy pixels from each quadrant. If the there are fewer than three noisy pixels in the level2.evt file, extra rows are filled as -1
| Pixel properties | Quadrant properties | ||||||
|---|---|---|---|---|---|---|---|
| Quadrant | DetID | PixID | Counts | Sigma | Mean | Median | Sigma |
| A | 3 | 95 | 1178456 | 7848.19 | 601 | 587 | 150.1 |
| A | 6 | 196 | 162561 | 1079.24 | 601 | 587 | 150.1 |
| A | 4 | 3 | 114249 | 757.33 | 601 | 587 | 150.1 |
| B | 10 | 128 | 696883 | 5259.7 | 625 | 604 | 132.4 |
| B | 5 | 185 | 507718 | 3830.75 | 625 | 604 | 132.4 |
| B | 5 | 172 | 233942 | 1762.64 | 625 | 604 | 132.4 |
| C | 15 | 224 | 5567334 | 38086.23 | 523 | 518 | 146.2 |
| C | 12 | 252 | 351759 | 2403.07 | 523 | 518 | 146.2 |
| C | 5 | 80 | 225124 | 1536.68 | 523 | 518 | 146.2 |
| D | 15 | 94 | 10402680 | 124127.64 | 285 | 271 | 83.8 |
| D | 6 | 42 | 2106568 | 25133.57 | 285 | 271 | 83.8 |
| D | 3 | 12 | 565902 | 6749.44 | 285 | 271 | 83.8 |
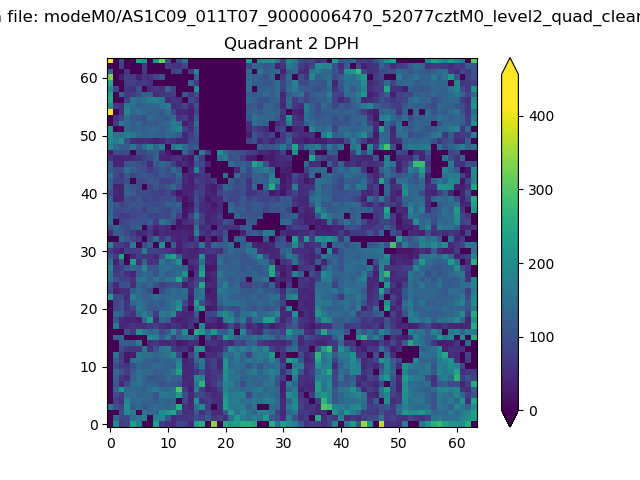
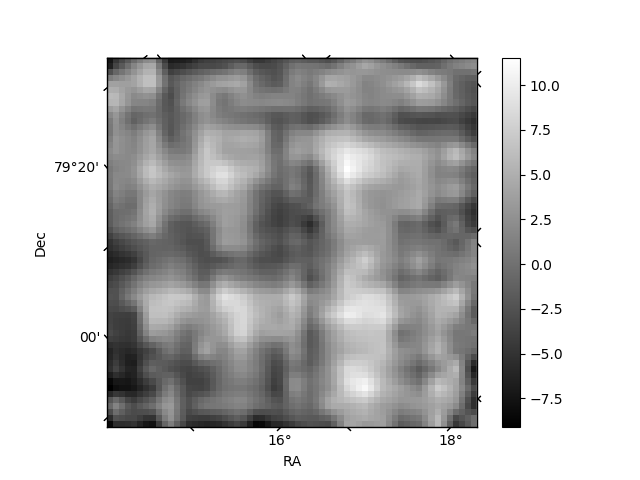
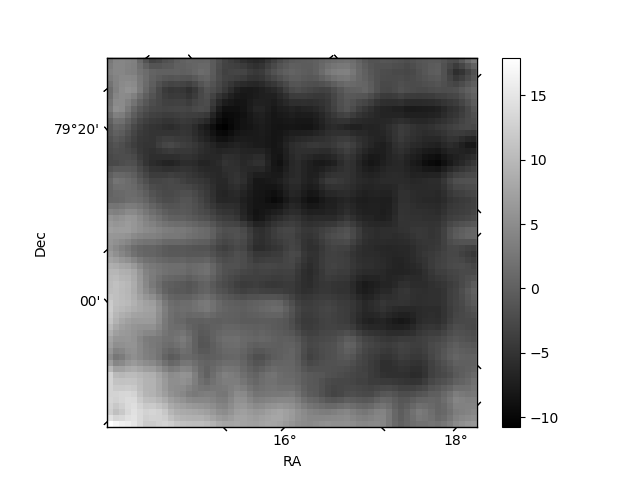
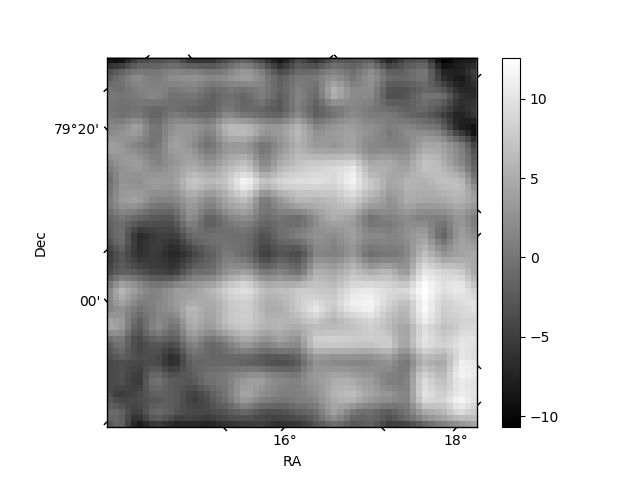
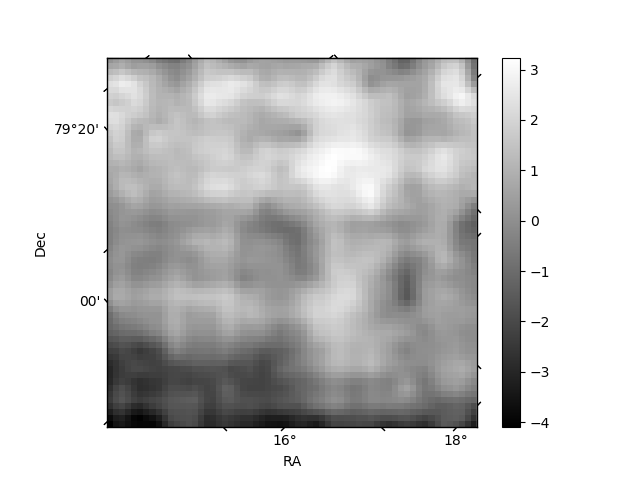
Histogram calculated using DETX and DETY for each event in the final _common_clean file
| Quadrant A | 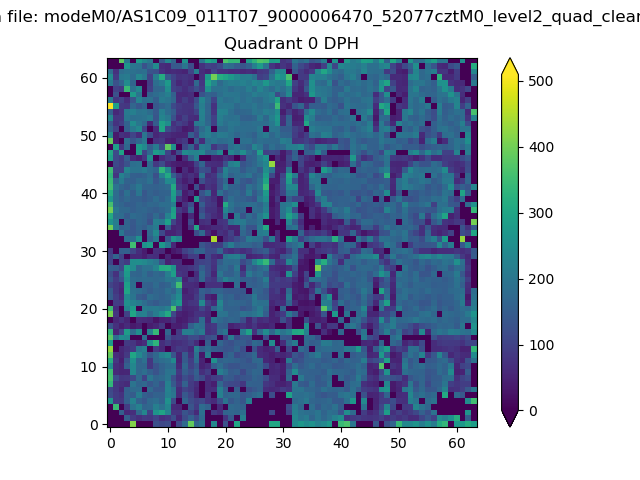 |
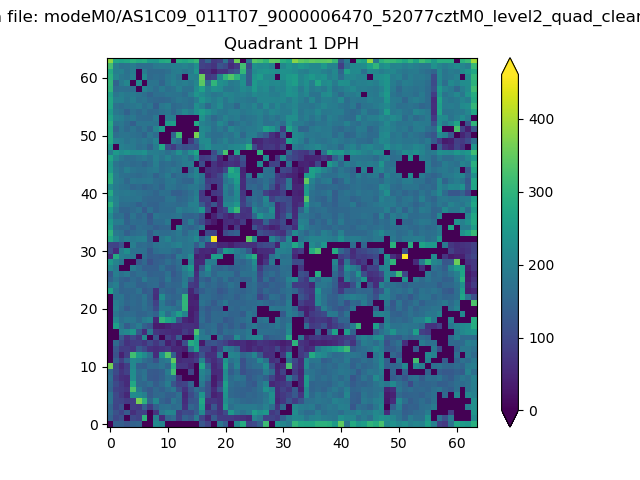 |
Quadrant B |
|---|---|---|---|
| Quadrant D | 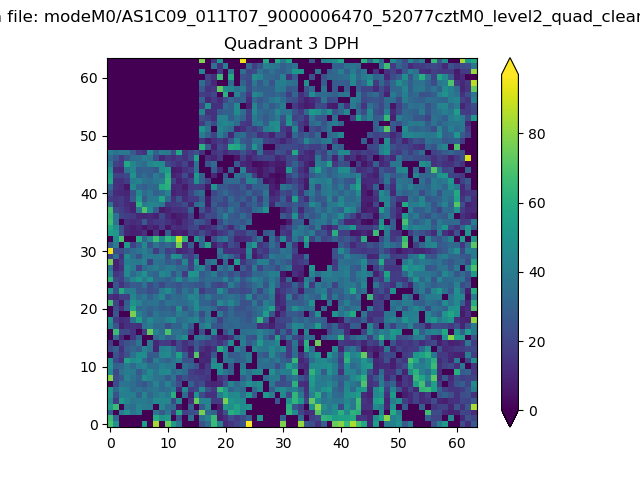 |
 |
Quadrant C |
| Plot type | Count rate plots | Images |
|---|---|---|
| Comparison with Poisson distribution Blue bars denote a histogram of data divided into 1 sec bins. Red curve is a Poisson curve with rate = median count rate of data. |
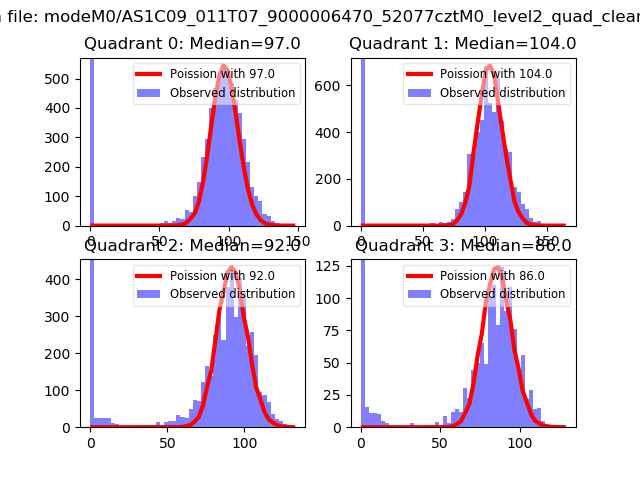 |
 |
| Quadrant-wise count rates Data is divided into 100 sec bins |
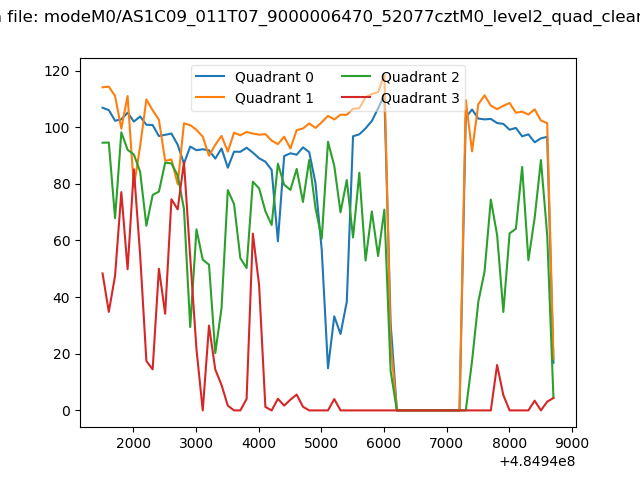 |
|
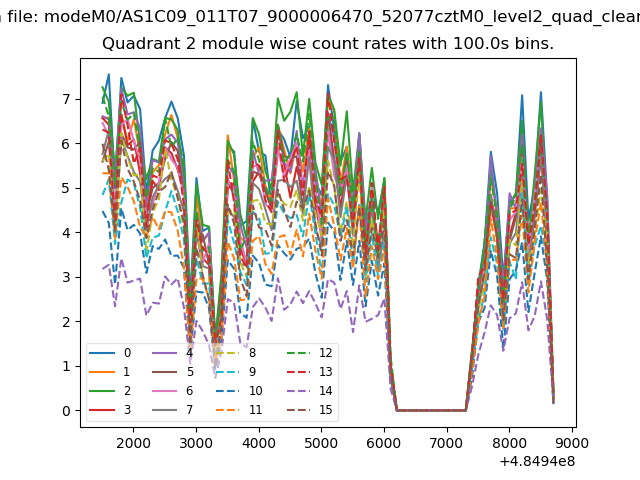
| Module-wise count rates for Quadrant A Data is divided into 100 sec bins |
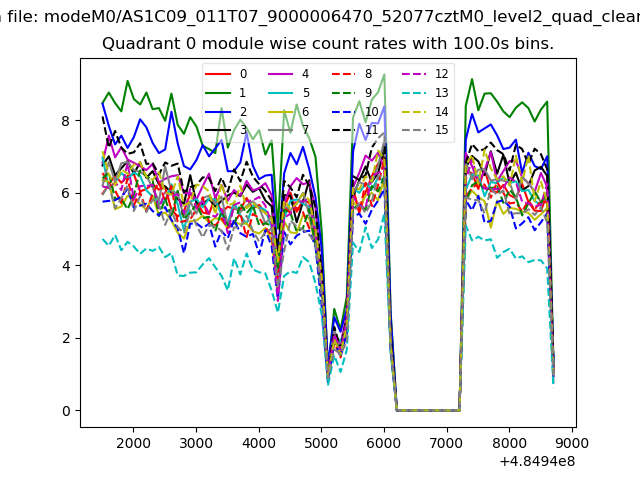 |
 |
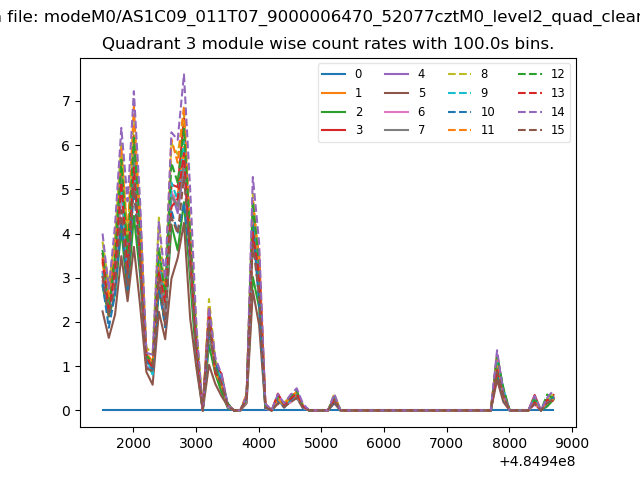
| Module-wise count rates for Quadrant B Data is divided into 100 sec bins |
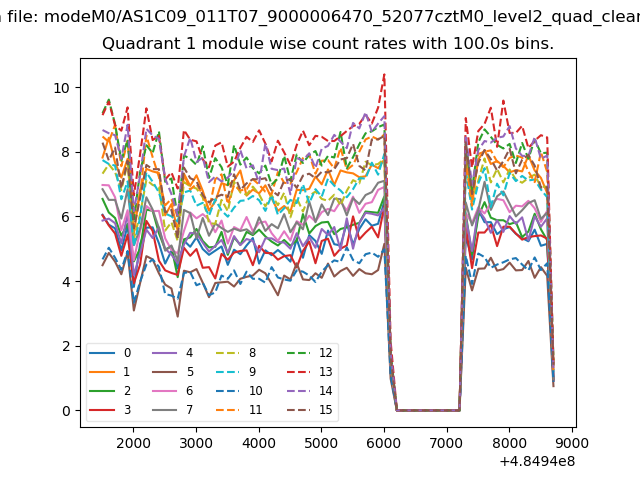 |
 |
| Module-wise count rates for Quadrant C Data is divided into 100 sec bins |
 |
 |
| Module-wise count rates for Quadrant D Data is divided into 100 sec bins |
 |
 |
| Parameter | Plot |
|---|---|
| CZT HV Monitor |  |
| D_VDD | 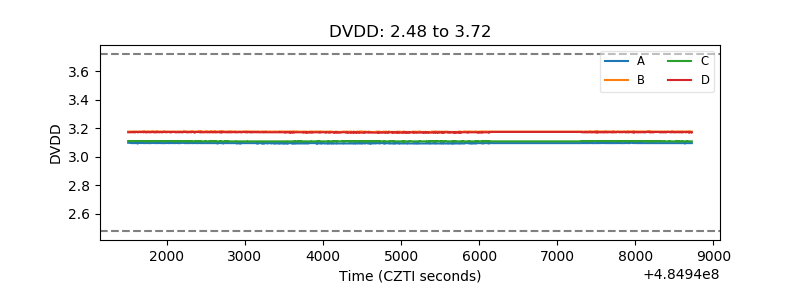 |
| Temperature 1 | 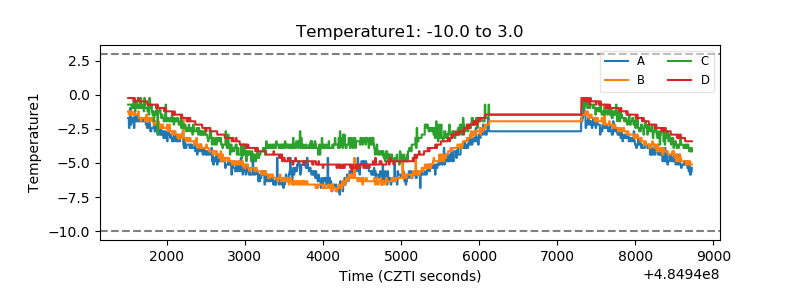 |
| Veto HV Monitor | 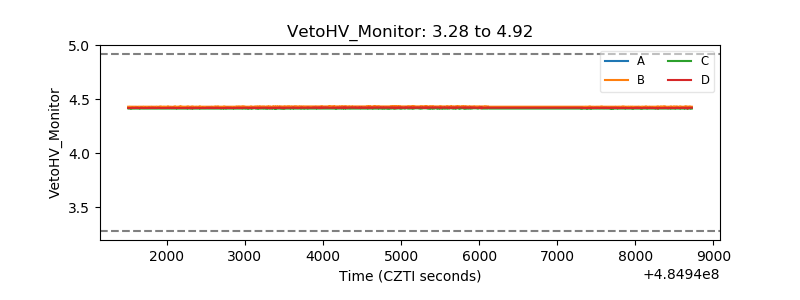 |
| Veto LLD | 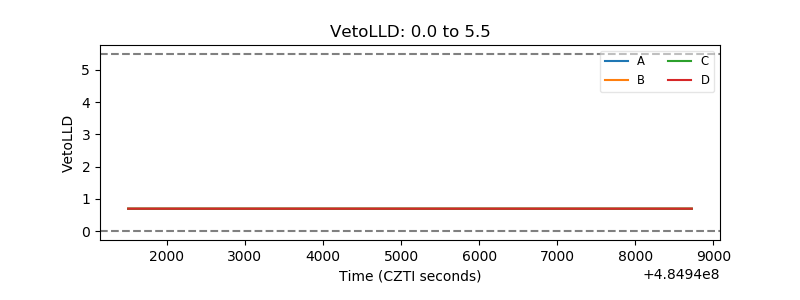 |
| Alpha Counter | 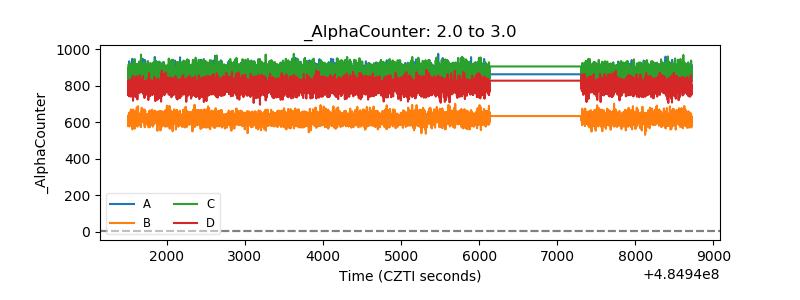 |
| _CPM_Rate | 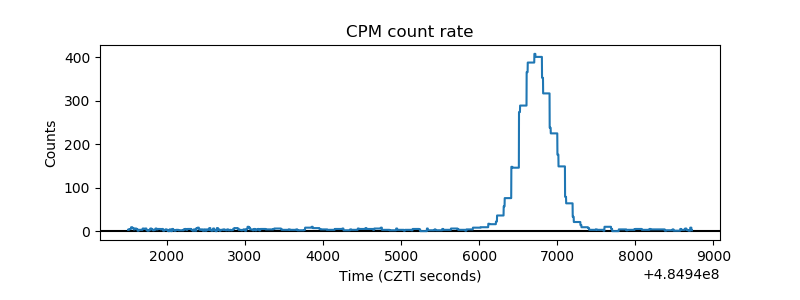 |
| CZT Counter | 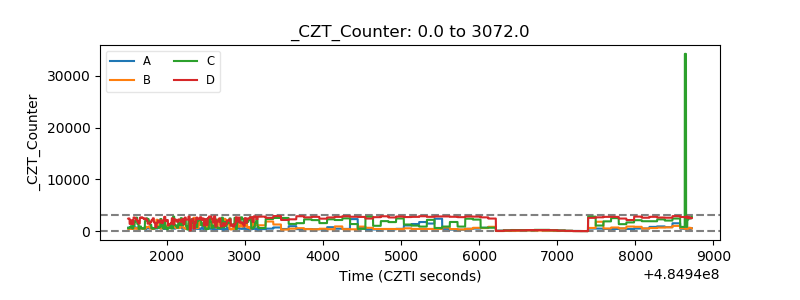 |
| +2.5 Volts monitor | 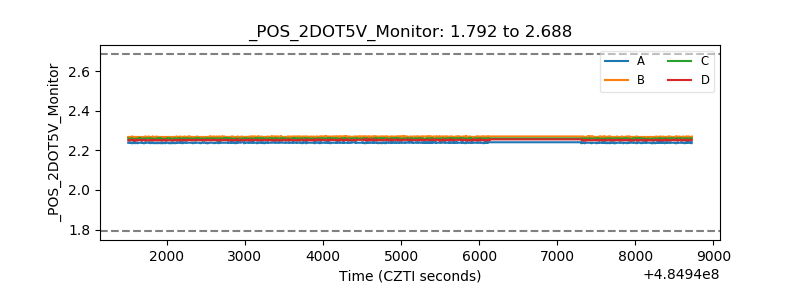 |
| +5 Volts monitor | 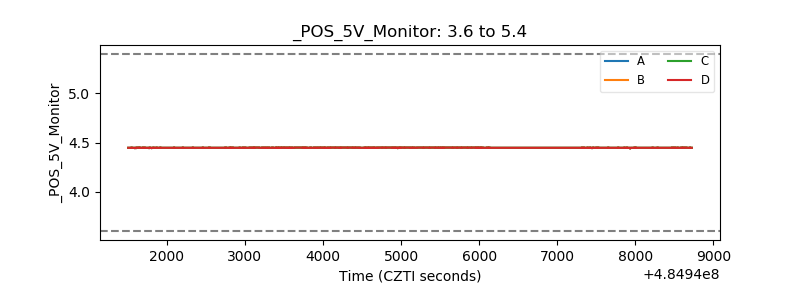 |
| _ROLL_ROT | 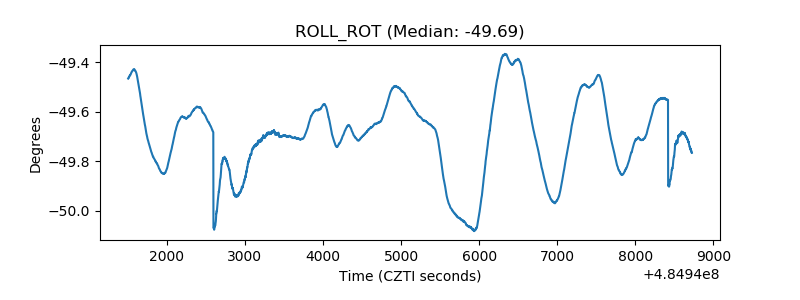 |
| _Roll_DEC | 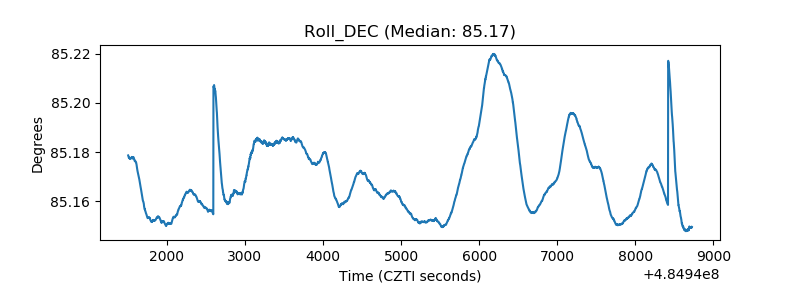 |
| _Roll_RA | 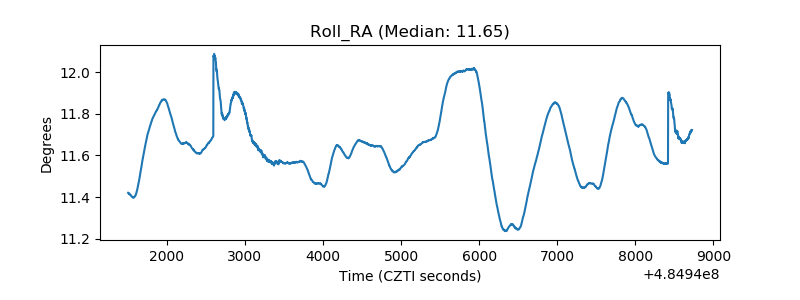 |
| Veto Counter | 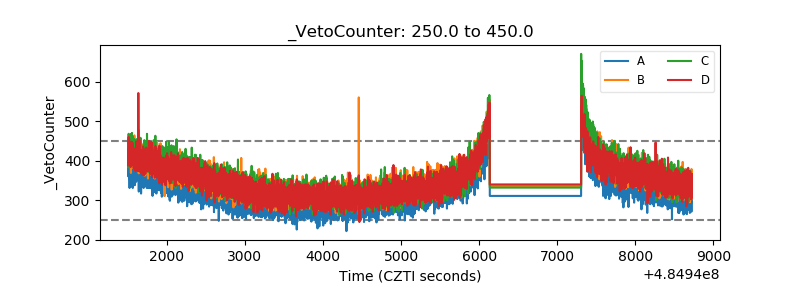 |