| Param | Original file | Final file |
|---|---|---|
| Filename | modeM0/AS1C09_011T07_9000006470_52078cztM0_level2.fits | modeM0/AS1C09_011T07_9000006470_52078cztM0_level2_quad_clean.evt |
| Size (bytes) | 1,095,857,280 | 67,985,280 |
| Size | 1.0 GB | 64.8 MB |
| Events in quadrant A | 3,420,503 | 630,904 |
| Events in quadrant B | 9,374,177 | 503,014 |
| Events in quadrant C | 9,478,474 | 456,414 |
| Events in quadrant D | 17,785,134 | 9,633 |
| Mode SS | |||
|---|---|---|---|
| Quadrant | BADHDUFLAG | Total packets | Discarded packets |
| A | 0 | 132 | 0 |
| B | 0 | 132 | 0 |
| C | 0 | 132 | 0 |
| D | 0 | 132 | 0 |
| Mode M9 | |||
|---|---|---|---|
| Quadrant | BADHDUFLAG | Total packets | Discarded packets |
| A | 0 | 9 | 0 |
| B | 0 | 9 | 0 |
| C | 0 | 9 | 0 |
| D | 0 | 9 | 0 |
| Mode M0 | |||
|---|---|---|---|
| Quadrant | BADHDUFLAG | Total packets | Discarded packets |
| A | 0 | 14852 | 1 |
| B | 0 | 32436 | 1 |
| C | 0 | 32841 | 1 |
| D | 0 | 57060 | 5 |
| Quadrant | Total seconds | Saturated seconds | Saturation percentage |
|---|---|---|---|
| A | 6570 | 85 | 1.293760% |
| B | 6571 | 2023 | 30.786790% |
| C | 6571 | 2158 | 32.841272% |
| D | 6570 | 6497 | 98.888889% |
Noise dominated data is calculated using 1-second bins in cleaned event files. If a bin has >2000 counts, and if more than 50% of those come from <1% of pixels, then it is considered to be noise-dominated and hence unusable.
| Quadrant | # 1 sec bins | Bins with >0 counts | Bins with >2000 counts | High rate bins dominated by noise | Noise dominated (total time) | Noise dominated (detector-on time) | Marked lightcurve |
|---|---|---|---|---|---|---|---|
| A | 7490 | 6571 | 52 | 52 | 0.69% | 0.79% | 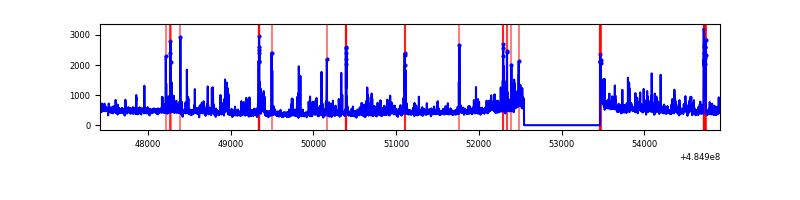 |
| B | 7491 | 6571 | 1709 | 1709 | 22.81% | 26.01% | 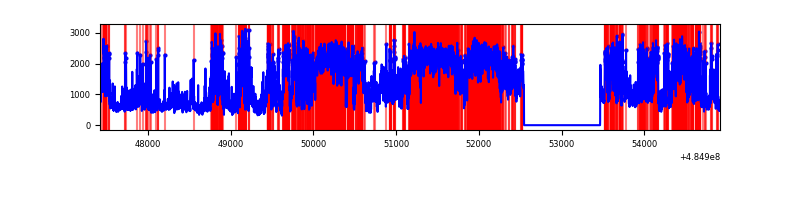 |
| C | 7491 | 6572 | 1998 | 1998 | 26.67% | 30.40% | 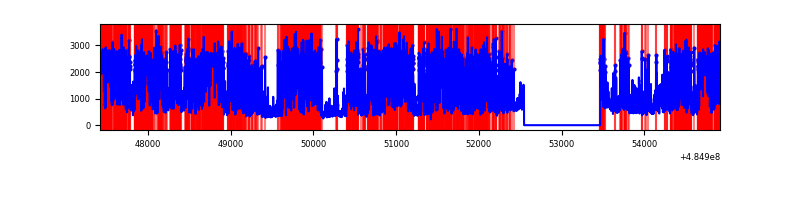 |
| D | 7489 | 6569 | 6456 | 6456 | 86.21% | 98.28% | 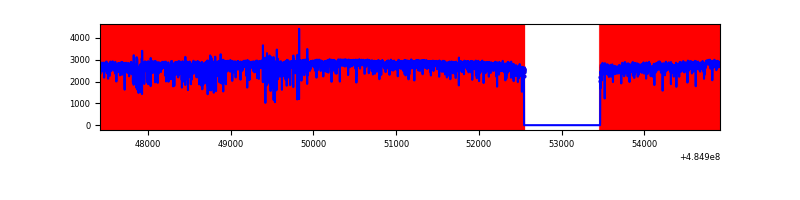 |
Top three noisy pixels from each quadrant. If the there are fewer than three noisy pixels in the level2.evt file, extra rows are filled as -1
| Pixel properties | Quadrant properties | ||||||
|---|---|---|---|---|---|---|---|
| Quadrant | DetID | PixID | Counts | Sigma | Mean | Median | Sigma |
| A | 6 | 196 | 187928 | 1088.65 | 683 | 666 | 172.0 |
| A | 4 | 3 | 90507 | 522.29 | 683 | 666 | 172.0 |
| A | 8 | 246 | 69026 | 397.41 | 683 | 666 | 172.0 |
| B | 10 | 254 | 4454166 | 33473.81 | 632 | 610 | 133.0 |
| B | 10 | 128 | 1096806 | 8239.23 | 632 | 610 | 133.0 |
| B | 5 | 172 | 217678 | 1631.53 | 632 | 610 | 133.0 |
| C | 15 | 224 | 5056744 | 30805.97 | 586 | 581 | 164.1 |
| C | 15 | 193 | 514200 | 3129.36 | 586 | 581 | 164.1 |
| C | 2 | 239 | 467010 | 2841.84 | 586 | 581 | 164.1 |
| D | 15 | 94 | 14629185 | 290503.81 | 164 | 156 | 50.4 |
| D | 6 | 42 | 1449849 | 28788.06 | 164 | 156 | 50.4 |
| D | 3 | 12 | 359007 | 7126.08 | 164 | 156 | 50.4 |
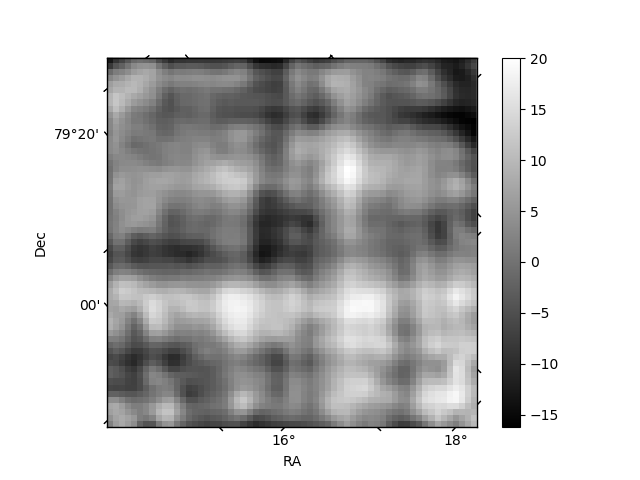
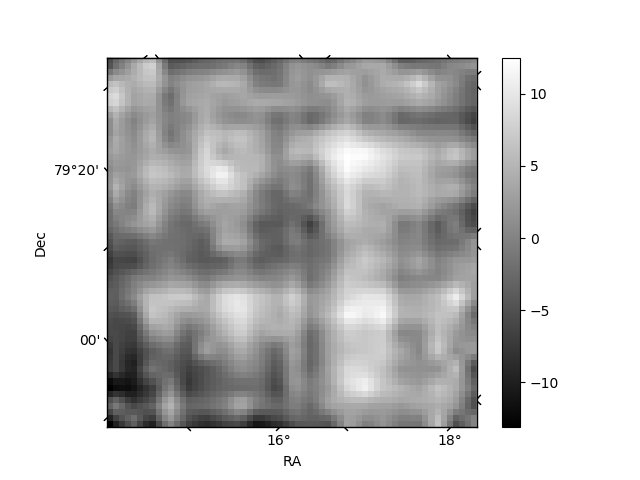
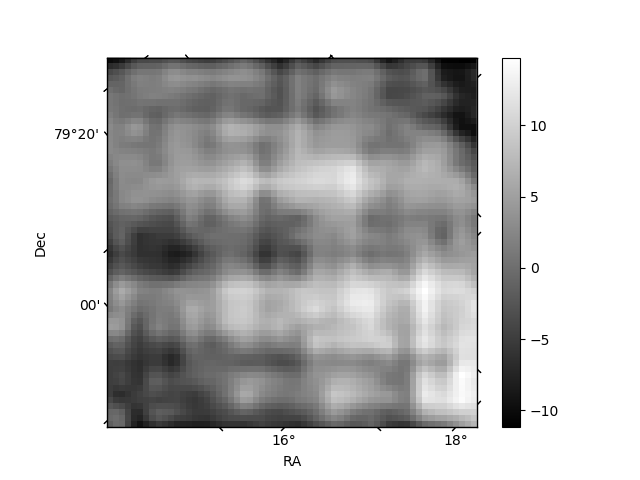
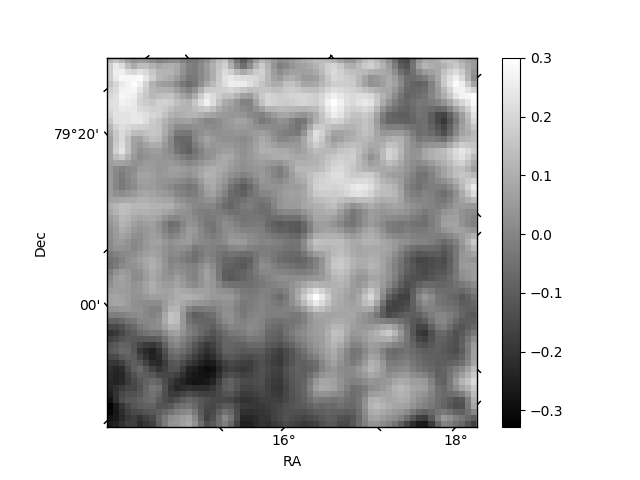
Histogram calculated using DETX and DETY for each event in the final _common_clean file
| Quadrant A | 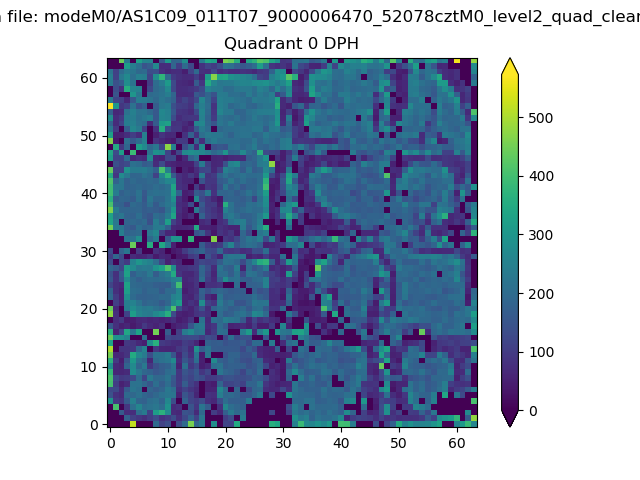 |
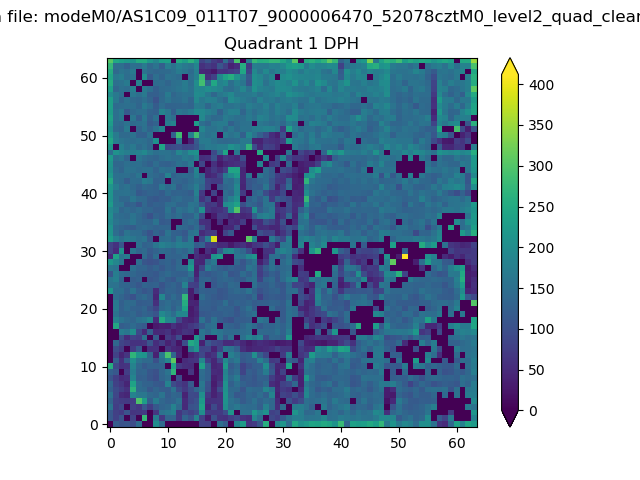 |
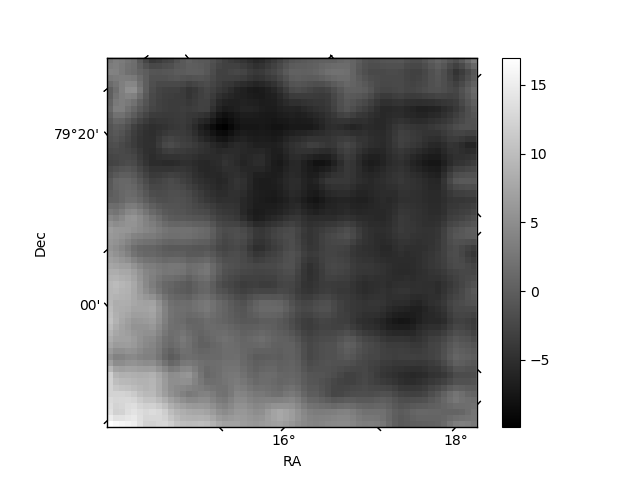
Quadrant B |
|---|---|---|---|
| Quadrant D | 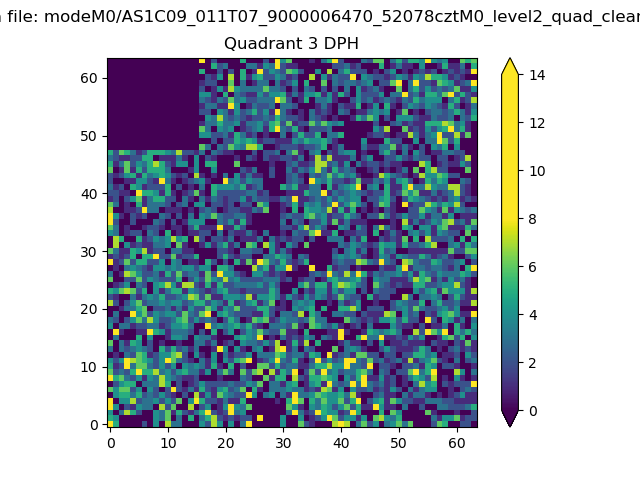 |
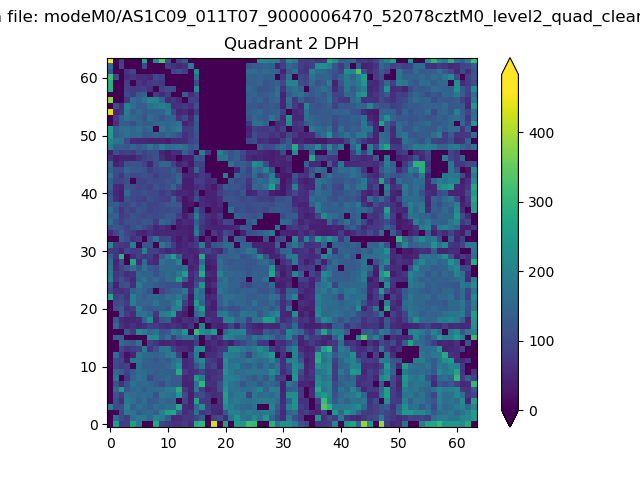 |
Quadrant C |
| Plot type | Count rate plots | Images |
|---|---|---|
| Comparison with Poisson distribution Blue bars denote a histogram of data divided into 1 sec bins. Red curve is a Poisson curve with rate = median count rate of data. |
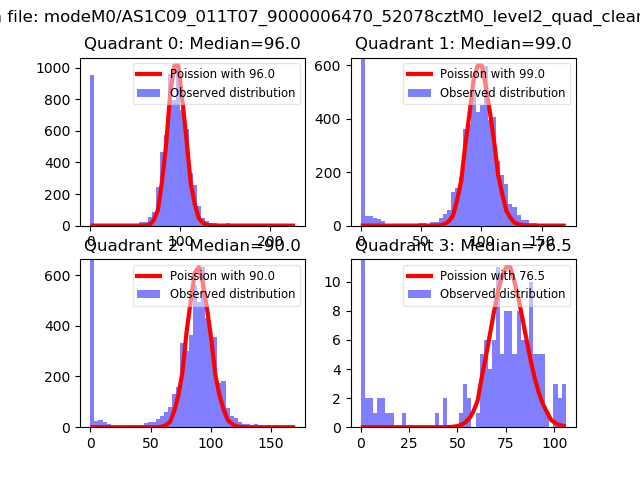 |
 |
| Quadrant-wise count rates Data is divided into 100 sec bins |
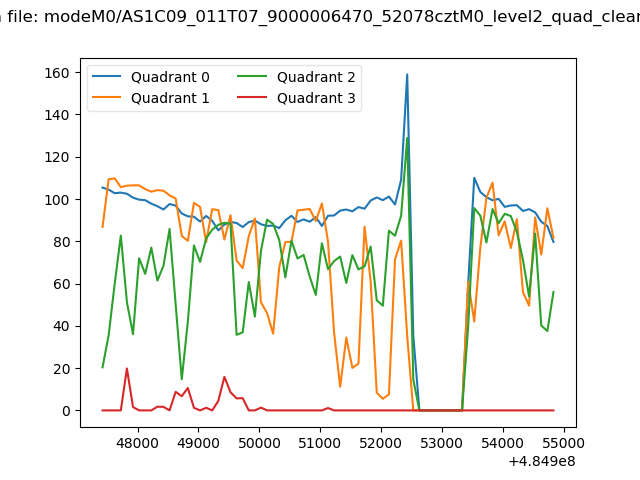 |
|
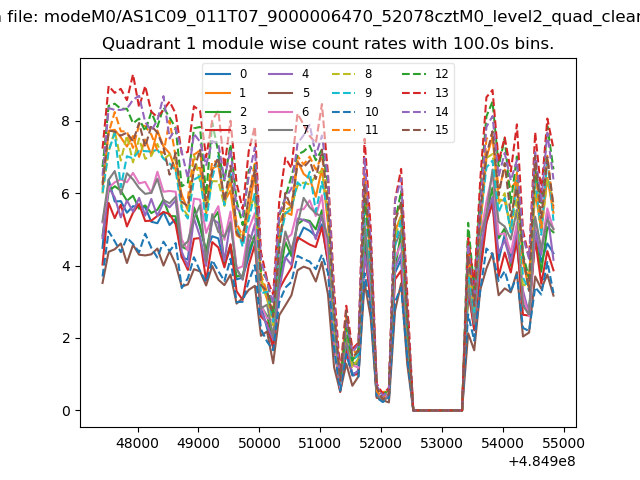
| Module-wise count rates for Quadrant A Data is divided into 100 sec bins |
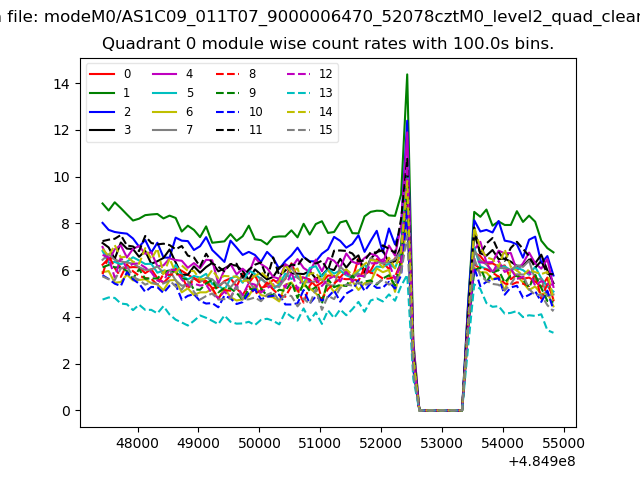 |
 |
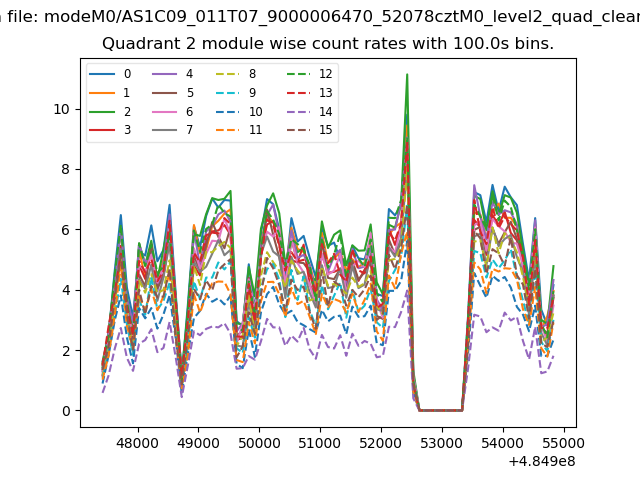
| Module-wise count rates for Quadrant B Data is divided into 100 sec bins |
 |
 |
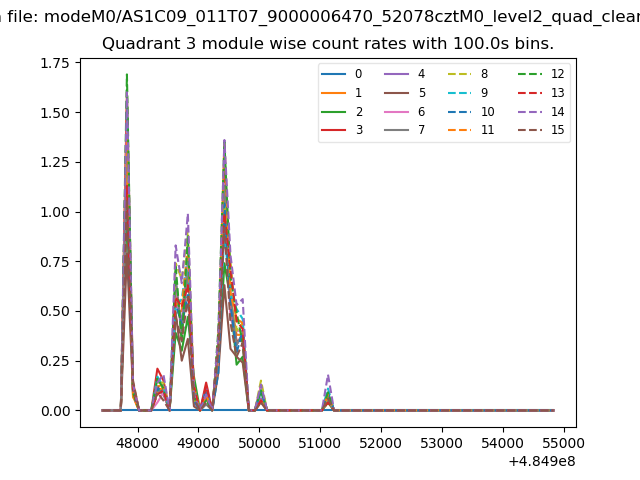
| Module-wise count rates for Quadrant C Data is divided into 100 sec bins |
 |
 |
| Module-wise count rates for Quadrant D Data is divided into 100 sec bins |
 |
 |
| Parameter | Plot |
|---|---|
| CZT HV Monitor | 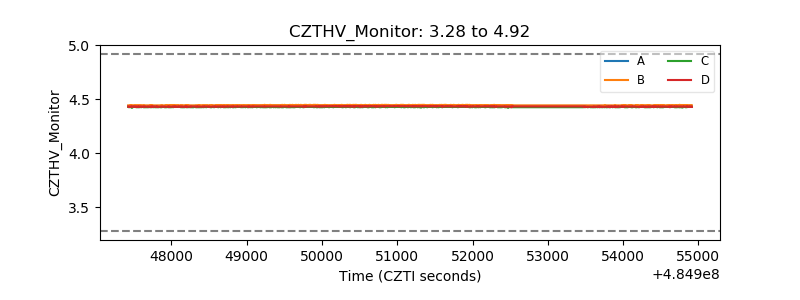 |
| D_VDD | 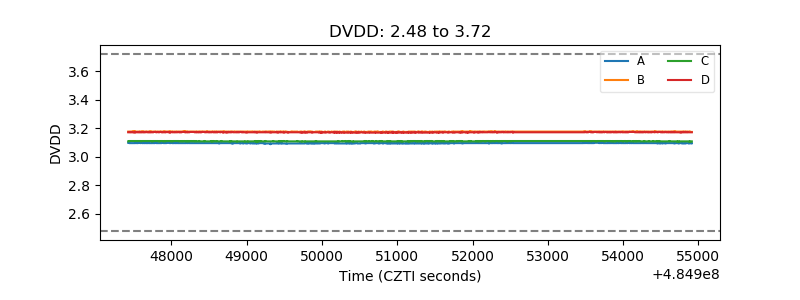 |
| Temperature 1 | 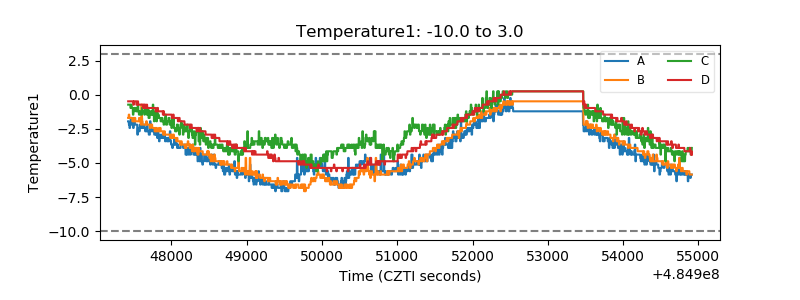 |
| Veto HV Monitor | 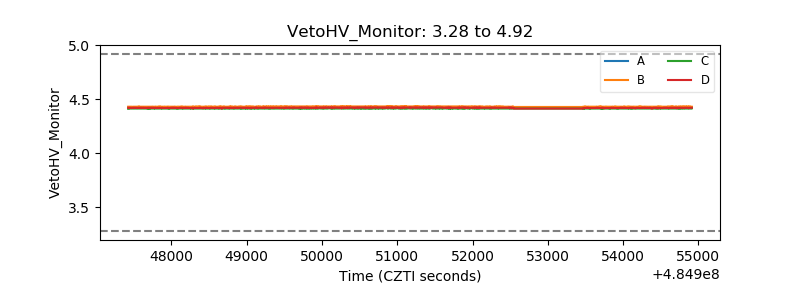 |
| Veto LLD | 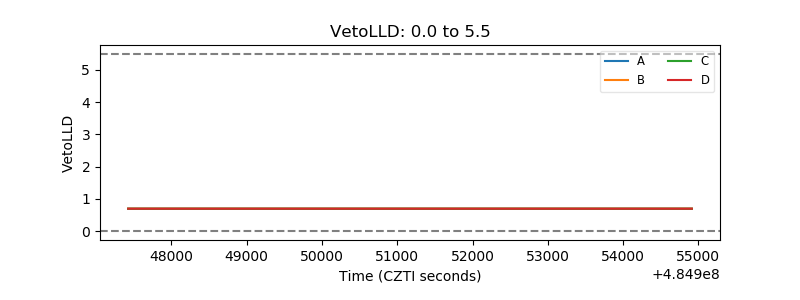 |
| Alpha Counter | 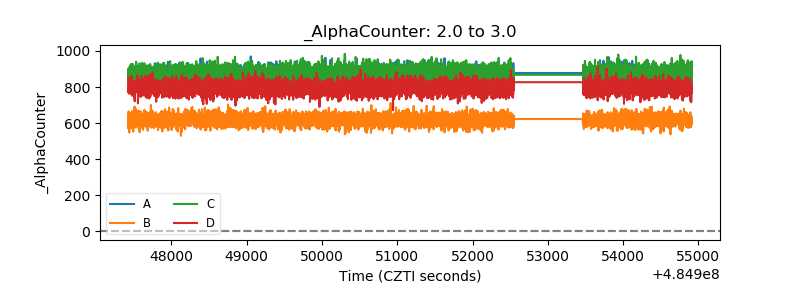 |
| _CPM_Rate | 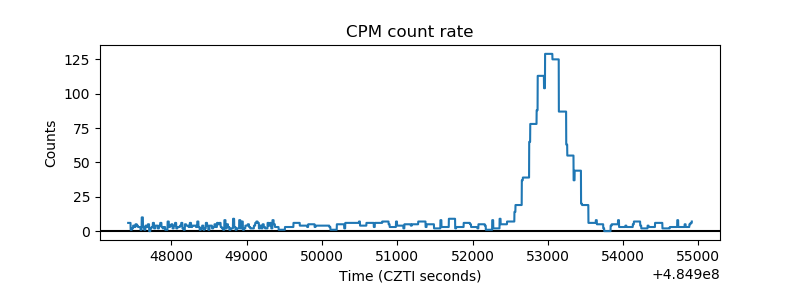 |
| CZT Counter | 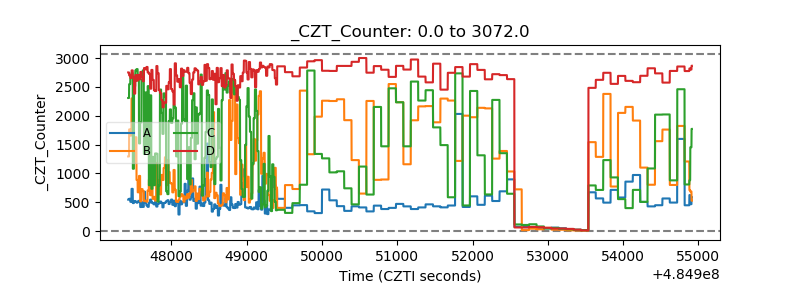 |
| +2.5 Volts monitor | 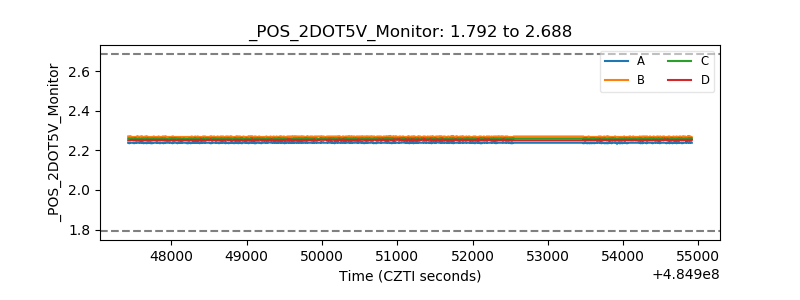 |
| +5 Volts monitor | 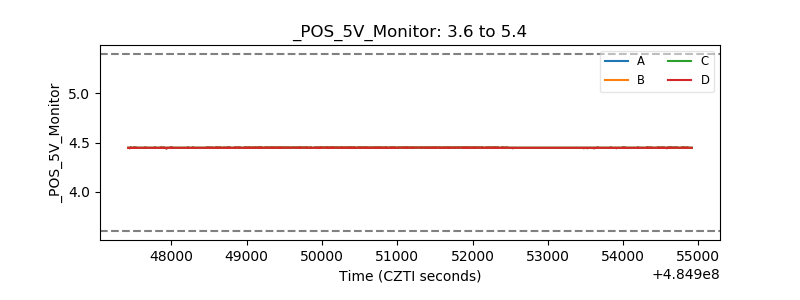 |
| _ROLL_ROT | 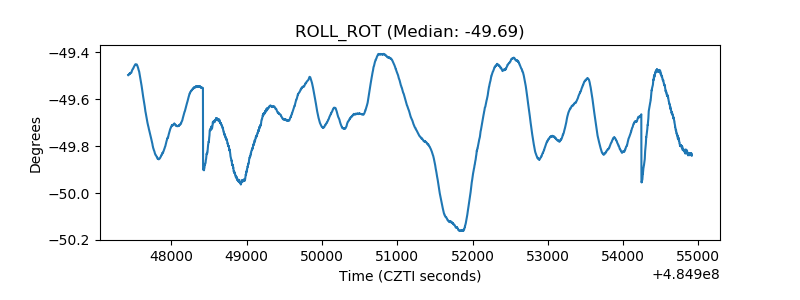 |
| _Roll_DEC | 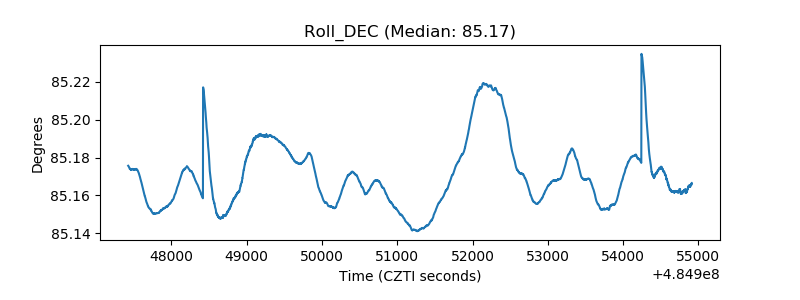 |
| _Roll_RA | 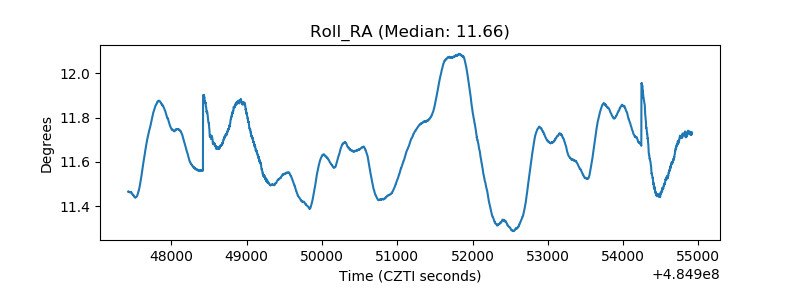 |
| Veto Counter | 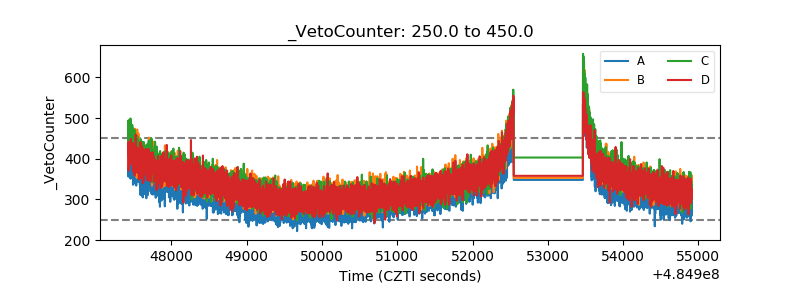 |