| Param | Original file | Final file |
|---|---|---|
| Filename | modeM0/AS1C09_011T07_9000006470_52079cztM0_level2.fits | modeM0/AS1C09_011T07_9000006470_52079cztM0_level2_quad_clean.evt |
| Size (bytes) | 1,142,614,080 | 72,132,480 |
| Size | 1.1 GB | 68.8 MB |
| Events in quadrant A | 4,014,966 | 643,689 |
| Events in quadrant B | 9,192,087 | 586,076 |
| Events in quadrant C | 9,849,386 | 466,466 |
| Events in quadrant D | 18,705,474 | 4,825 |
| Mode SS | |||
|---|---|---|---|
| Quadrant | BADHDUFLAG | Total packets | Discarded packets |
| A | 0 | 140 | 0 |
| B | 0 | 140 | 0 |
| C | 0 | 140 | 0 |
| D | 0 | 140 | 0 |
| Mode M9 | |||
|---|---|---|---|
| Quadrant | BADHDUFLAG | Total packets | Discarded packets |
| A | 0 | 6 | 0 |
| B | 0 | 6 | 0 |
| C | 0 | 6 | 0 |
| D | 0 | 6 | 0 |
| Mode M0 | |||
|---|---|---|---|
| Quadrant | BADHDUFLAG | Total packets | Discarded packets |
| A | 0 | 16912 | 1 |
| B | 0 | 32175 | 1 |
| C | 0 | 34061 | 1 |
| D | 0 | 60071 | 1 |
| Quadrant | Total seconds | Saturated seconds | Saturation percentage |
|---|---|---|---|
| A | 6927 | 141 | 2.035513% |
| B | 6927 | 1481 | 21.380107% |
| C | 6927 | 2212 | 31.933016% |
| D | 6926 | 6886 | 99.422466% |
Noise dominated data is calculated using 1-second bins in cleaned event files. If a bin has >2000 counts, and if more than 50% of those come from <1% of pixels, then it is considered to be noise-dominated and hence unusable.
| Quadrant | # 1 sec bins | Bins with >0 counts | Bins with >2000 counts | High rate bins dominated by noise | Noise dominated (total time) | Noise dominated (detector-on time) | Marked lightcurve |
|---|---|---|---|---|---|---|---|
| A | 7457 | 6928 | 104 | 104 | 1.39% | 1.50% | 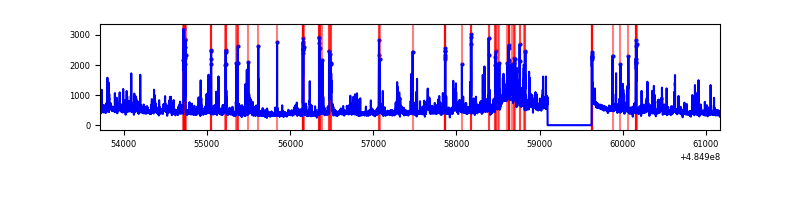 |
| B | 7457 | 6928 | 1305 | 1305 | 17.50% | 18.84% | 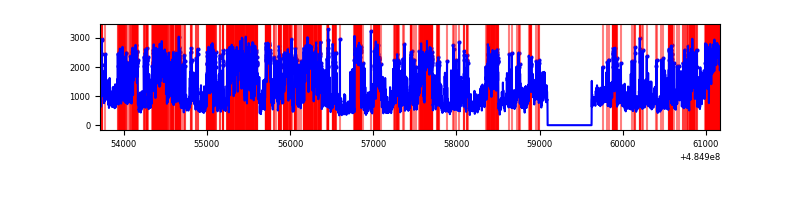 |
| C | 7457 | 6928 | 2026 | 2026 | 27.17% | 29.24% | 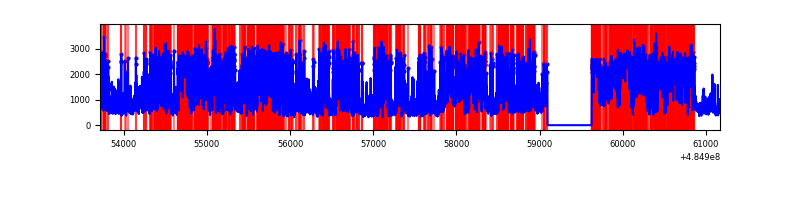 |
| D | 7455 | 6925 | 6815 | 6815 | 91.42% | 98.41% | 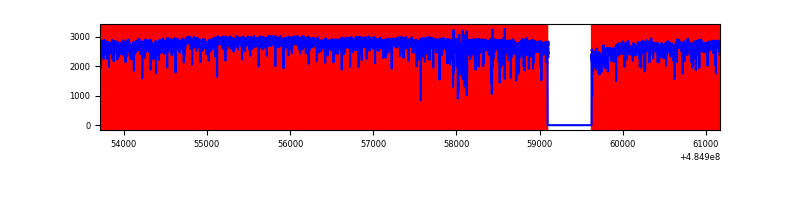 |
Top three noisy pixels from each quadrant. If the there are fewer than three noisy pixels in the level2.evt file, extra rows are filled as -1
| Pixel properties | Quadrant properties | ||||||
|---|---|---|---|---|---|---|---|
| Quadrant | DetID | PixID | Counts | Sigma | Mean | Median | Sigma |
| A | 6 | 196 | 361478 | 2003.99 | 707 | 688 | 180.0 |
| A | 8 | 43 | 183659 | 1016.3 | 707 | 688 | 180.0 |
| A | 4 | 3 | 101797 | 561.61 | 707 | 688 | 180.0 |
| B | 10 | 254 | 3318053 | 23322.69 | 672 | 650 | 142.2 |
| B | 10 | 128 | 1305904 | 9176.46 | 672 | 650 | 142.2 |
| B | 5 | 172 | 582155 | 4088.22 | 672 | 650 | 142.2 |
| C | 15 | 224 | 4267871 | 25020.47 | 610 | 606 | 170.6 |
| C | 15 | 193 | 1379094 | 8082.56 | 610 | 606 | 170.6 |
| C | 12 | 252 | 391749 | 2293.41 | 610 | 606 | 170.6 |
| D | 15 | 94 | 17453585 | 521074.23 | 109 | 104 | 33.5 |
| D | 6 | 42 | 415799 | 12410.59 | 109 | 104 | 33.5 |
| D | 11 | 176 | 112710 | 3361.86 | 109 | 104 | 33.5 |
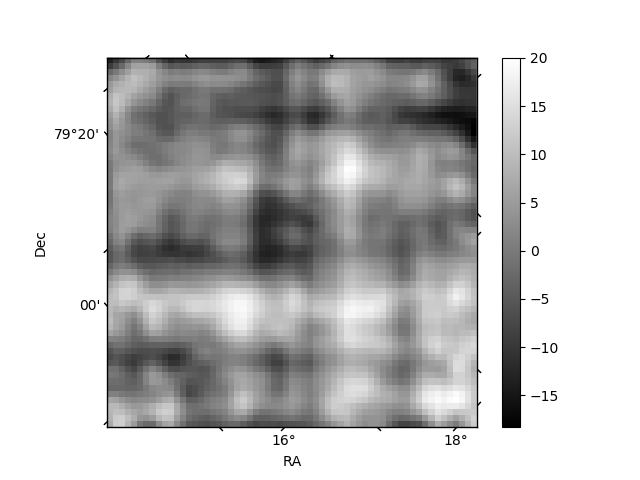
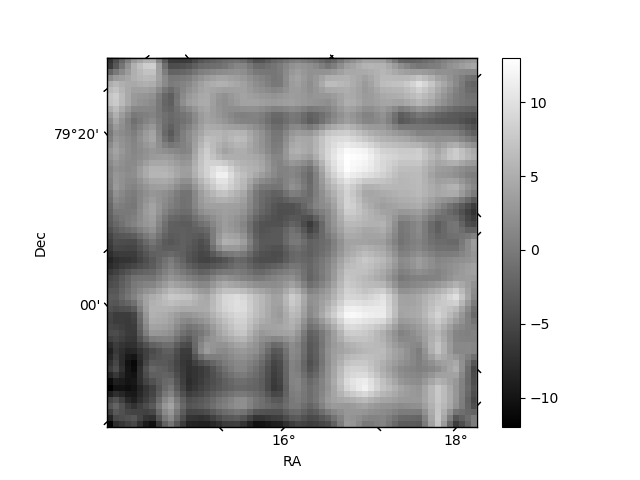
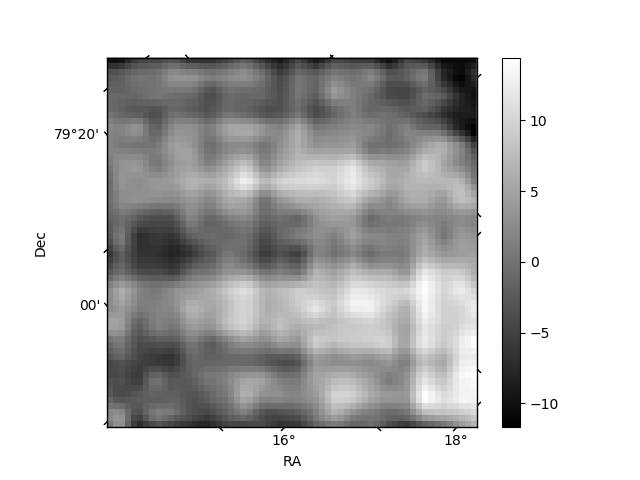
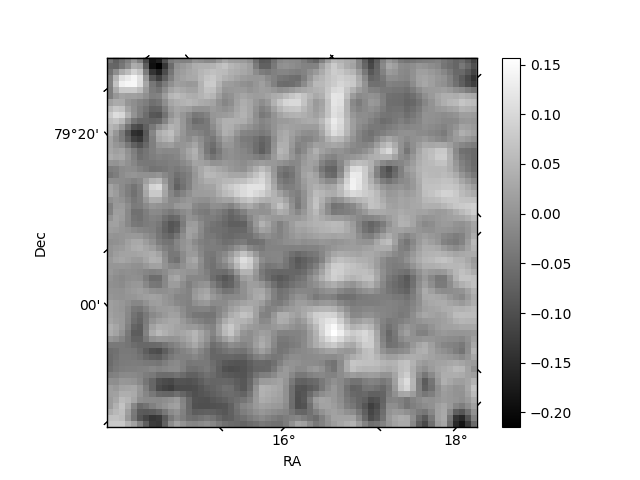
Histogram calculated using DETX and DETY for each event in the final _common_clean file
| Quadrant A | 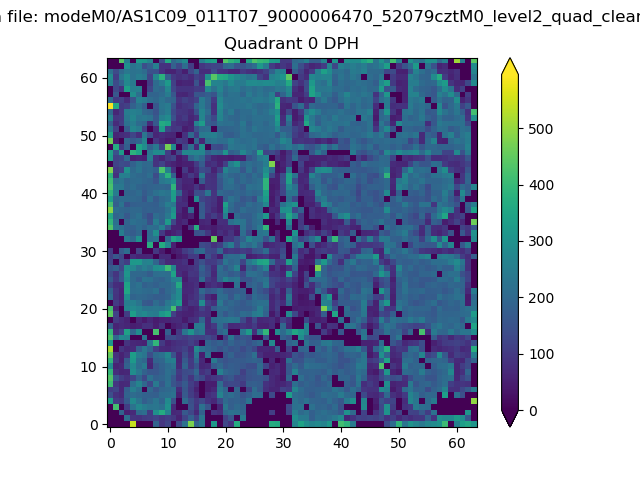 |
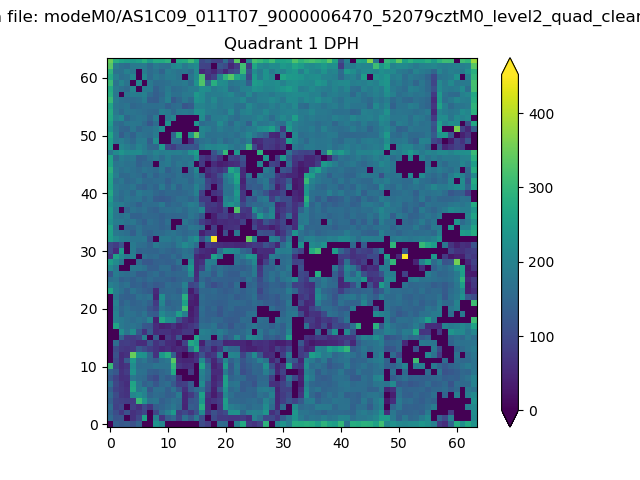 |
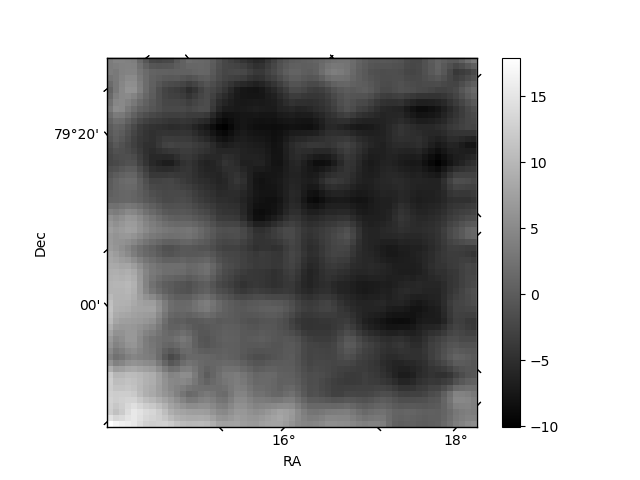
Quadrant B |
|---|---|---|---|
| Quadrant D | 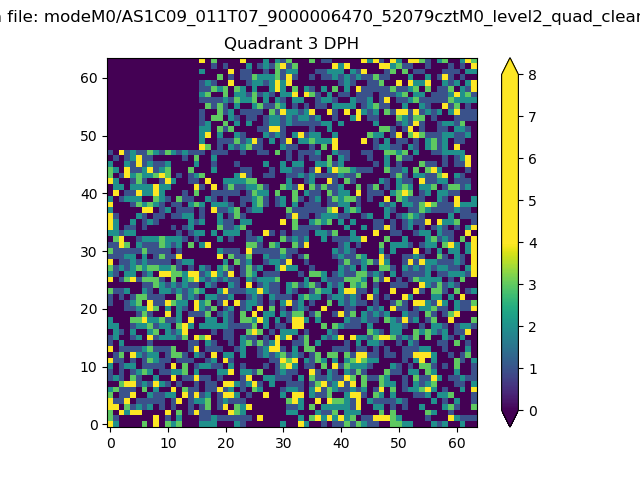 |
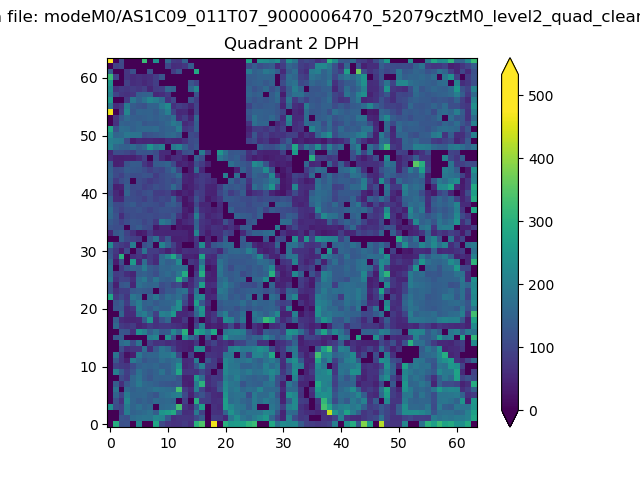 |
Quadrant C |
| Plot type | Count rate plots | Images |
|---|---|---|
| Comparison with Poisson distribution Blue bars denote a histogram of data divided into 1 sec bins. Red curve is a Poisson curve with rate = median count rate of data. |
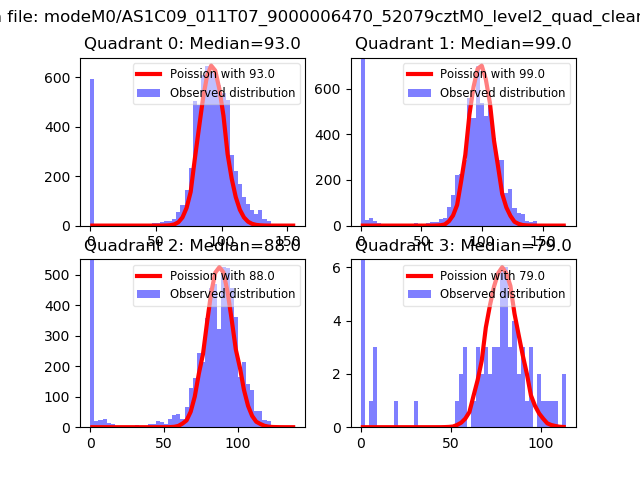 |
 |
| Quadrant-wise count rates Data is divided into 100 sec bins |
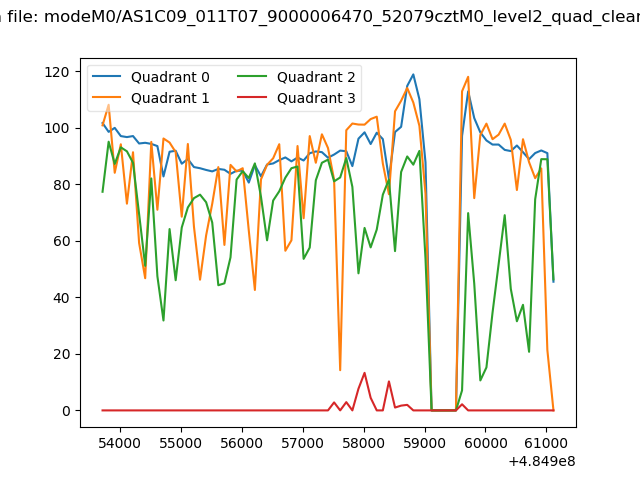 |
|
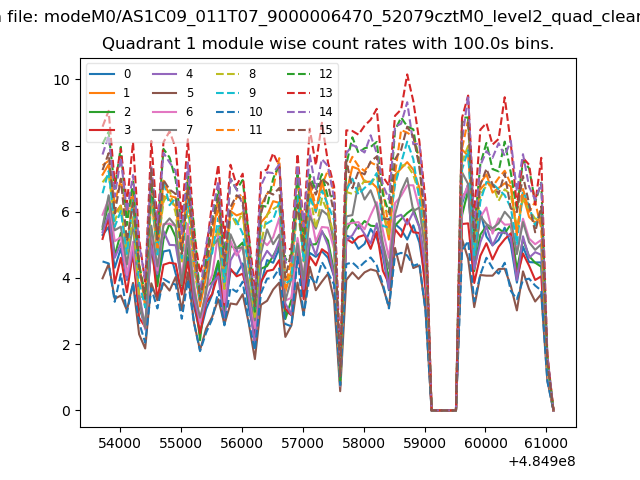
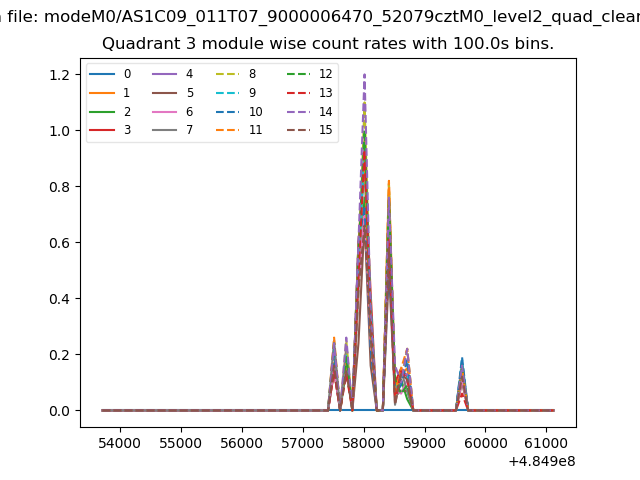
| Module-wise count rates for Quadrant A Data is divided into 100 sec bins |
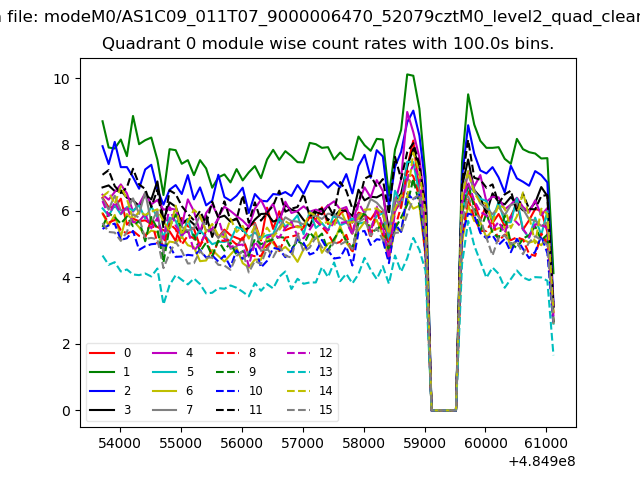 |
 |
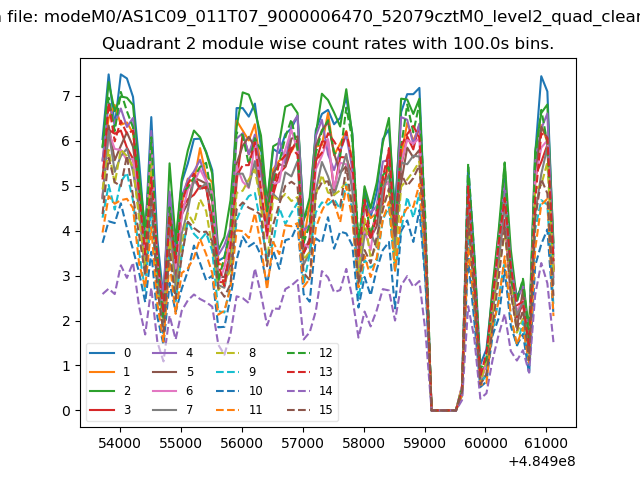
| Module-wise count rates for Quadrant B Data is divided into 100 sec bins |
 |
 |
| Module-wise count rates for Quadrant C Data is divided into 100 sec bins |
 |
 |
| Module-wise count rates for Quadrant D Data is divided into 100 sec bins |
 |
 |
| Parameter | Plot |
|---|---|
| CZT HV Monitor |  |
| D_VDD | 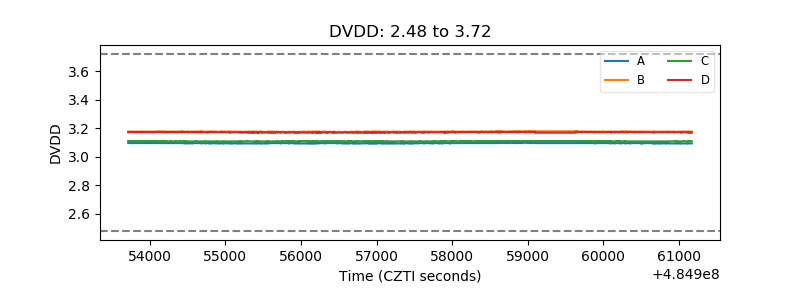 |
| Temperature 1 | 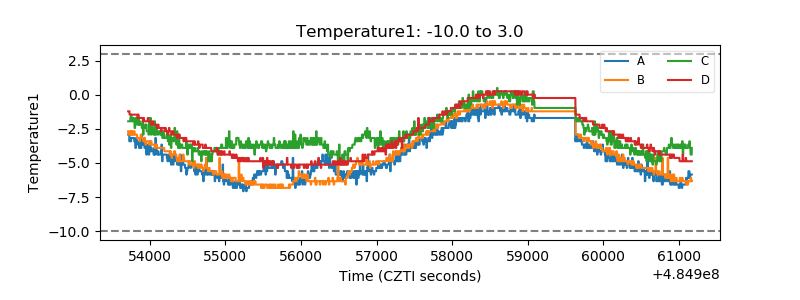 |
| Veto HV Monitor | 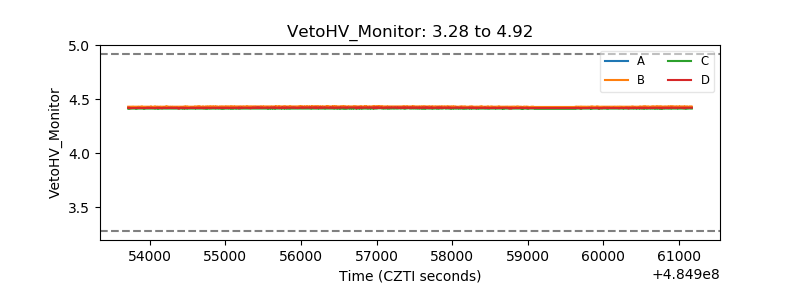 |
| Veto LLD | 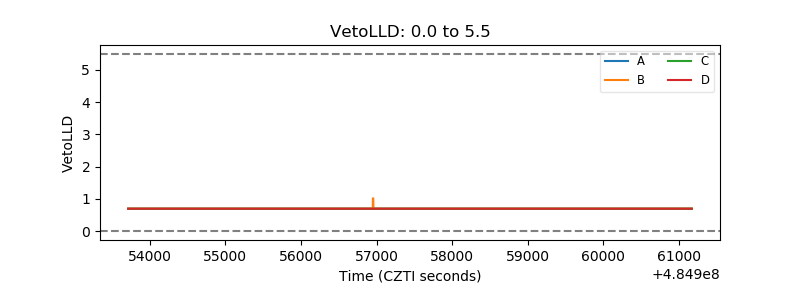 |
| Alpha Counter | 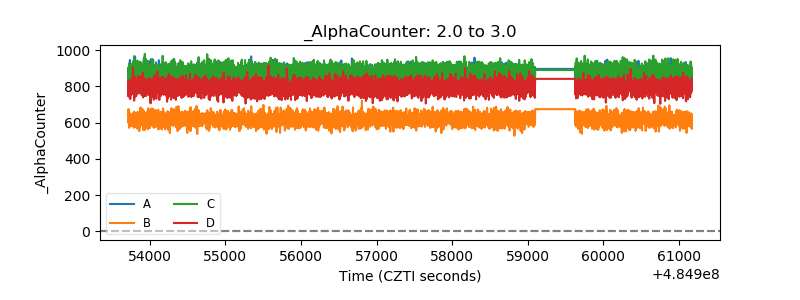 |
| _CPM_Rate | 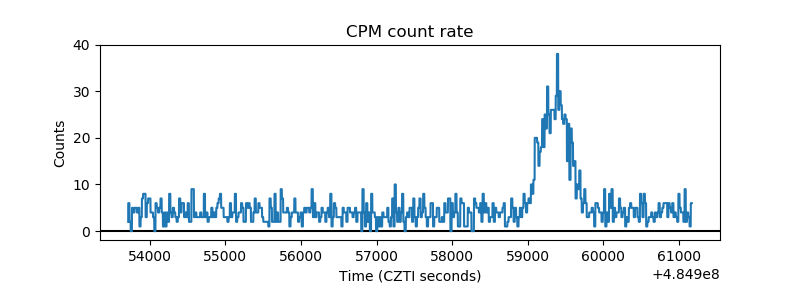 |
| CZT Counter | 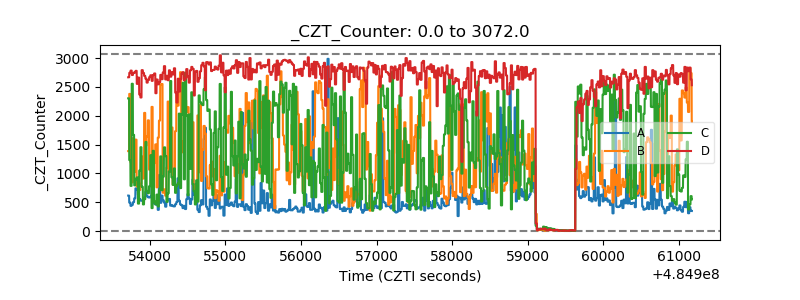 |
| +2.5 Volts monitor | 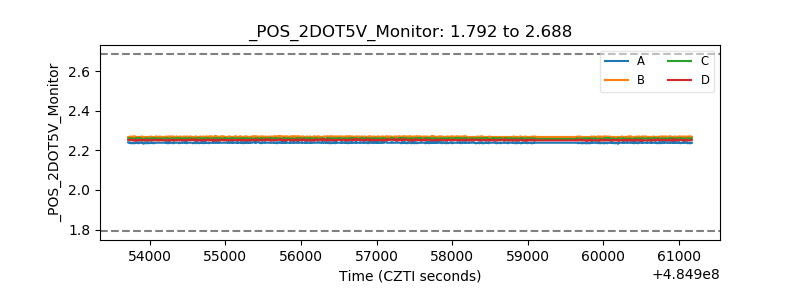 |
| +5 Volts monitor | 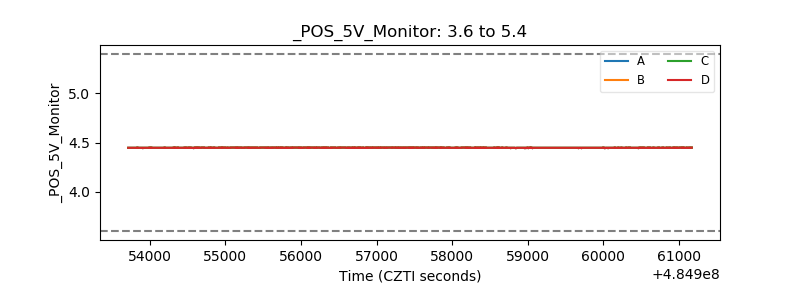 |
| _ROLL_ROT | 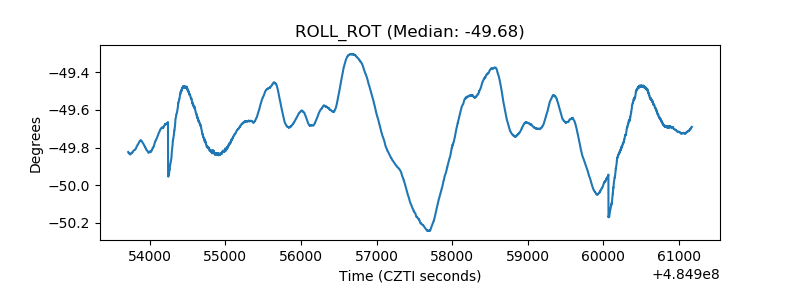 |
| _Roll_DEC | 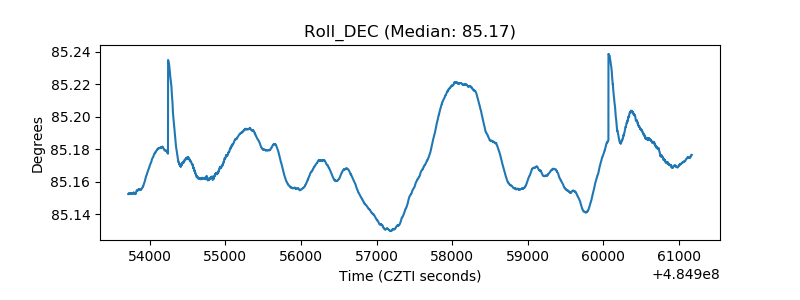 |
| _Roll_RA | 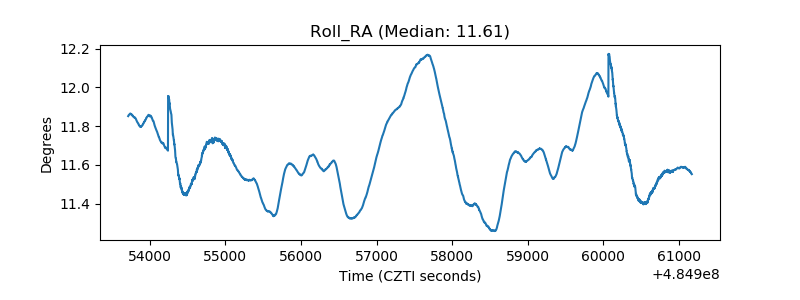 |
| Veto Counter | 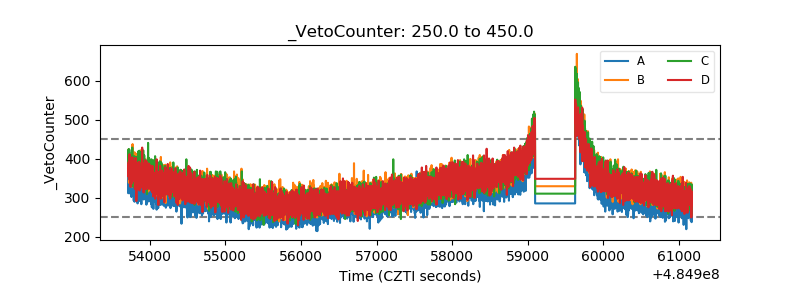 |