| Param | Original file | Final file |
|---|---|---|
| Filename | modeM0/AS1C09_011T07_9000006470_52080cztM0_level2.fits | modeM0/AS1C09_011T07_9000006470_52080cztM0_level2_quad_clean.evt |
| Size (bytes) | 1,227,081,600 | 78,168,960 |
| Size | 1.1 GB | 74.5 MB |
| Events in quadrant A | 4,111,433 | 694,731 |
| Events in quadrant B | 9,323,884 | 643,154 |
| Events in quadrant C | 11,062,764 | 497,563 |
| Events in quadrant D | 20,340,771 | 3,645 |
| Mode SS | |||
|---|---|---|---|
| Quadrant | BADHDUFLAG | Total packets | Discarded packets |
| A | 0 | 152 | 0 |
| B | 0 | 152 | 0 |
| C | 0 | 152 | 0 |
| D | 0 | 152 | 0 |
| Mode M0 | |||
|---|---|---|---|
| Quadrant | BADHDUFLAG | Total packets | Discarded packets |
| A | 0 | 17763 | 0 |
| B | 0 | 33107 | 0 |
| C | 0 | 38135 | 0 |
| D | 0 | 65657 | 0 |
| Quadrant | Total seconds | Saturated seconds | Saturation percentage |
|---|---|---|---|
| A | 7574 | 97 | 1.280697% |
| B | 7573 | 1429 | 18.869669% |
| C | 7573 | 2544 | 33.593028% |
| D | 7573 | 7541 | 99.577446% |
Noise dominated data is calculated using 1-second bins in cleaned event files. If a bin has >2000 counts, and if more than 50% of those come from <1% of pixels, then it is considered to be noise-dominated and hence unusable.
| Quadrant | # 1 sec bins | Bins with >0 counts | Bins with >2000 counts | High rate bins dominated by noise | Noise dominated (total time) | Noise dominated (detector-on time) | Marked lightcurve |
|---|---|---|---|---|---|---|---|
| A | 7574 | 7574 | 82 | 82 | 1.08% | 1.08% | 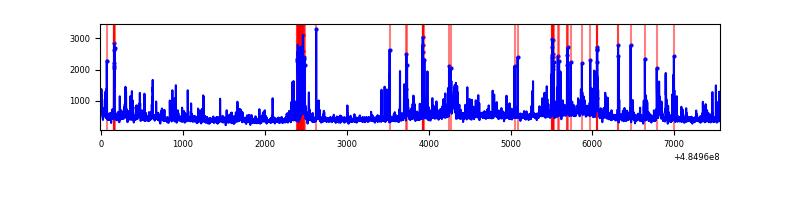 |
| B | 7572 | 7572 | 1104 | 1104 | 14.58% | 14.58% | 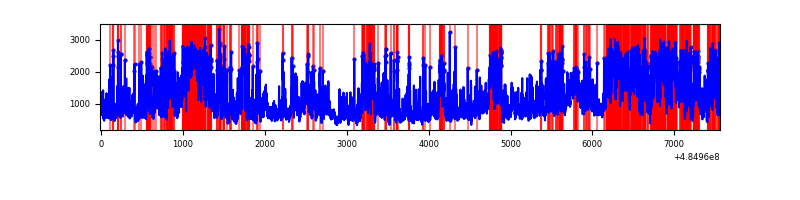 |
| C | 7573 | 7573 | 2414 | 2414 | 31.88% | 31.88% | 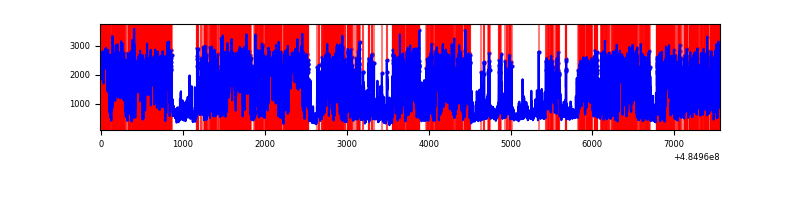 |
| D | 7572 | 7572 | 7490 | 7490 | 98.92% | 98.92% |  |
Top three noisy pixels from each quadrant. If the there are fewer than three noisy pixels in the level2.evt file, extra rows are filled as -1
| Pixel properties | Quadrant properties | ||||||
|---|---|---|---|---|---|---|---|
| Quadrant | DetID | PixID | Counts | Sigma | Mean | Median | Sigma |
| A | 6 | 196 | 281359 | 1427.42 | 776 | 757 | 196.6 |
| A | 4 | 3 | 91665 | 462.45 | 776 | 757 | 196.6 |
| A | 3 | 95 | 91634 | 462.29 | 776 | 757 | 196.6 |
| B | 10 | 128 | 2050175 | 13049.54 | 736 | 711 | 157.1 |
| B | 10 | 254 | 1792205 | 11406.97 | 736 | 711 | 157.1 |
| B | 5 | 172 | 1321996 | 8413.01 | 736 | 711 | 157.1 |
| C | 15 | 224 | 5278209 | 28703.37 | 664 | 659 | 183.9 |
| C | 15 | 193 | 1182090 | 6425.53 | 664 | 659 | 183.9 |
| C | 2 | 239 | 482934 | 2622.98 | 664 | 659 | 183.9 |
| D | 15 | 94 | 19188754 | 541950.09 | 116 | 110 | 35.4 |
| D | 6 | 42 | 171546 | 4841.91 | 116 | 110 | 35.4 |
| D | 3 | 12 | 157002 | 4431.14 | 116 | 110 | 35.4 |
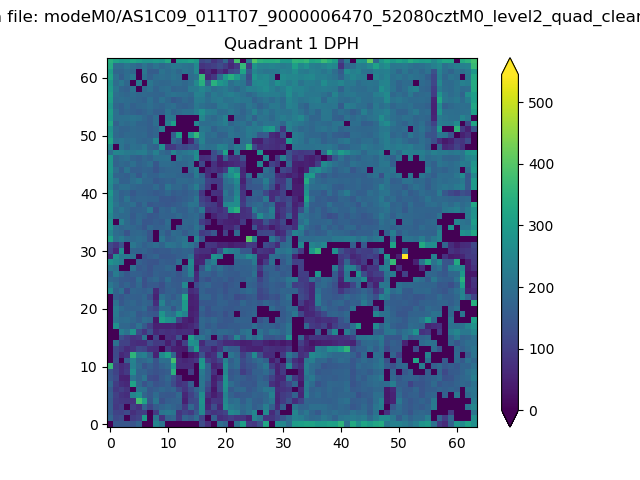
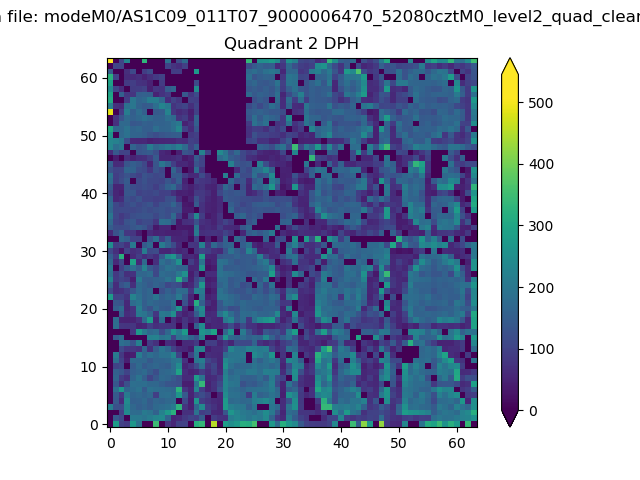
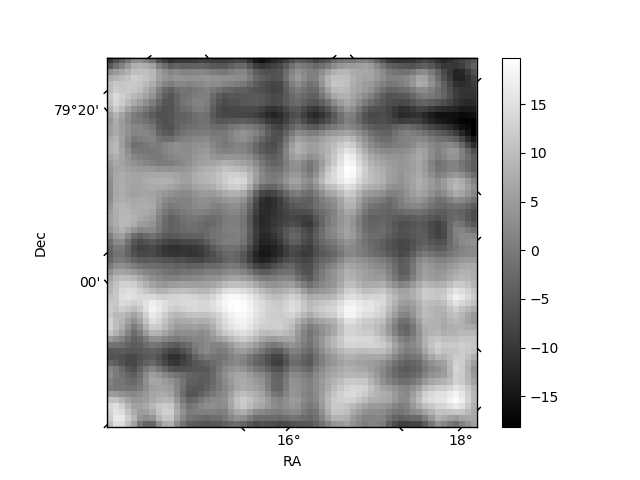
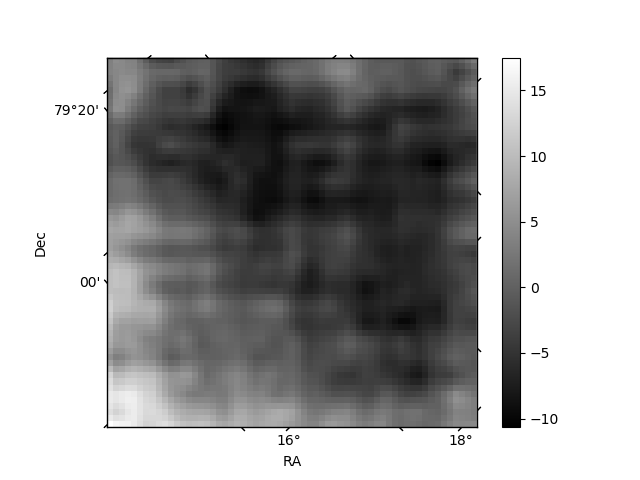
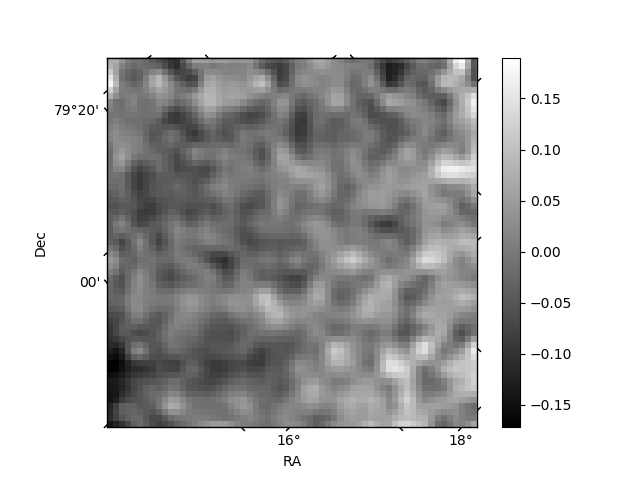
Histogram calculated using DETX and DETY for each event in the final _common_clean file
| Quadrant A | 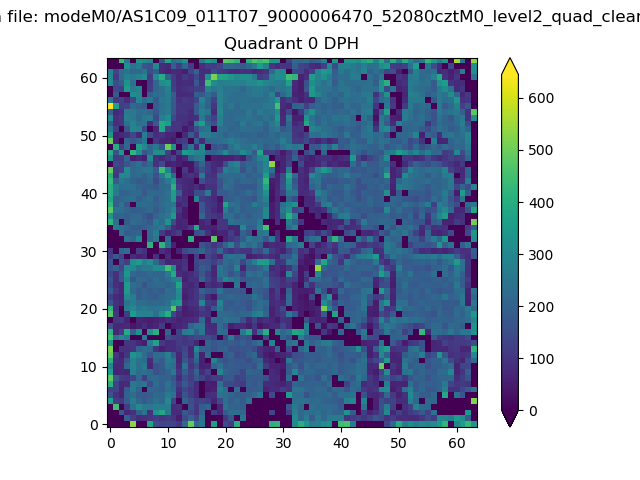 |
 |
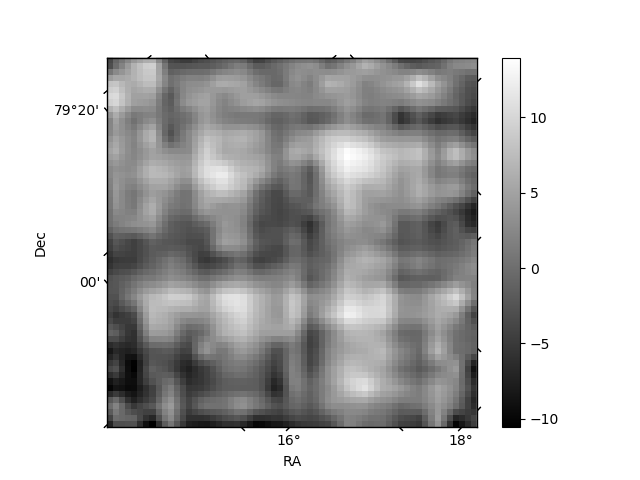
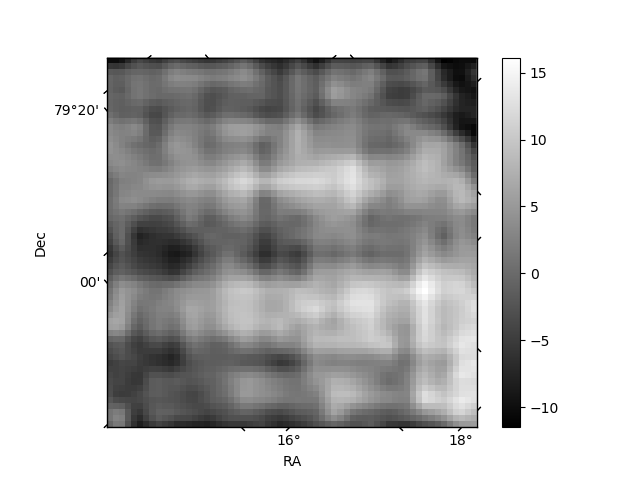
Quadrant B |
|---|---|---|---|
| Quadrant D | 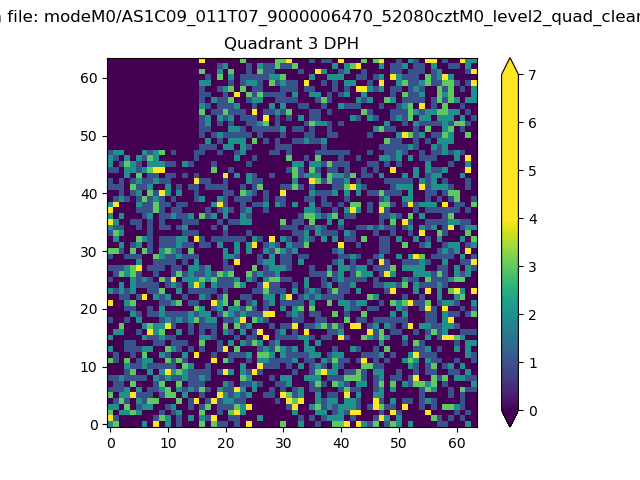 |
 |
Quadrant C |
| Plot type | Count rate plots | Images |
|---|---|---|
| Comparison with Poisson distribution Blue bars denote a histogram of data divided into 1 sec bins. Red curve is a Poisson curve with rate = median count rate of data. |
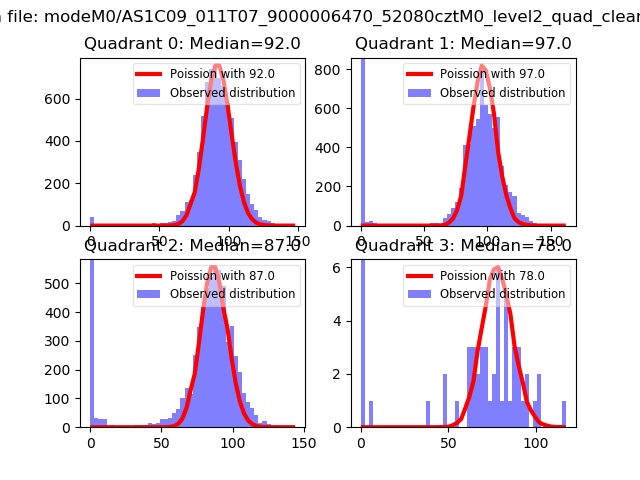 |
 |
| Quadrant-wise count rates Data is divided into 100 sec bins |
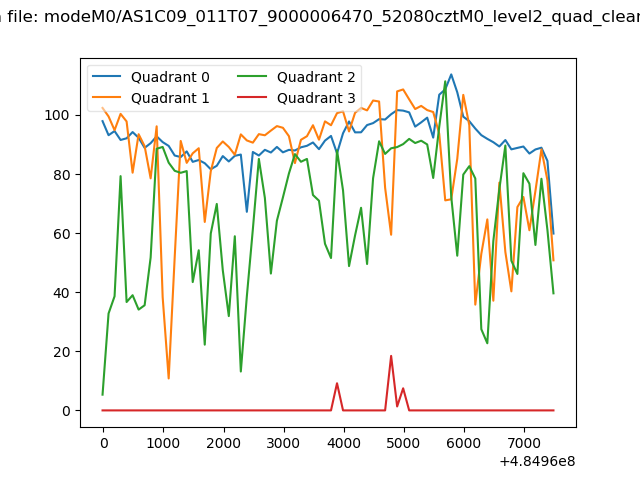 |
|
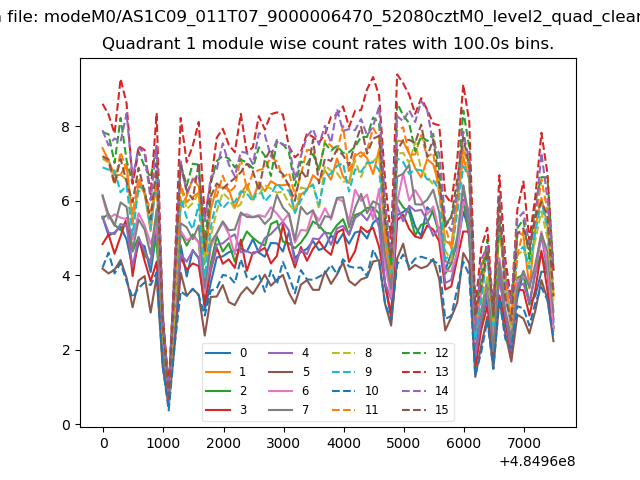
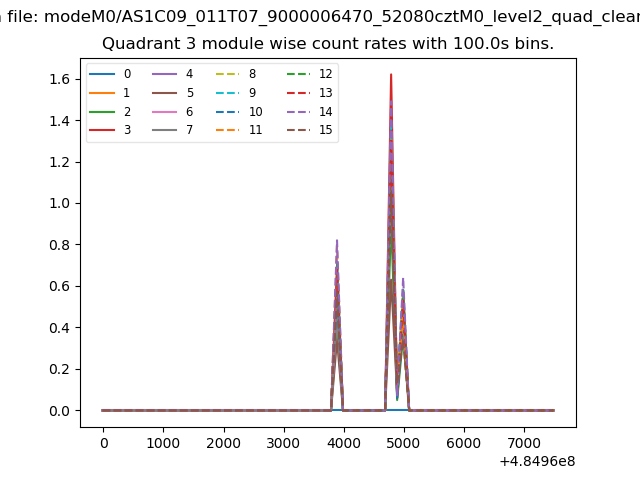
| Module-wise count rates for Quadrant A Data is divided into 100 sec bins |
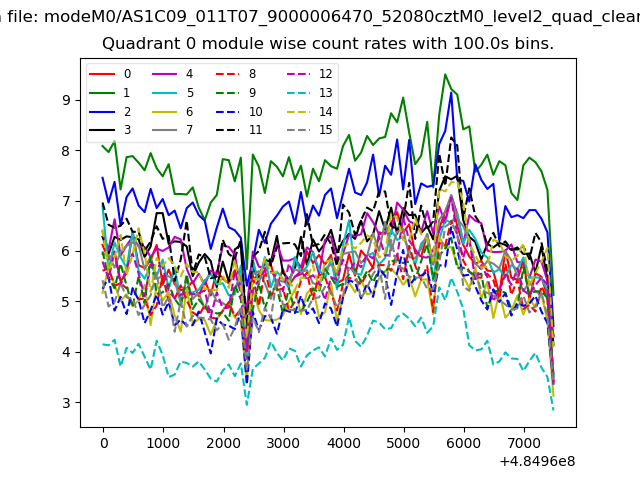 |
 |
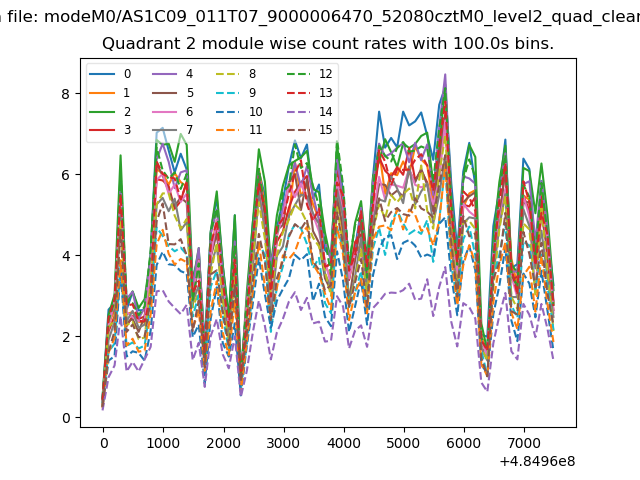
| Module-wise count rates for Quadrant B Data is divided into 100 sec bins |
 |
 |
| Module-wise count rates for Quadrant C Data is divided into 100 sec bins |
 |
 |
| Module-wise count rates for Quadrant D Data is divided into 100 sec bins |
 |
 |
| Parameter | Plot |
|---|---|
| CZT HV Monitor | 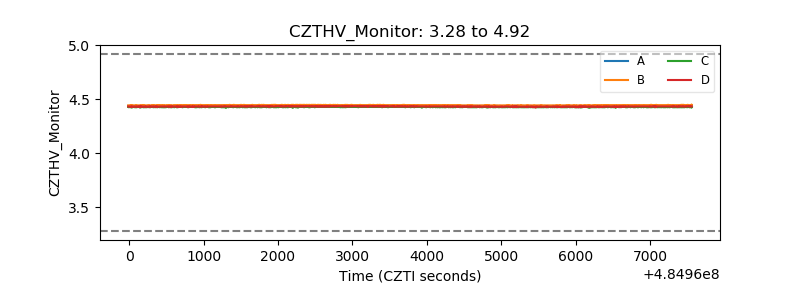 |
| D_VDD | 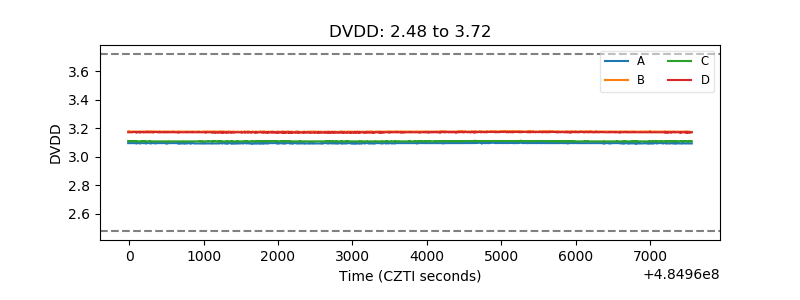 |
| Temperature 1 | 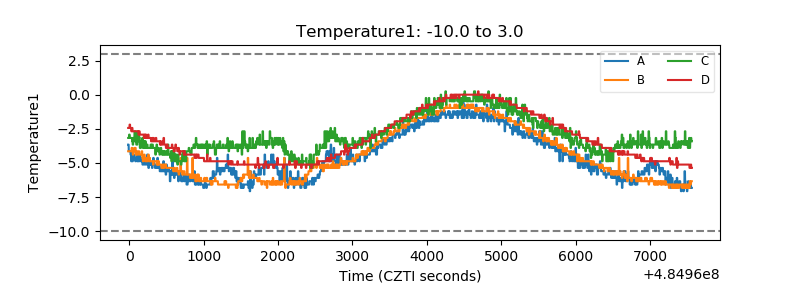 |
| Veto HV Monitor |  |
| Veto LLD | 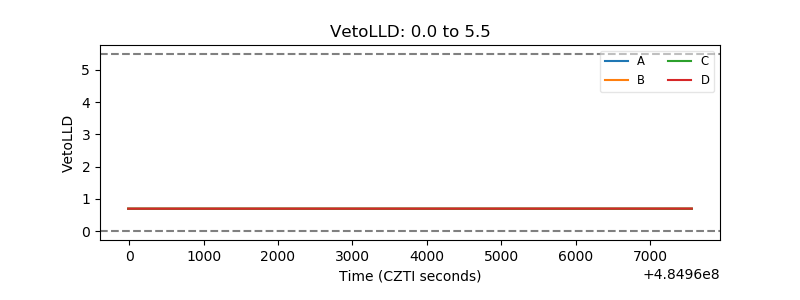 |
| Alpha Counter | 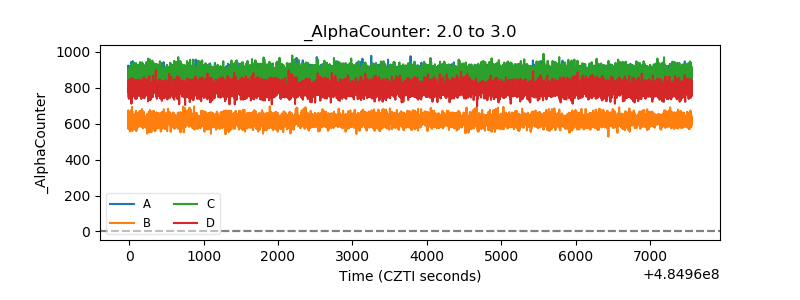 |
| _CPM_Rate | 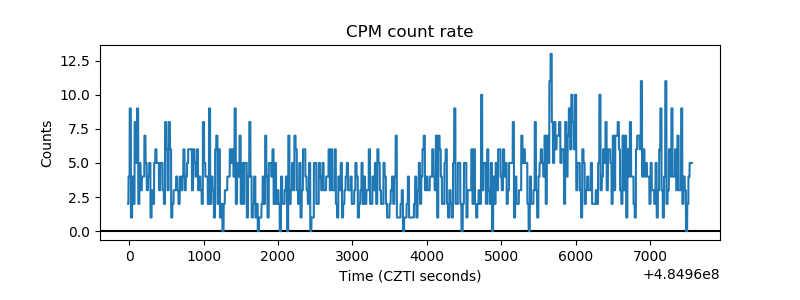 |
| CZT Counter | 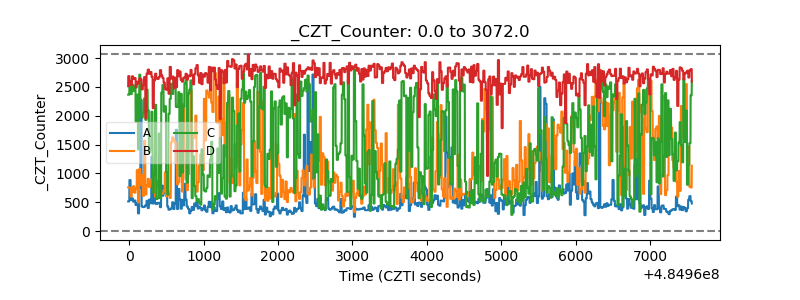 |
| +2.5 Volts monitor | 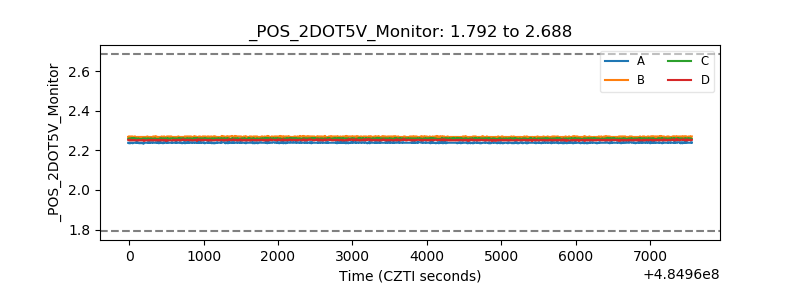 |
| +5 Volts monitor | 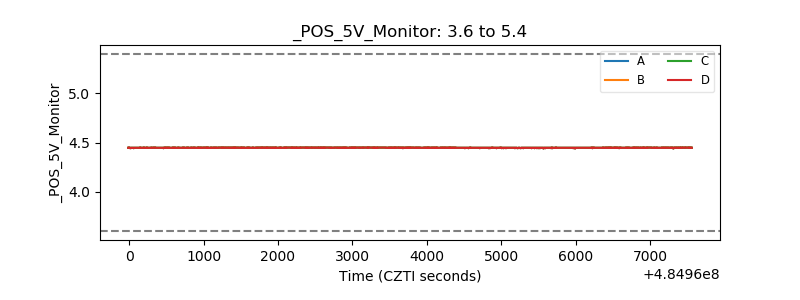 |
| _ROLL_ROT | 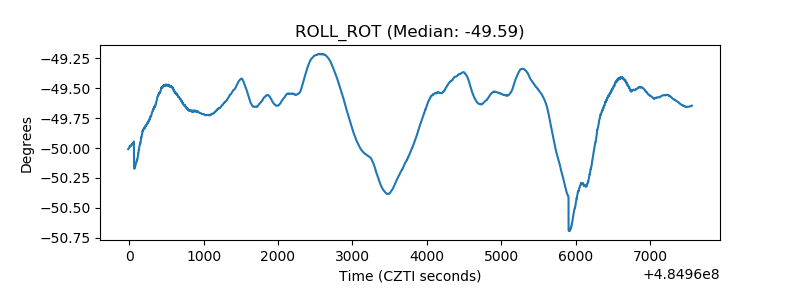 |
| _Roll_DEC | 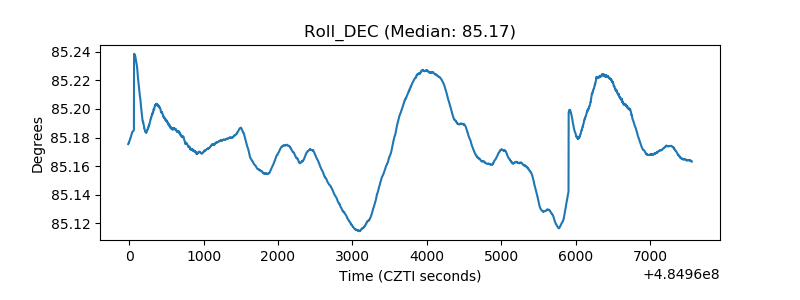 |
| _Roll_RA | 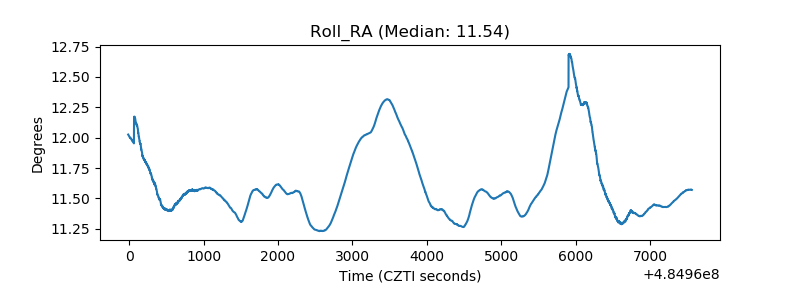 |
| Veto Counter | 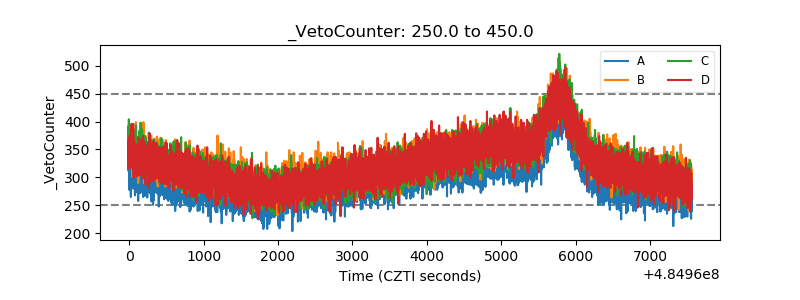 |