| Param | Original file | Final file |
|---|---|---|
| Filename | modeM0/AS1C09_011T07_9000006470_52081cztM0_level2.fits | modeM0/AS1C09_011T07_9000006470_52081cztM0_level2_quad_clean.evt |
| Size (bytes) | 1,418,250,240 | 67,769,280 |
| Size | 1.3 GB | 64.6 MB |
| Events in quadrant A | 4,321,885 | 713,605 |
| Events in quadrant B | 14,657,595 | 297,207 |
| Events in quadrant C | 11,839,552 | 494,577 |
| Events in quadrant D | 21,078,152 | 1,569 |
| Mode SS | |||
|---|---|---|---|
| Quadrant | BADHDUFLAG | Total packets | Discarded packets |
| A | 0 | 160 | 2 |
| B | 0 | 160 | 0 |
| C | 0 | 158 | 0 |
| D | 0 | 160 | 0 |
| Mode M0 | |||
|---|---|---|---|
| Quadrant | BADHDUFLAG | Total packets | Discarded packets |
| A | 0 | 18656 | 121 |
| B | 0 | 49870 | 954 |
| C | 0 | 41332 | 671 |
| D | 0 | 69193 | 1136 |
| Quadrant | Total seconds | Saturated seconds | Saturation percentage |
|---|---|---|---|
| A | 7868 | 130 | 1.652262% |
| B | 7797 | 5085 | 65.217391% |
| C | 7820 | 2732 | 34.936061% |
| D | 7799 | 7786 | 99.833312% |
Noise dominated data is calculated using 1-second bins in cleaned event files. If a bin has >2000 counts, and if more than 50% of those come from <1% of pixels, then it is considered to be noise-dominated and hence unusable.
| Quadrant | # 1 sec bins | Bins with >0 counts | Bins with >2000 counts | High rate bins dominated by noise | Noise dominated (total time) | Noise dominated (detector-on time) | Marked lightcurve |
|---|---|---|---|---|---|---|---|
| A | 7931 | 7897 | 125 | 125 | 1.58% | 1.58% | 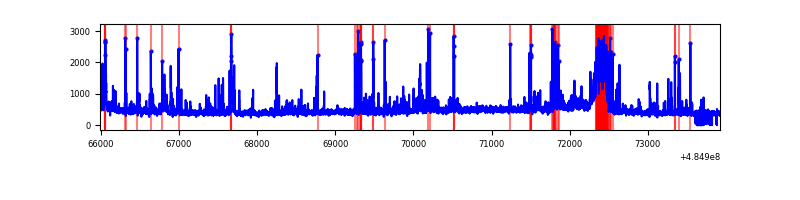 |
| B | 7931 | 7801 | 4031 | 4031 | 50.83% | 51.67% |  |
| C | 7931 | 7849 | 2604 | 2604 | 32.83% | 33.18% | 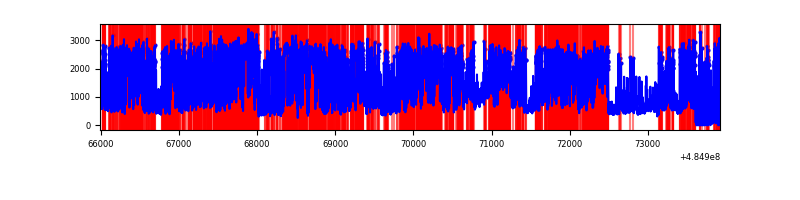 |
| D | 7931 | 7798 | 7728 | 7728 | 97.44% | 99.10% | 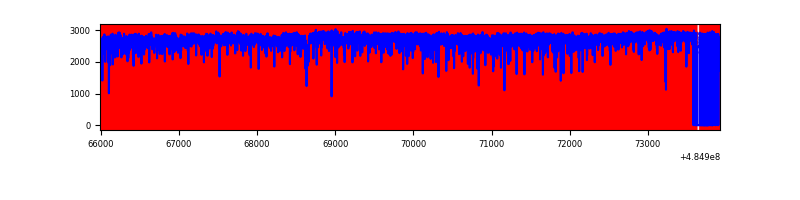 |
Top three noisy pixels from each quadrant. If the there are fewer than three noisy pixels in the level2.evt file, extra rows are filled as -1
| Pixel properties | Quadrant properties | ||||||
|---|---|---|---|---|---|---|---|
| Quadrant | DetID | PixID | Counts | Sigma | Mean | Median | Sigma |
| A | 3 | 130 | 306651 | 1531.61 | 800 | 781 | 199.7 |
| A | 6 | 196 | 211085 | 1053.08 | 800 | 781 | 199.7 |
| A | 5 | 240 | 119390 | 593.92 | 800 | 781 | 199.7 |
| B | 5 | 172 | 10256766 | 104061.8 | 461 | 446 | 98.6 |
| B | 10 | 128 | 1020684 | 10351.45 | 461 | 446 | 98.6 |
| B | 10 | 254 | 534314 | 5416.69 | 461 | 446 | 98.6 |
| C | 15 | 224 | 5341545 | 28565.47 | 674 | 668 | 187.0 |
| C | 5 | 80 | 2506909 | 13404.53 | 674 | 668 | 187.0 |
| C | 2 | 239 | 349304 | 1864.67 | 674 | 668 | 187.0 |
| D | 15 | 94 | 19357436 | 501459.22 | 127 | 121 | 38.6 |
| D | 6 | 42 | 641396 | 16612.49 | 127 | 121 | 38.6 |
| D | 3 | 12 | 168088 | 4351.25 | 127 | 121 | 38.6 |
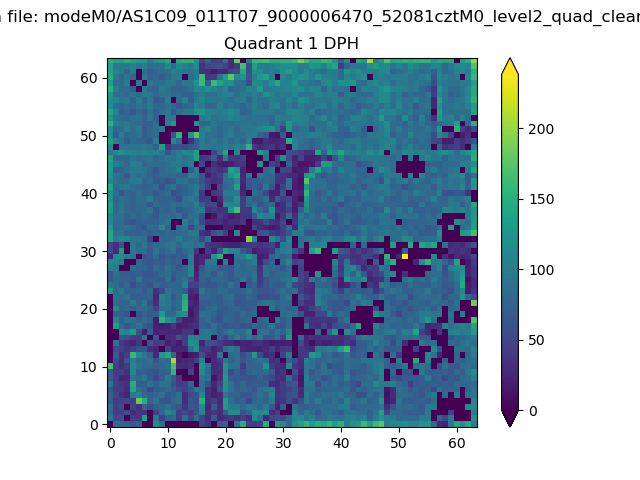
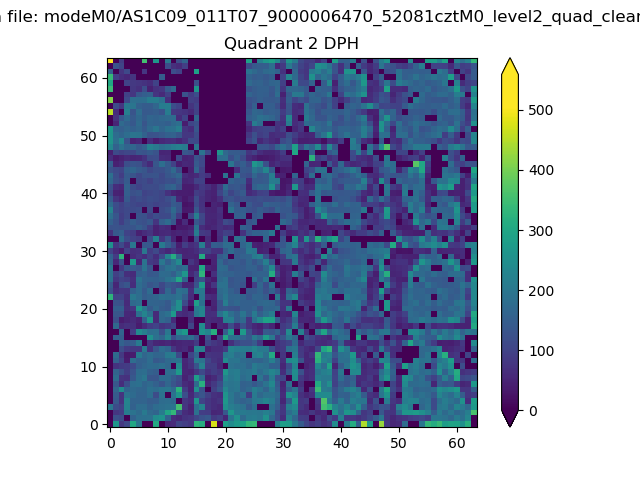
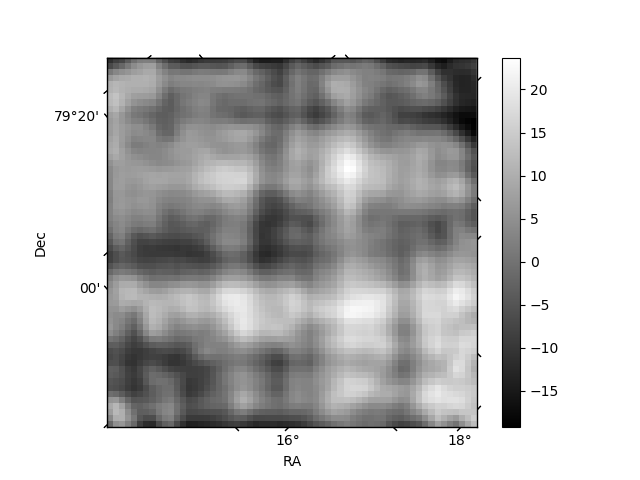
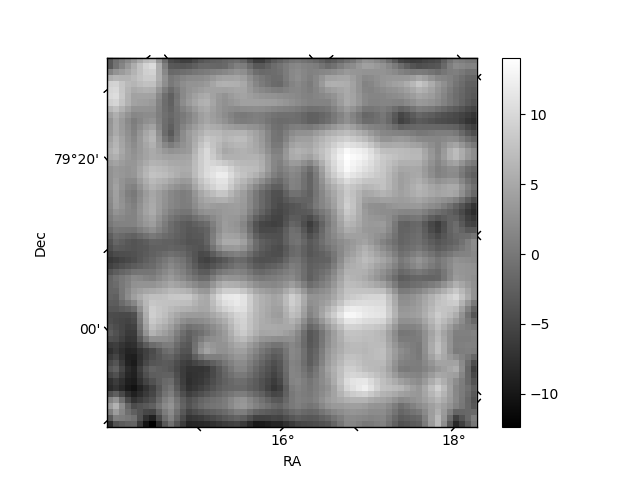
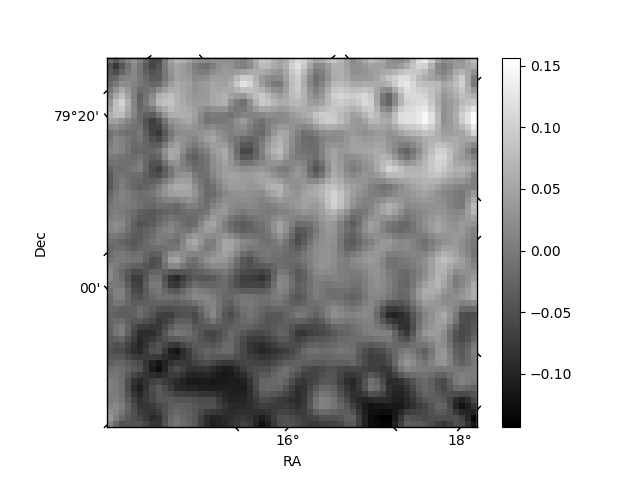
Histogram calculated using DETX and DETY for each event in the final _common_clean file
| Quadrant A | 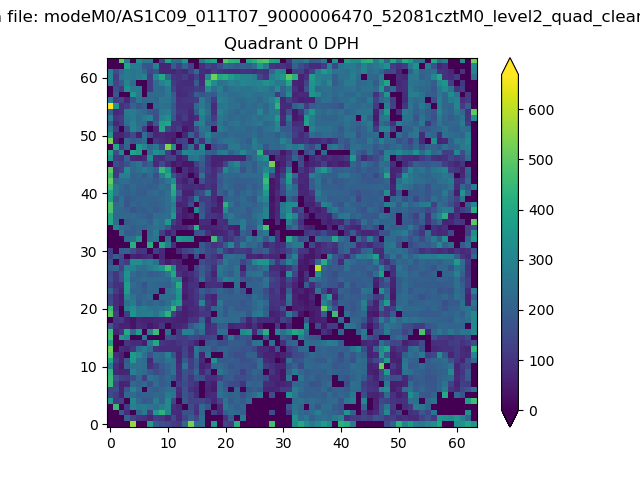 |
 |
Quadrant B |
|---|---|---|---|
| Quadrant D | 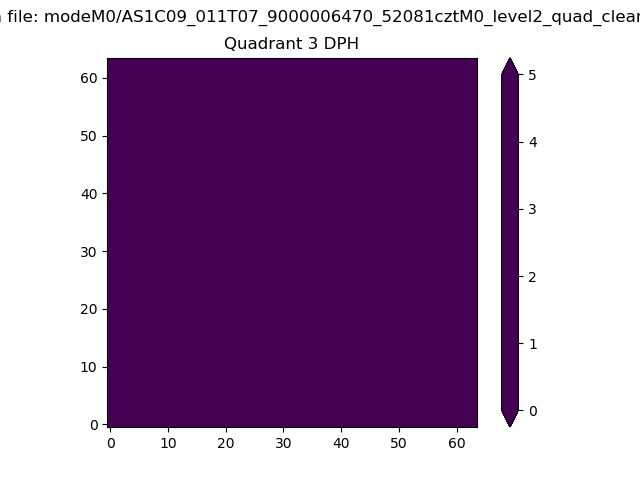 |
 |
Quadrant C |
| Plot type | Count rate plots | Images |
|---|---|---|
| Comparison with Poisson distribution Blue bars denote a histogram of data divided into 1 sec bins. Red curve is a Poisson curve with rate = median count rate of data. |
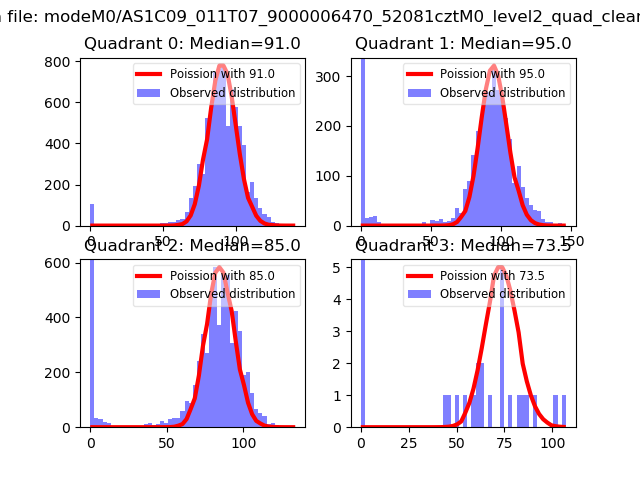 |
 |
| Quadrant-wise count rates Data is divided into 100 sec bins |
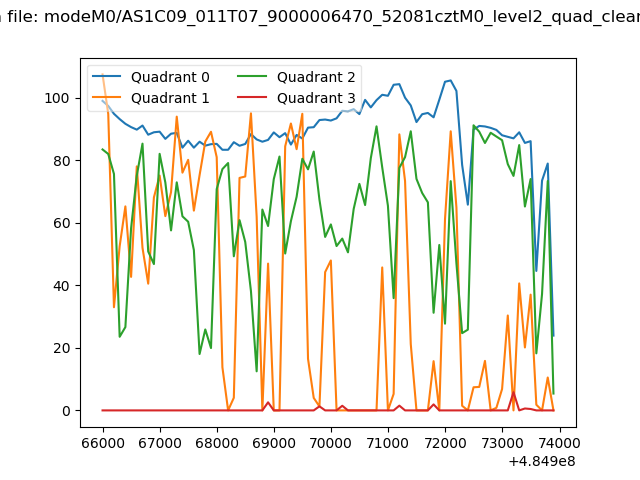 |
|
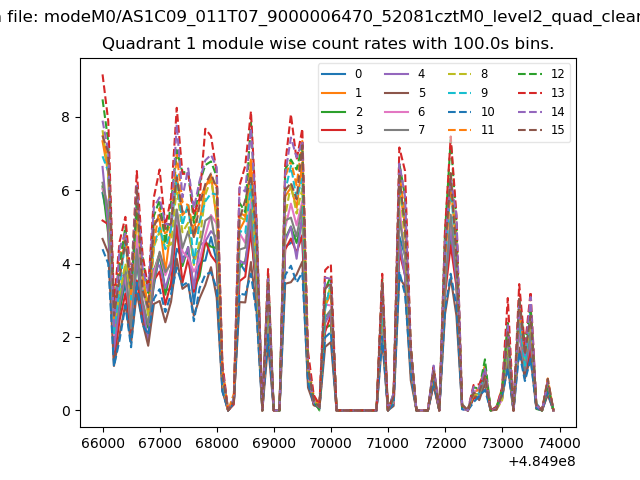
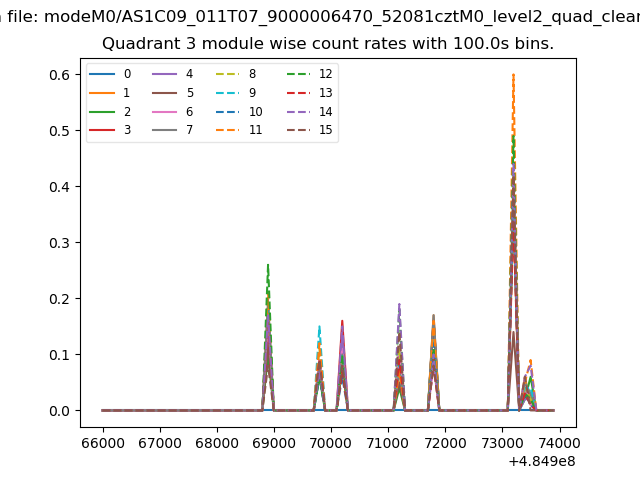
| Module-wise count rates for Quadrant A Data is divided into 100 sec bins |
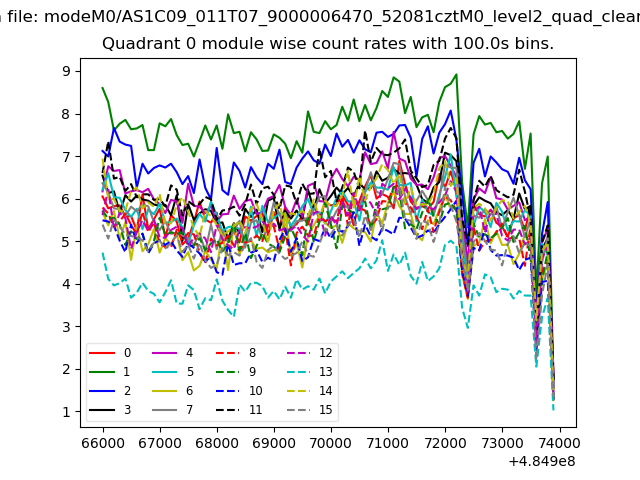 |
 |
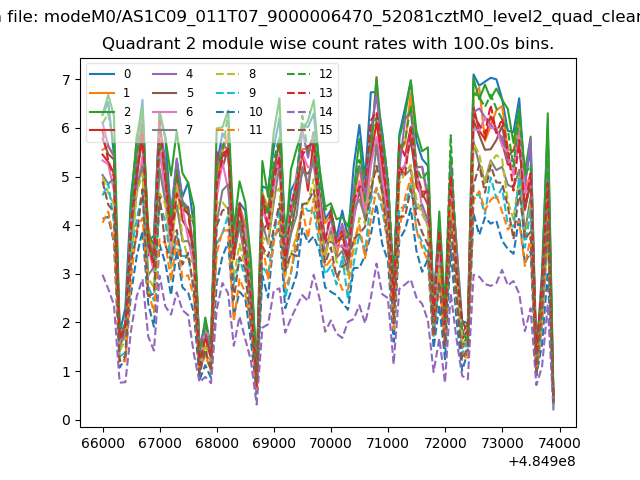
| Module-wise count rates for Quadrant B Data is divided into 100 sec bins |
 |
 |
| Module-wise count rates for Quadrant C Data is divided into 100 sec bins |
 |
 |
| Module-wise count rates for Quadrant D Data is divided into 100 sec bins |
 |
 |
| Parameter | Plot |
|---|---|
| CZT HV Monitor | 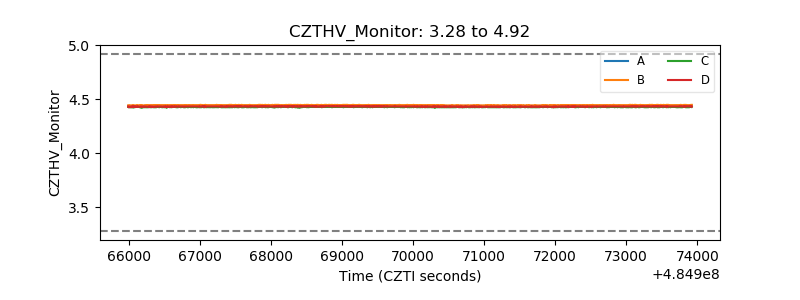 |
| D_VDD | 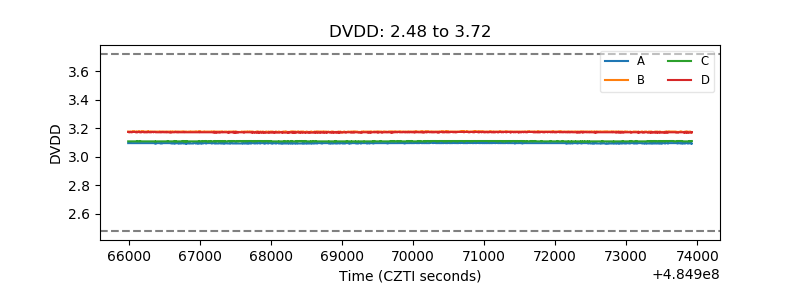 |
| Temperature 1 | 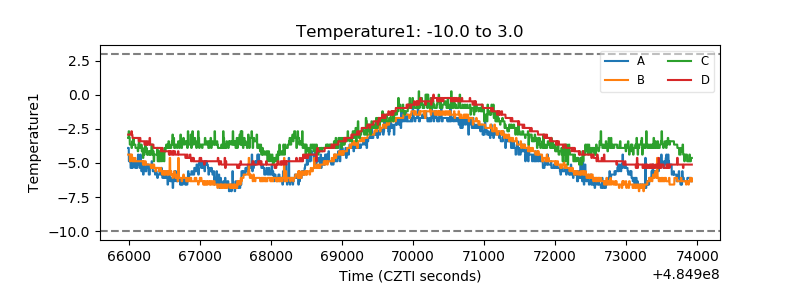 |
| Veto HV Monitor | 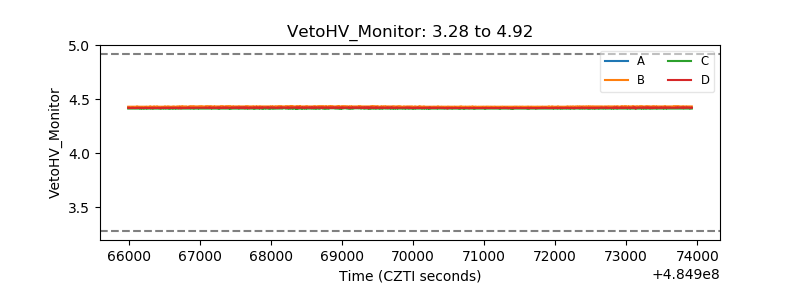 |
| Veto LLD | 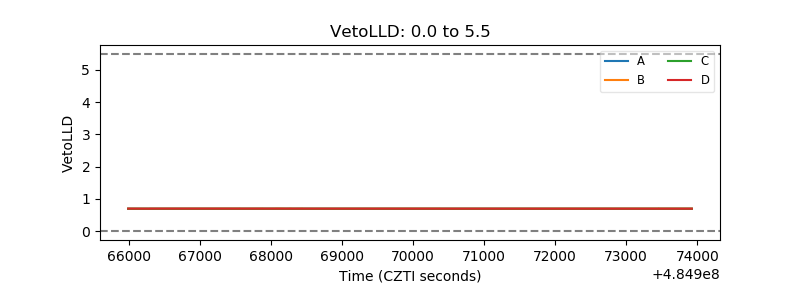 |
| Alpha Counter | 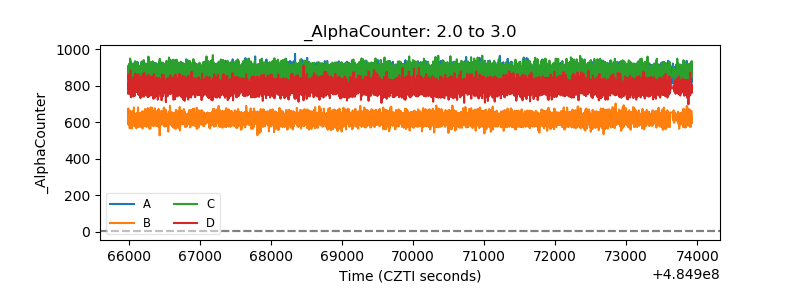 |
| _CPM_Rate | 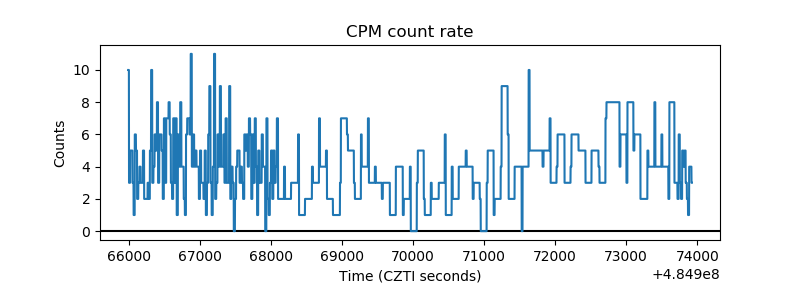 |
| CZT Counter | 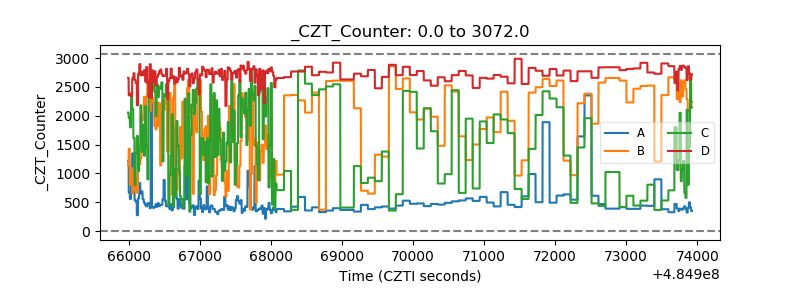 |
| +2.5 Volts monitor |  |
| +5 Volts monitor | 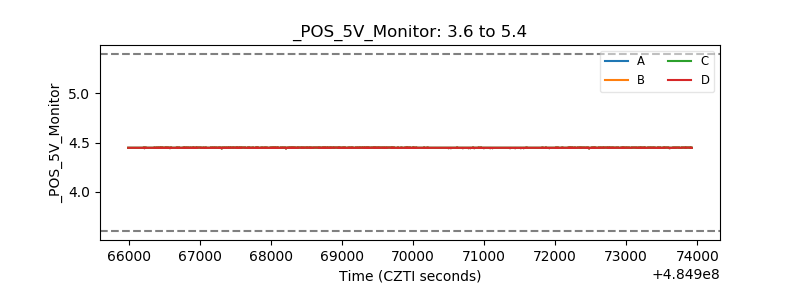 |
| _ROLL_ROT | 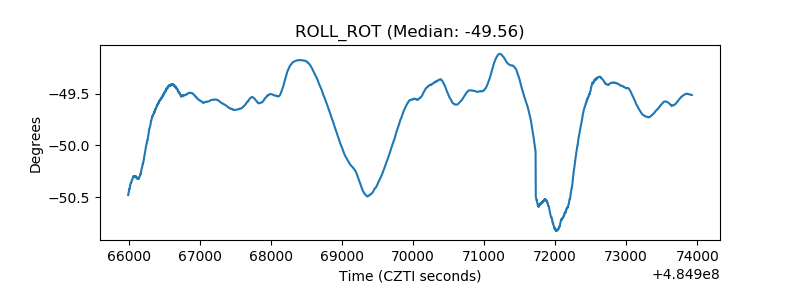 |
| _Roll_DEC | 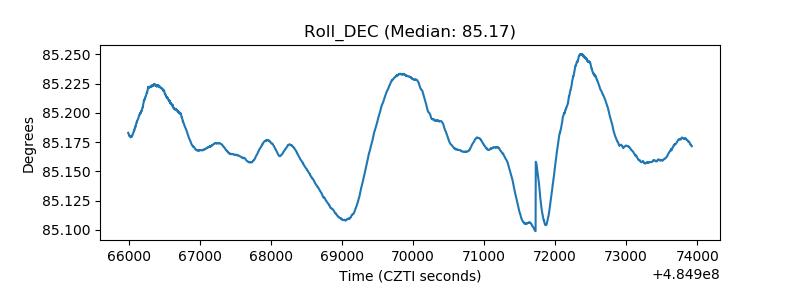 |
| _Roll_RA | 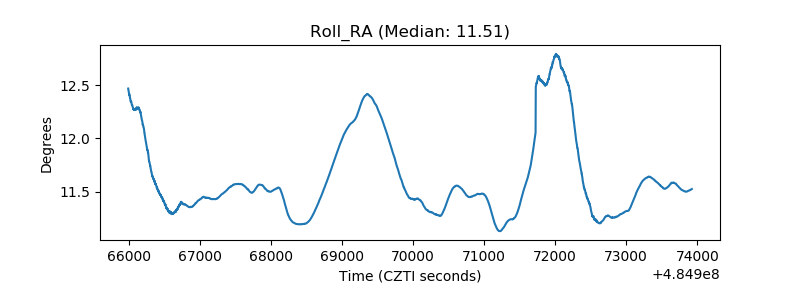 |
| Veto Counter | 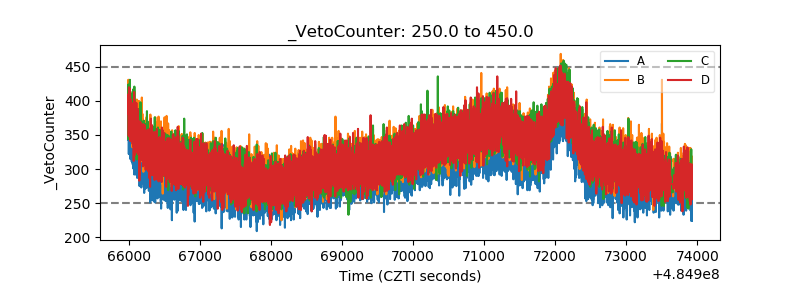 |