| Param | Original file | Final file |
|---|---|---|
| Filename | modeM0/AS1C09_011T07_9000006470_52082cztM0_level2.fits | modeM0/AS1C09_011T07_9000006470_52082cztM0_level2_quad_clean.evt |
| Size (bytes) | 1,186,715,520 | 55,169,280 |
| Size | 1.1 GB | 52.6 MB |
| Events in quadrant A | 4,528,183 | 550,991 |
| Events in quadrant B | 10,949,352 | 300,613 |
| Events in quadrant C | 10,871,875 | 358,987 |
| Events in quadrant D | 17,088,902 | 15,331 |
| Mode SS | |||
|---|---|---|---|
| Quadrant | BADHDUFLAG | Total packets | Discarded packets |
| A | 0 | 126 | 0 |
| B | 0 | 126 | 0 |
| C | 0 | 126 | 0 |
| D | 0 | 126 | 0 |
| Mode M0 | |||
|---|---|---|---|
| Quadrant | BADHDUFLAG | Total packets | Discarded packets |
| A | 0 | 18143 | 0 |
| B | 0 | 36960 | 5 |
| C | 0 | 36731 | 0 |
| D | 0 | 54938 | 0 |
| Quadrant | Total seconds | Saturated seconds | Saturation percentage |
|---|---|---|---|
| A | 6366 | 454 | 7.131637% |
| B | 6365 | 3594 | 56.465043% |
| C | 6365 | 2771 | 43.534957% |
| D | 6365 | 6235 | 97.957581% |
Noise dominated data is calculated using 1-second bins in cleaned event files. If a bin has >2000 counts, and if more than 50% of those come from <1% of pixels, then it is considered to be noise-dominated and hence unusable.
| Quadrant | # 1 sec bins | Bins with >0 counts | Bins with >2000 counts | High rate bins dominated by noise | Noise dominated (total time) | Noise dominated (detector-on time) | Marked lightcurve |
|---|---|---|---|---|---|---|---|
| A | 6366 | 6366 | 382 | 382 | 6.00% | 6.00% | 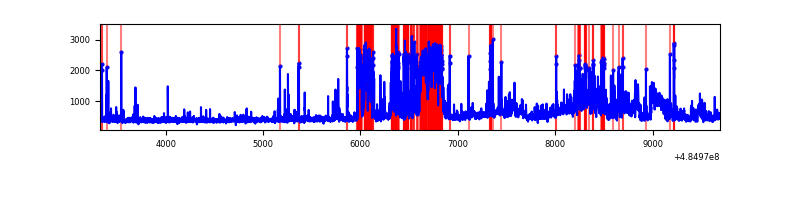 |
| B | 6365 | 6365 | 2701 | 2701 | 42.44% | 42.44% | 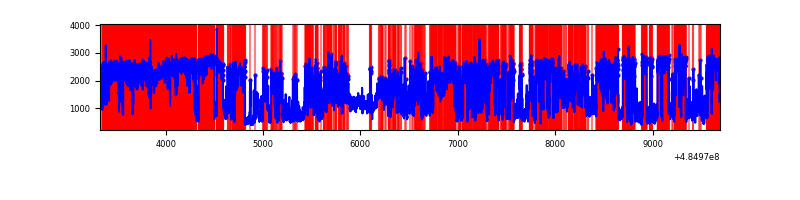 |
| C | 6365 | 6365 | 2695 | 2695 | 42.34% | 42.34% | 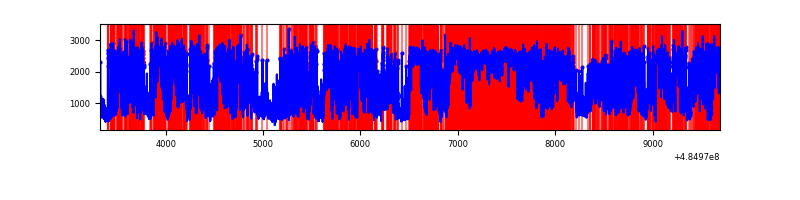 |
| D | 6364 | 6364 | 6185 | 6185 | 97.19% | 97.19% | 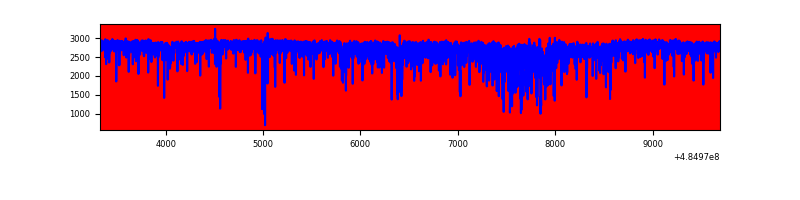 |
Top three noisy pixels from each quadrant. If the there are fewer than three noisy pixels in the level2.evt file, extra rows are filled as -1
| Pixel properties | Quadrant properties | ||||||
|---|---|---|---|---|---|---|---|
| Quadrant | DetID | PixID | Counts | Sigma | Mean | Median | Sigma |
| A | 11 | 3 | 471308 | 2889.45 | 648 | 631 | 162.9 |
| A | 3 | 130 | 449930 | 2758.21 | 648 | 631 | 162.9 |
| A | 5 | 241 | 236543 | 1448.24 | 648 | 631 | 162.9 |
| B | 5 | 172 | 7356007 | 82691.77 | 416 | 402 | 89.0 |
| B | 10 | 254 | 864726 | 9716.74 | 416 | 402 | 89.0 |
| B | 10 | 128 | 223570 | 2508.86 | 416 | 402 | 89.0 |
| C | 15 | 224 | 3519336 | 24756.4 | 514 | 510 | 142.1 |
| C | 5 | 80 | 2958760 | 20812.52 | 514 | 510 | 142.1 |
| C | 15 | 248 | 1315724 | 9253.08 | 514 | 510 | 142.1 |
| D | 15 | 94 | 13660966 | 253941.44 | 179 | 170 | 53.8 |
| D | 6 | 42 | 1781634 | 33115.75 | 179 | 170 | 53.8 |
| D | 3 | 12 | 405818 | 7540.62 | 179 | 170 | 53.8 |
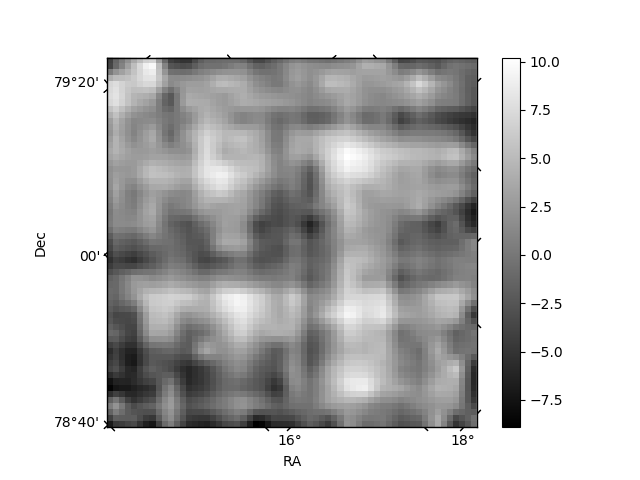
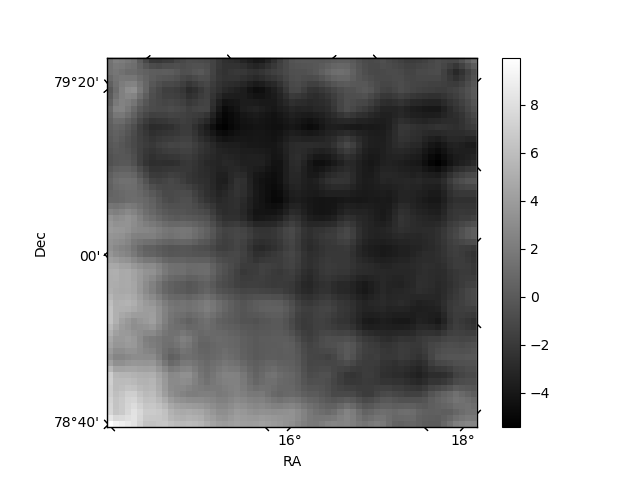
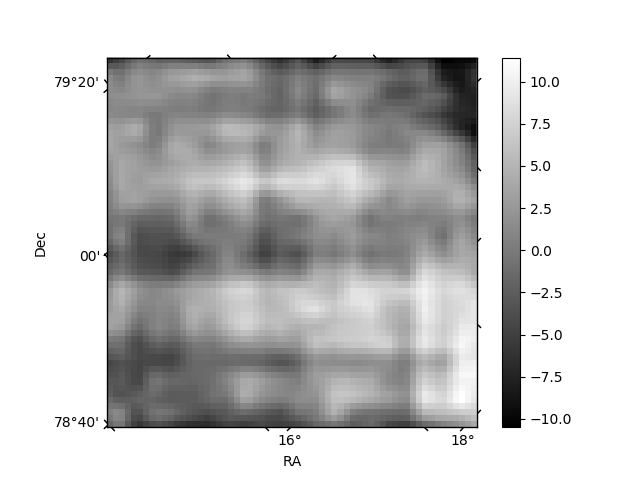
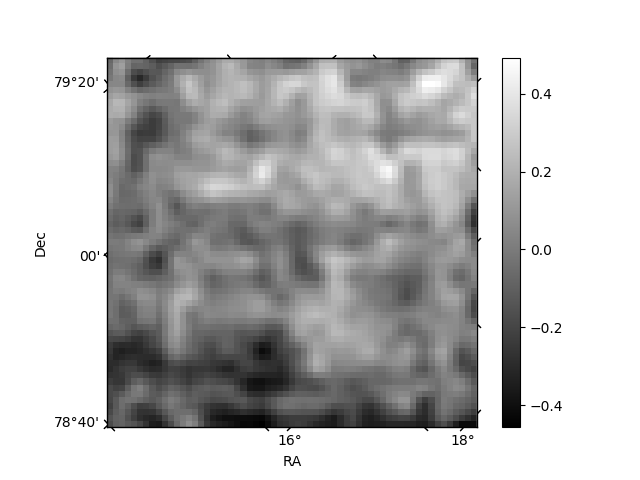
Histogram calculated using DETX and DETY for each event in the final _common_clean file
| Quadrant A | 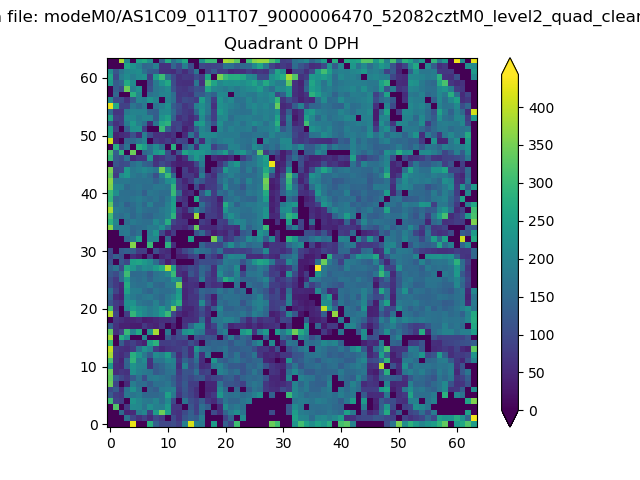 |
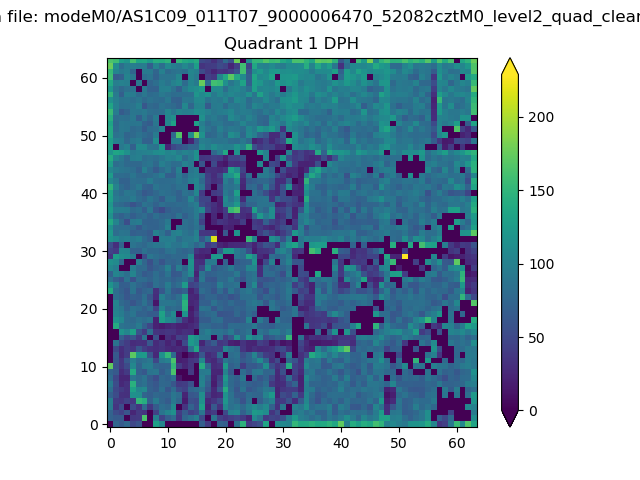 |
Quadrant B |
|---|---|---|---|
| Quadrant D | 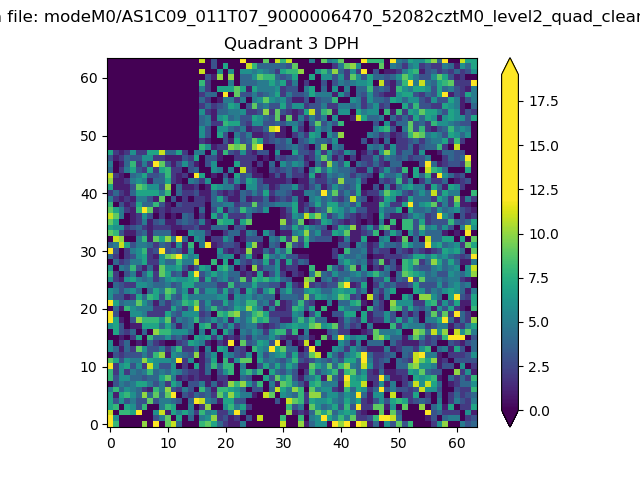 |
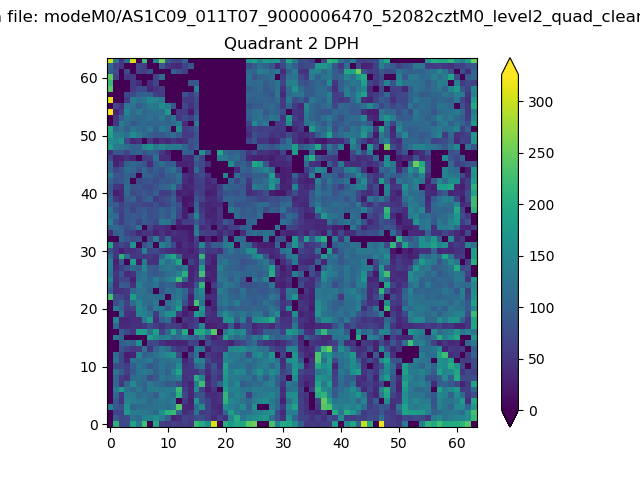 |
Quadrant C |
| Plot type | Count rate plots | Images |
|---|---|---|
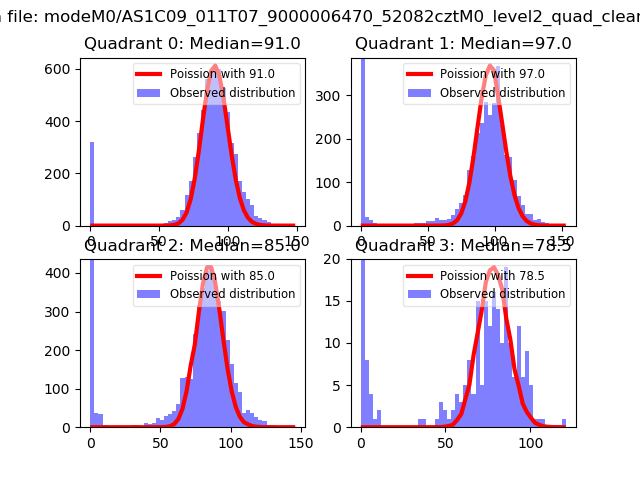
| Comparison with Poisson distribution Blue bars denote a histogram of data divided into 1 sec bins. Red curve is a Poisson curve with rate = median count rate of data. |
 |
 |
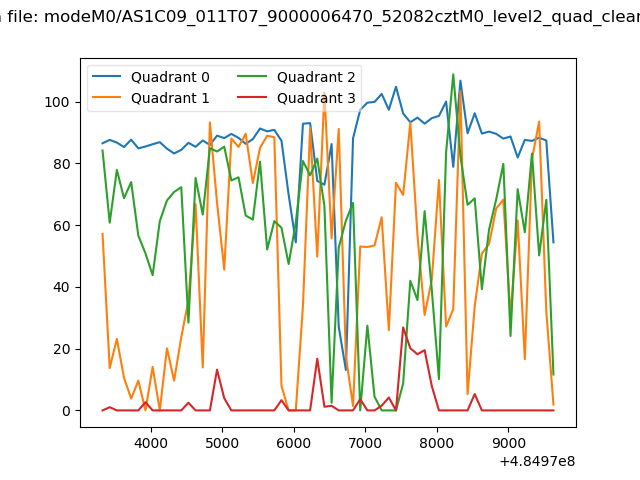
| Quadrant-wise count rates Data is divided into 100 sec bins |
 |
|
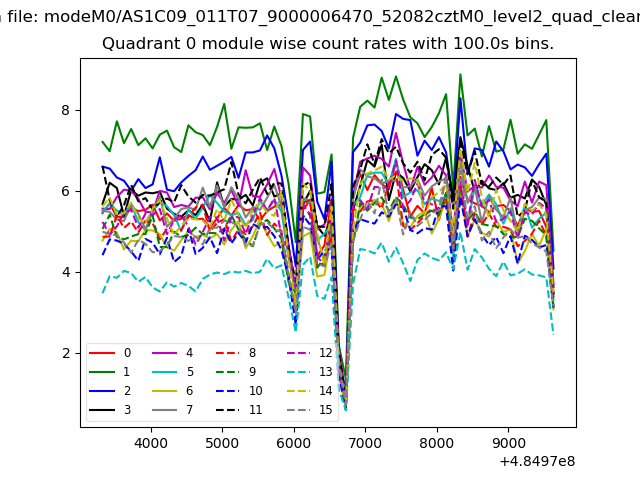
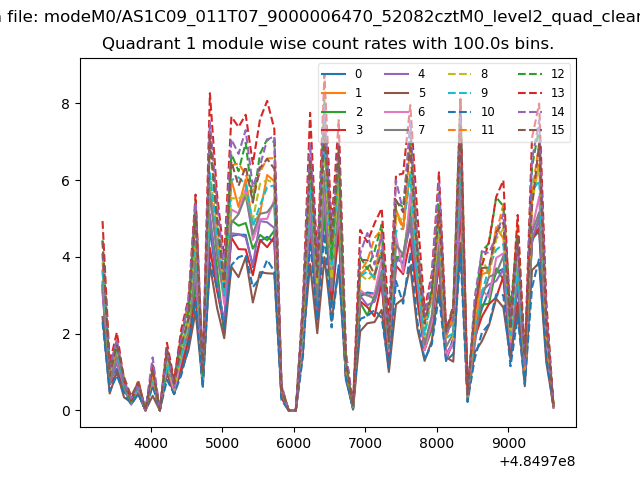
| Module-wise count rates for Quadrant A Data is divided into 100 sec bins |
 |
 |
| Module-wise count rates for Quadrant B Data is divided into 100 sec bins |
 |
 |
| Module-wise count rates for Quadrant C Data is divided into 100 sec bins |
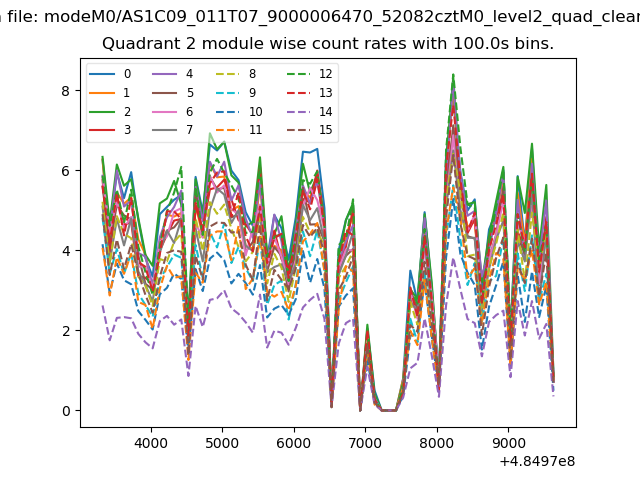 |
 |
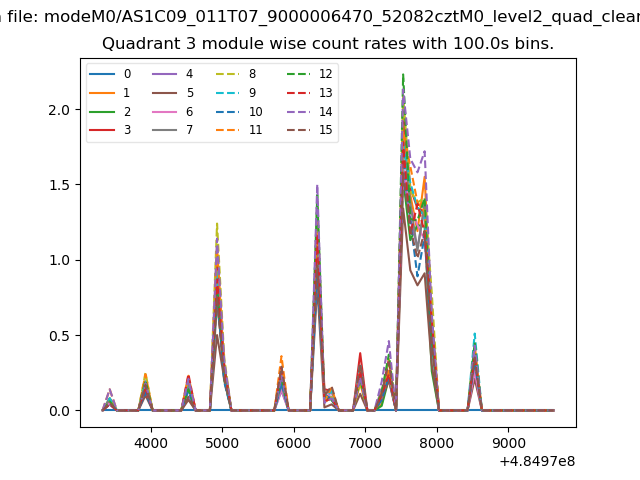
| Module-wise count rates for Quadrant D Data is divided into 100 sec bins |
 |
 |
| Parameter | Plot |
|---|---|
| CZT HV Monitor | 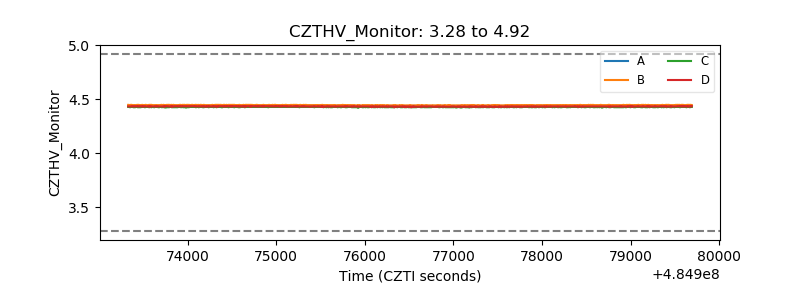 |
| D_VDD | 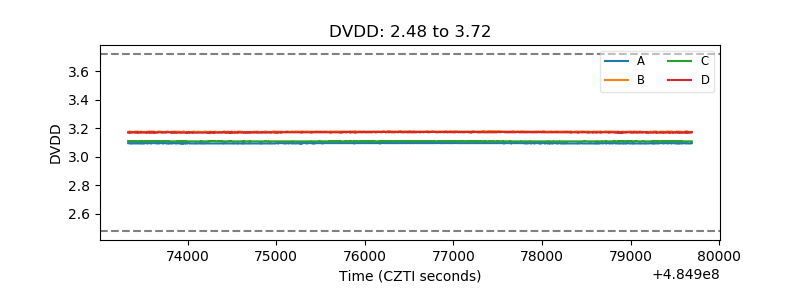 |
| Temperature 1 | 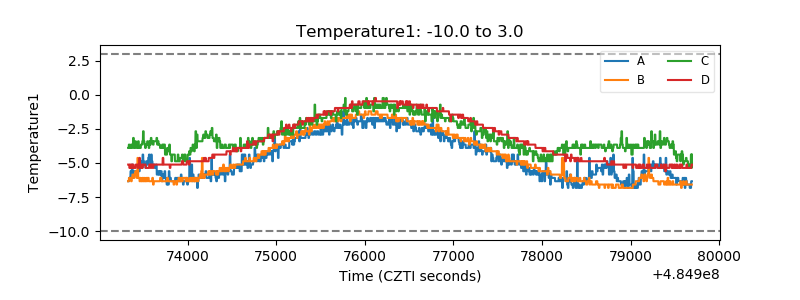 |
| Veto HV Monitor |  |
| Veto LLD | 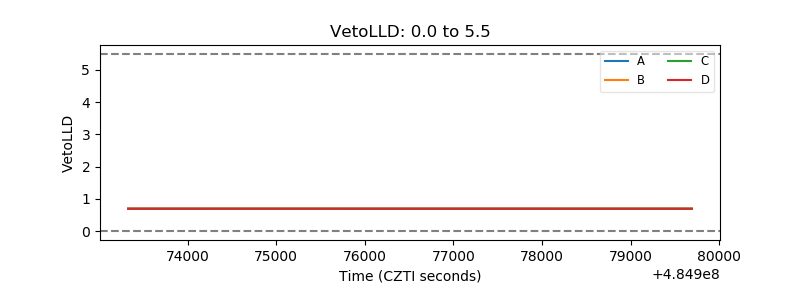 |
| Alpha Counter | 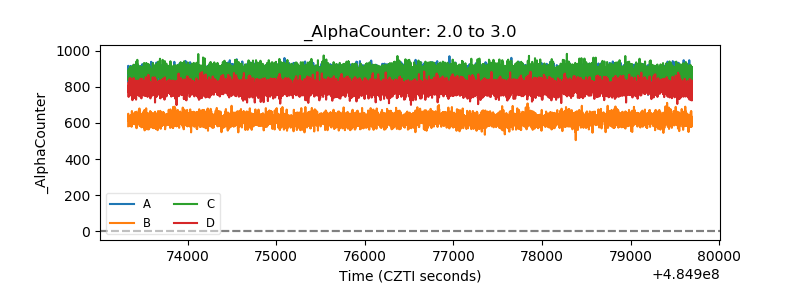 |
| _CPM_Rate | 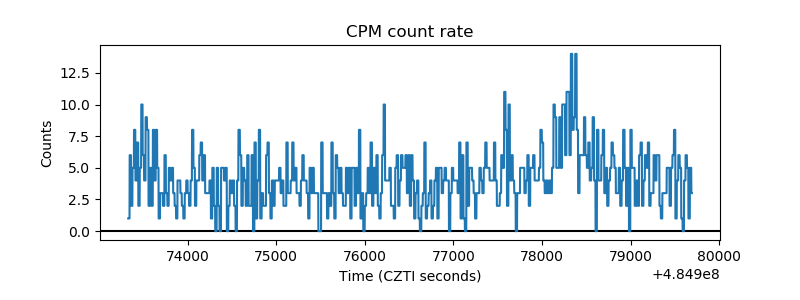 |
| CZT Counter | 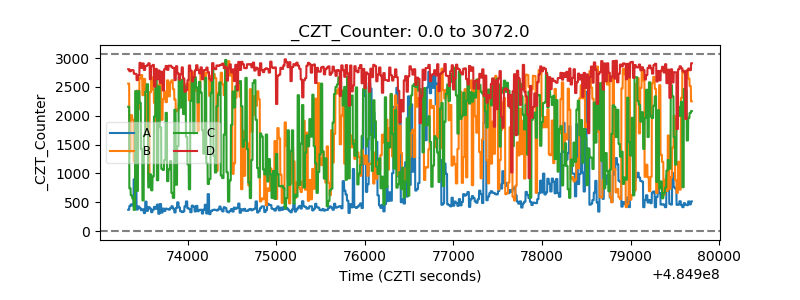 |
| +2.5 Volts monitor | 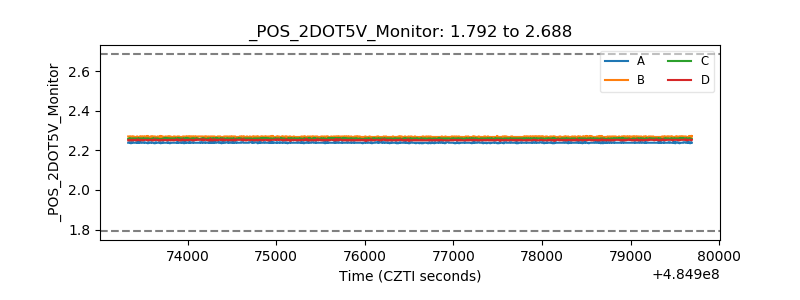 |
| +5 Volts monitor | 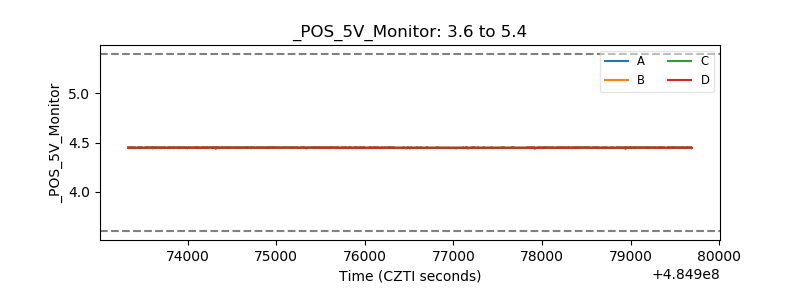 |
| _ROLL_ROT | 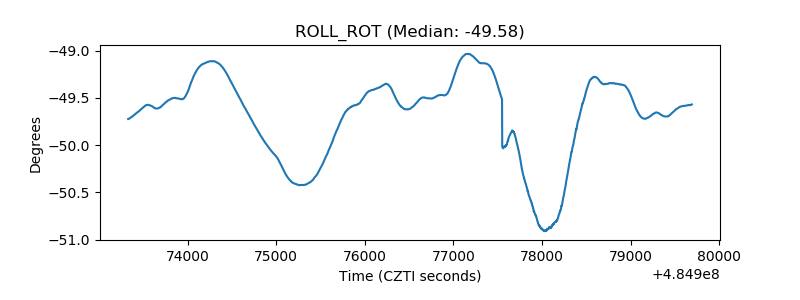 |
| _Roll_DEC | 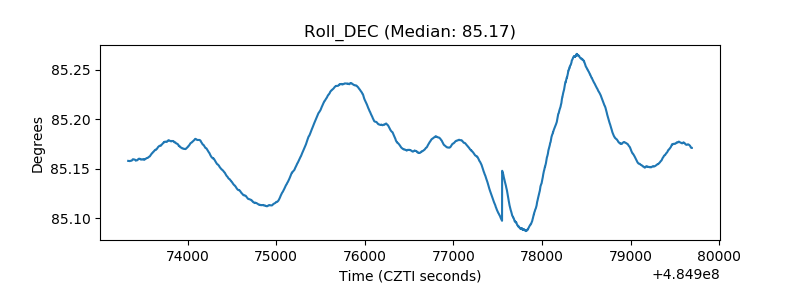 |
| _Roll_RA | 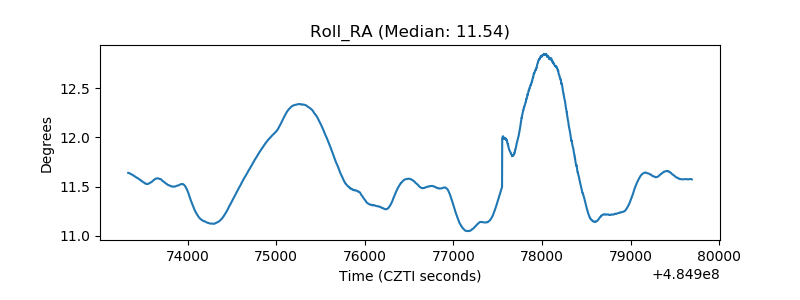 |
| Veto Counter | 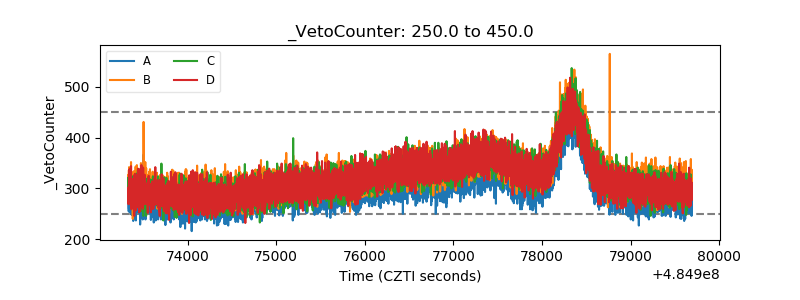 |